
Over the last decade, no kill sheltering spread across the country. As animal control facilities became no kill, others became inspired or pressured to do the same. What was once viewed as a fluke is now fairly common.
While this is the most transformational event in the history of animal sheltering, the question remains are all no kill shelters the same? Do all no kill shelters take the same path to ending the killing of healthy and treatable animals? What things do some no kill shelters do better or worse than others? Are some of these shelters really even no kill? This blog will address these questions.
Analysis and Data Reviewed
To answer these questions, I selected five large no kill animal control shelters and computed metrics to evaluate 1) the difficulty of the challenge each facility faces, 2) each shelter’s commitment to the fundamental no kill principal, respect for life, and 3) the effectiveness of each shelter’s programming to get animals out of their facility alive.
The analyses used each shelter’s intake and disposition records. These records list each individual animal the shelters took in and their outcomes. Additionally, these records disclose the reasons why shelters euthanized animals. Also, these records include data to calculate how long animals stayed at the facilities.
I also examined numerous other documents. In the case of one shelter, I used its summary statistics to compute some of its death rates since this information was more accurate than the intake and disposition records. Additionally, I examined government shelter budgets and nonprofit Form 990s to determine each facility’s funding. Finally, I examined each shelter’s web sites and news stories to obtain other information used in this blog.
While 2020 is the most recent year, it is inappropriate to use since shelters took significantly fewer animals in and had to drastically cut back on programming due to COVID-19. Therefore, I used 2019 data to conduct the bulk of my analyses. However, I supplemented the 2019 analysis with a high level review of 1) 2020 data over the first three months of the pandemic and 2) full 2020 data.
No Kill Shelters Used in Analysis
I used the following no kill shelters in the analysis. These shelters are ones I’ve either previously examined or have stellar reputations. In addition, I chose large facilities (i.e. all shelters took in more than 5,000 dogs and cats during 2019) to ensure the analysis focused on those organizations with significant challenges.
- Austin Animal Center – Austin and Travis County, Texas: The City of Austin spearheaded the no kill movement over the last decade. After long advocacy efforts and programming created by Austin Pets Alive, Austin Animal Center, the animal control shelter, first exceeded a 90% live release rate in 2012. Subsequently, the shelter significantly improved and I detailed the shelter’s statistics in both 2017 and 2018 here and here. Since Austin Pets Alive, which pulls large numbers of Austin Animal Center’s most challenging animals, plays such a critical role in saving Austin’s no kill effort, I also incorporated Austin Pets Alive in the analysis. Austin Pets Alive is a major force through its American Pets Alive brand (e.g. its annual American Pets Alive Conference) in spreading the no kill message across the country. While not as prominent as Austin Pets Alive, Austin Animal Center also frequently spoke at the American Pets Alive Conference and shared its successes through blogs, webinars, etc.
- Pima Animal Care Center – Tucson and Pima County, Arizona: Austin Animal Center’s former Deputy Chief Animal Services Officer, Kristen Hassen-Auerbach, became the leader of Pima Animal Care Center in July 2017 and ran the facility until October 2020. Prior to taking the shelter over, Pima Animal Care Center reported live release rates of 84% for dogs and 88% for cats. Ms. Hassen-Auerbach had a reputation for developing innovative programs at Austin Animal Center as well as at Fairfax County Animal Shelter in Virginia. During Ms. Hassen-Auerbach’s tenure at Pima Animal Care Center, she created many exciting programs. Additionally, Ms. Hassen-Auerbach became one of the most vocal people in the no kill movement through her prominent role at the American Pets Alive Conference and her numerous blogs and webinars.
- KC Pet Project – Kansas City, Missouri: KC Pet Project formed in 2011 and took over the the city shelter within a few months on January 1, 2012. After several months, KC Pet Project stated it reached a 90% live release rate. Subsequently, KC Pet Project has been a prominent voice at the American Pets Alive Conference and various other venues.
- Williamson County Animal Shelter – Williamson County, Texas: Williamson County Animal Shelter serves most of Williamson County, Texas, which is very close to Austin. The shelter reached a dog and cat combined 90% live release rate in 2013. The shelter was led by Cheryl Schneider as it improved until she retired in Spring 2020. While Ms. Schneider spoke at conferences, such as the American Pets Alive Conference, she did not appear as prominently as some of the directors of the previously mentioned shelters.
- Lake County Animal Shelter – Lake County, Florida: Lake County Animal Shelter implemented no kill policies on January 15, 2017 after a long shelter reform effort and bringing in No Kill Learning to create policies and programming. After around six months, the shelter hired Whitney Boylston as the director and she has run the shelter and developed programming since then. You can read my two blog’s on the shelter’s 2019 statistics here and how the shelter achieved its success here. Unlike the other shelters, national organizations have largely not publicized Lake County Animal Shelter as a no kill success story.
Some Shelters Face Tougher Challenges
Before we compare the shelters’ performances, we must examine the difficulties of their missions. If a shelter takes few animals in, receives lots of rescue assistance and is well-funded, it will have an easier job. Therefore, we will compare various metrics measuring these factors.
KC Pet Project Faced the Greatest Animal Volume Challenge
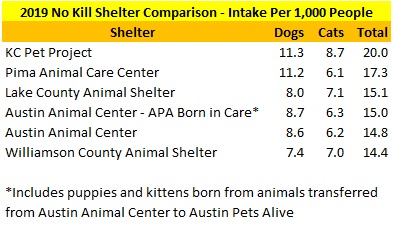
The following table lists the numbers of dogs and cats each shelter took in during 2019. As you can see, Austin Animal Center and Pima Animal Care Center impounded the most animals followed by KC Pet Project, Williamson County Animal Shelter and Lake County Animal Shelter.

While the total dogs and cats received is important, per capita intake is a better measure of a shelter’s animal volume challenge. Since this metric shows how many people can potentially reclaim, adopt and rescue a shelter’s animals, it is a better indicator of the difficulty a facility faces with animal intake. For example, a shelter with higher per capita intake may have a harder time finding enough people to adopt and rescue all their healthy and treatable animals.
The following table lists the per capita intake for each shelter in 2019. KC Pet Project had the highest per capita intake followed by Pima Animal Care Center, Lake County Animal Shelter, Austin Animal Center and Williamson County Animal Shelter. As I mentioned in my prior blog on Lake County Animal Shelter, the facility’s per capita intake might be slightly higher due to me excluding all cats brought to the shelter for sterilization services (some may have been shelter-neuter-return that should be included in intake).
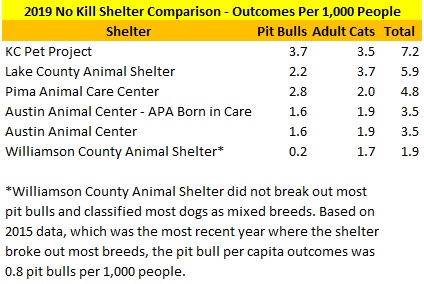
When we look at the most challenging animals for shelters to save, pit bulls and adult cats (i.e. 1+ year old cats), the results change a bit. Since I only had a breakdown of these categories by outcomes, I measured the per capita data this way (total outcomes and intakes are very similar). KC Pet Project impounded the greatest numbers of these animals, as well as pit bulls, on a per capita basis. Lake County Animal Shelter took the second most of these animals in and the most adult cats on a per capita basis.
Shelter capacity also plays a key challenge to facilities trying to become no kill. If a shelter does not have enough space, it may not have enough time to find adopters and rescues to save their homeless pets.
The following tables measure each shelter’s required average length of stay that is necessary for a shelter to avoid overcrowding (i.e. shelters must generate outcomes or put animals into foster homes within these time frames on average). Based on formulas you can find here, we can estimate the average length of stay a shelter must maintain to avoid overcrowding on a regular basis. To do this correctly, we would calculate this metric for both dogs and cats. Unfortunately, some shelters did not disclose separate dog and cat capacity. However, we can still get a sense of the shelter’s capacity resources by looking at the combined dog and cat required average length of stay. As you can see, all the shelters have to get animals out of their shelters quickly. Austin Animal Center (after incorporating a portion of Austin Pets Alive’s shelter capacity) had the shortest time to get animals out followed by KC Pet Project, Williamson County Animal Shelter, Pima Animal Care Center and Lake County Animal Shelter. While Austin Animal Center had the least amount of time to get animals out alive, its likely Austin Pets Alive would use more of its capacity (i.e. which would increase the required average length of stay) in the event Austin Animal Center faced a space crisis.

Lake County Animal Shelter Had The Worst Physical Facility
The physical facility’s condition also impacts lifesaving. For example, poorly designed buildings make it easy to spread disease and also stress animals out leading to behavioral problems.
The following table summarizes my assessments of each physical shelter’s condition in 2019 and 2020 and details when these facilities were built and renovated/expanded. As No Kill Learning noted in its March 2017 progress report on Lake County Animal Shelter, the physical shelter presents significant issues relating to disease management and animal behavior. Therefore, I classified this shelter as being in very poor condition. KC Pet Project also had a very poor physical facility in 2019, but I classified it as poor rather than very poor due to it having more physical space based on my personal visits. In 2020, Kansas City built a state of the art shelter in a desirable location. Both Williamson County Animal Shelter and Austin Animal Center were built within the last 10-15 years and had recent expansions. Based on Austin Animal Center having more modern kennels throughout its entire facility, I classified its condition as very good and Williamson County Animal Shelter as good. Finally, Pima Animal Care Center moved into a brand new state of the art facility at the end of 2017 and it therefore had the best physical shelter in 2019.

Lake County Animal Shelter Faced the Greatest Financial Challenge
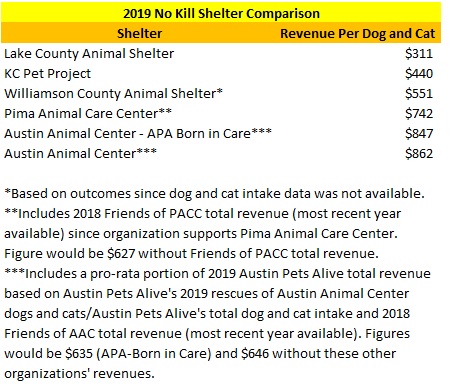
The shelters had significantly different levels of funding. As the table describes, I added supporting organizations’ revenues to Pima Animal Care Center’s and Austin Animal Center’s revenues (the rankings would be unchanged without me adding these revenues). Overall, Lake County Animal Shelter had the least funding followed by KC Pet Project. Both Austin Animal Center and Pima Animal Care had much more funding than the other shelters.
Austin Animal Center Receives Massive Rescue Support
Rescues can make an animal control shelter’s job much easier. If rescues take many of the shelter’s pets, the shelter has to do little work. While working with rescues is part of the No Kill Equation, no kill shelters that rely heavily on rescues can divert lifesaving from more needy shelters. Furthermore, no kill shelters relying heavily on transferring animals can regress to killing if rescues stop pulling many pets.
Austin Animal Center received far more rescue assistance than the other shelters. Overall, Austin Animal Center received two to six times more rescue assistance than the other facilities. Not only did Austin Animal Center receive lots of rescue help, Austin Pets Alive pulled many of the shelter’s most challenging animals. Even without Austin Pets Alive, Austin Animal Center transferred 9% of its dogs (i.e. more than all other shelters except Pima Animal Care Center) and 16% of its cats to other organizations (more than all the other facilities). Thus, Austin Animal Center received an unusually large amount of rescue assistance.
KC Pet Project, Williamson County Animal Shelter and Lake County Animal Shelter received similarly low levels of rescue support. While Pima Animal Care Center did not get nearly as much rescue help as Austin Animal Center, it still transferred two to three times more dogs and cats as the other three shelters.
When we look at just pit bulls and adult cats, KC Pet Project and Williamson County Animal Shelter received the least rescue support. Lake County Animal Shelter and Pima Animal Care Center transferred a slightly higher percentage of these animals, but it still was pretty low. Austin Animal Center transferred an even larger percentage of these difficult animals than it did for all dogs and cats (four to nine times the other shelters’ percentages).
In Part 2, I will examine each shelter’s commitment to respecting life.
