Over the last decade, no kill sheltering spread across the country. As animal control facilities became no kill, others became inspired or pressured to do the same. What was once viewed as a fluke is now fairly common.
While this is the most transformational event in the history of animal sheltering, the question remains are all no kill shelters the same? Do all no kill shelters take the same path to ending the killing of healthy and treatable animals? What things do some no kill shelters do better or worse than others? Are some of these shelters really even no kill? This blog will address these questions.
For those who just want to see the final rankings without reading the full analysis, skip to the end of the blog.
Analysis and Data Reviewed
To answer these questions, I selected five large no kill animal control shelters and computed metrics to evaluate 1) the difficulty of the challenge each facility faces, 2) each shelter’s commitment to the fundamental no kill principal, respect for life, and 3) the effectiveness of each shelter’s programming to get animals out of their facility alive.
The analyses used each shelter’s intake and disposition records. These records list each individual animal the shelters took in and their outcomes. Additionally, these records disclose the reasons why shelters euthanized animals. Also, these records include data to calculate how long animals stayed at the facilities.
I also examined numerous other documents. In the case of one shelter, I used its summary statistics to compute some of its death rates since this information was more accurate than the intake and disposition records (see explanation below). Additionally, I examined government shelter budgets and nonprofit Form 990s to determine each facility’s funding. Finally, I examined each shelter’s web sites and news stories to obtain other information used in this blog.
While 2020 is the most recent year, it is inappropriate to use since shelters took significantly fewer animals in and had to drastically cut back on programming due to COVID-19. Therefore, I used 2019 data to conduct the bulk of my analyses. However, I supplemented the 2019 analysis with a high level review of 1) 2020 data over the first three months of the pandemic and 2) full 2020 data.
No Kill Shelters Used in Analysis
I used the following no kill shelters in the analysis. These shelters are ones I’ve either previously examined or have stellar reputations. In addition, I chose large facilities (i.e. all shelters took in more than 5,000 dogs and cats during 2019) to ensure the analysis focused on those organizations with significant challenges.
- Austin Animal Center – Austin and Travis County, Texas: The City of Austin spearheaded the no kill movement over the last decade. After long advocacy efforts and programming created by Austin Pets Alive, Austin Animal Center, the animal control shelter, first exceeded a 90% live release rate in 2012. Subsequently, the shelter significantly improved and I detailed the shelter’s statistics in both 2017 and 2018 here and here. Since Austin Pets Alive, which pulls large numbers of Austin Animal Center’s most challenging animals, plays such a critical role in saving Austin’s no kill effort, I also incorporated Austin Pets Alive in the analysis. Austin Pets Alive is a major force through its American Pets Alive brand (e.g. its annual American Pets Alive Conference) in spreading the no kill message across the country. While not as prominent as Austin Pets Alive, Austin Animal Center also frequently spoke at the American Pets Alive Conference and shared its successes through blogs, webinars, etc.
- Pima Animal Care Center – Tucson and Pima County, Arizona: Austin Animal Center’s former Deputy Chief Animal Services Officer, Kristen Hassen-Auerbach, became the leader of Pima Animal Care Center in July 2017 and ran the facility until October 2020. Prior to taking the shelter over, Pima Animal Care Center reported live release rates of 84% for dogs and 88% for cats. Ms. Hassen-Auerbach had a reputation for developing innovative programs at Austin Animal Center as well as at Fairfax County Animal Shelter in Virginia. During Ms. Hassen-Auerbach’s tenure at Pima Animal Care Center, she created many exciting programs. Additionally, Ms. Hassen-Auerbach became one of the most vocal people in the no kill movement through her prominent role at the American Pets Alive Conference and her numerous blogs and webinars.
- KC Pet Project – Kansas City, Missouri: KC Pet Project formed in 2011 and took over the the city shelter within a few months on January 1, 2012. After several months, KC Pet Project stated it reached a 90% live release rate. Subsequently, KC Pet Project has been a prominent voice at the American Pets Alive Conference and various other venues.
- Williamson County Animal Shelter – Williamson County, Texas: Williamson County Animal Shelter serves most of Williamson County, Texas, which is very close to Austin. The shelter reached a dog and cat combined 90% live release rate in 2013. The shelter was led by Cheryl Schneider as it improved until she retired in Spring 2020. While Ms. Schneider spoke at conferences, such as the American Pets Alive Conference, she did not appear as prominently as some of the directors of the previously mentioned shelters.
- Lake County Animal Shelter – Lake County, Florida: Lake County Animal Shelter implemented no kill policies on January 15, 2017 after a long shelter reform effort and bringing in No Kill Learning to create policies and programming. After around six months, the shelter hired Whitney Boylston as the director and she has run the shelter and developed programming since then. You can read my two blog’s on the shelter’s 2019 statistics here and how the shelter achieved its success here. Unlike the other shelters, national organizations have largely not publicized Lake County Animal Shelter as a no kill success story.
Some Shelters Face Tougher Challenges
Before we compare the shelters’ performances, we must examine the difficulties of their missions. If a shelter takes few animals in, receives lots of rescue assistance and is well-funded, it will have an easier job. Therefore, we will compare various metrics measuring these factors.
KC Pet Project Faced the Greatest Animal Volume Challenge
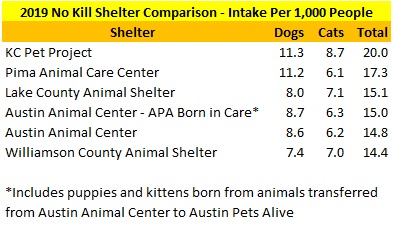
The following table lists the numbers of dogs and cats each shelter took in during 2019. As you can see, Austin Animal Center and Pima Animal Care Center impounded the most animals followed by KC Pet Project, Williamson County Animal Shelter and Lake County Animal Shelter.

While the total dogs and cats received is important, per capita intake is a better measure of a shelter’s animal volume challenge. Since this metric shows how many people can potentially reclaim, adopt and rescue a shelter’s animals, it is a better indicator of the difficulty a facility faces with animal intake. For example, a shelter with higher per capita intake may have a harder time finding enough people to adopt and rescue all their healthy and treatable animals.
The following table lists the per capita intake for each shelter in 2019. KC Pet Project had the highest per capita intake followed by Pima Animal Care Center, Lake County Animal Shelter, Austin Animal Center and Williamson County Animal Shelter. As I mentioned in my prior blog on Lake County Animal Shelter, the facility’s per capita intake might be slightly higher due to me excluding all cats brought to the shelter for sterilization services (some may have been shelter-neuter-return that should be included in intake).
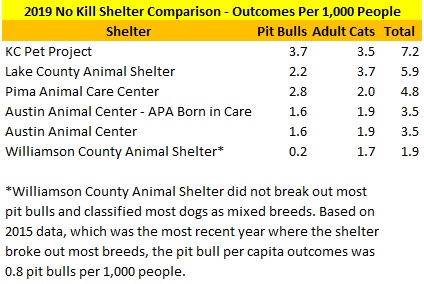
When we look at the most challenging animals for shelters to save, pit bulls and adult cats (i.e. 1+ year old cats), the results change a bit. Since I only had a breakdown of these categories by outcomes, I measured the per capita data this way (total outcomes and intakes are very similar). KC Pet Project impounded the greatest numbers of these animals, as well as pit bulls, on a per capita basis. Lake County Animal Shelter took the second most of these animals in and the most adult cats on a per capita basis.
Shelter capacity also plays a key challenge to facilities trying to become no kill. If a shelter does not have enough space, it may not have enough time to find adopters and rescues to save their homeless pets.
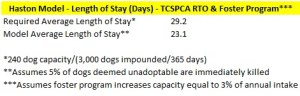
The following tables measure each shelter’s required average length of stay that is necessary for a shelter to avoid overcrowding (i.e. shelters must generate outcomes or put animals into foster homes within these time frames on average). Based on formulas you can find here, we can estimate the average length of stay a shelter must maintain to avoid overcrowding on a regular basis. To do this correctly, we would calculate this metric for both dogs and cats. Unfortunately, some shelters did not disclose separate dog and cat capacity. However, we can still get a sense of the shelter’s capacity resources by looking at the combined dog and cat required average length of stay. As you can see, all the shelters have to get animals out of their shelters quickly. Austin Animal Center (after incorporating a portion of Austin Pets Alive’s shelter capacity) had the shortest time to get animals out followed by KC Pet Project, Williamson County Animal Shelter, Pima Animal Care Center and Lake County Animal Shelter. While Austin Animal Center had the least amount of time to get animals out alive, its likely Austin Pets Alive would use more of its capacity (i.e. which would increase the required average length of stay) in the event Austin Animal Center faced a space crisis.

Lake County Animal Shelter Had The Worst Physical Facility
The physical facility’s condition also impacts lifesaving. For example, poorly designed buildings make it easy to spread disease and also stress animals out leading to behavioral problems.
The following table summarizes my assessments of each physical shelter’s condition in 2019 and 2020 and details when these facilities were built and renovated/expanded. As No Kill Learning noted in its March 2017 progress report on Lake County Animal Shelter, the physical shelter presents significant issues relating to disease management and animal behavior. Therefore, I classified this shelter as being in very poor condition. KC Pet Project also had a very poor physical facility in 2019, but I classified it as poor rather than very poor due to it having more physical space based on my personal visits. In 2020, Kansas City built a state of the art shelter in a desirable location. Both Williamson County Animal Shelter and Austin Animal Center were built within the last 10-15 years and had recent expansions. Based on Austin Animal Center having more modern kennels throughout its entire facility, I classified its condition as very good and Williamson County Animal Shelter as good. Finally, Pima Animal Care Center moved into a brand new state of the art facility at the end of 2017 and it therefore had the best physical shelter in 2019.

Lake County Animal Shelter Faced the Greatest Financial Challenge
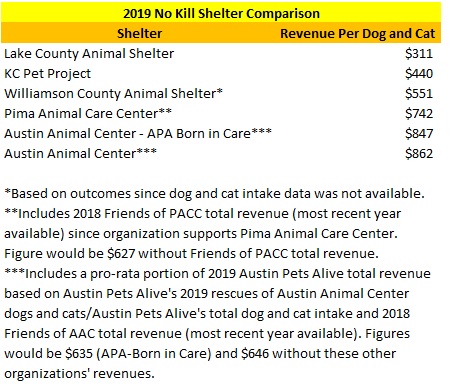
The shelters had significantly different levels of funding. As the table describes, I added supporting organizations’ revenues to Pima Animal Care Center’s and Austin Animal Center’s revenues (the rankings would be unchanged without me adding these revenues). Overall, Lake County Animal Shelter had the least funding followed by KC Pet Project. Both Austin Animal Center and Pima Animal Care had much more funding than the other shelters.
Austin Animal Center Receives Massive Rescue Support
Rescues can make an animal control shelter’s job much easier. If rescues take many of the shelter’s pets, the shelter has to do little work. While working with rescues is part of the No Kill Equation, no kill shelters that rely heavily on rescues can divert lifesaving from more needy shelters. Furthermore, no kill shelters relying heavily on transferring animals can regress to killing if rescues stop pulling many pets.
Austin Animal Center received far more rescue assistance than the other shelters. Overall, Austin Animal Center received two to six times more rescue assistance than the other facilities. Not only did Austin Animal Center receive lots of rescue help, Austin Pets Alive pulled many of the shelter’s most challenging animals. Even without Austin Pets Alive, Austin Animal Center transferred 9% of its dogs (i.e. more than all other shelters except Pima Animal Care Center) and 16% of its cats to other organizations (more than all the other facilities). Thus, Austin Animal Center received an unusually large amount of rescue assistance.
KC Pet Project, Williamson County Animal Shelter and Lake County Animal Shelter received similarly low levels of rescue support. While Pima Animal Care Center did not get nearly as much rescue help as Austin Animal Center, it still transferred two to three times more dogs and cats as the other three shelters.
When we look at just pit bulls and adult cats, KC Pet Project and Williamson County Animal Shelter received the least rescue support. Lake County Animal Shelter and Pima Animal Care Center transferred a slightly higher percentage of these animals, but it still was pretty low. Austin Animal Center transferred an even larger percentage of these difficult animals than it did for all dogs and cats (four to nine times the other shelters’ percentages).
Death Rates Reveal Some Shelters Value Life More Than Others
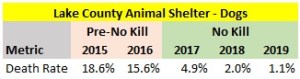
Most people consider a shelter no kill when the facility achieves a specific live release rate. The live release rate is the percentage live outcomes make up of total outcomes in a period. Personally, I prefer the inverse of that, the death rate, which is the percentage non-live outcomes comprise of total outcomes since it focuses on the animals still dying. Generally, most people consider a 90% live release rate (10% death rate) no kill under the assumption that 10% of animals are hopelessly suffering or seriously aggressive dogs that won’t respond to rehabilitation. Personally, I believe a 95% dog live release rate (5% death rate) and 92% cat live release rate (8% death rate) is more appropriate, but I do think the cat figure is a bit more flexible given cats are more susceptible to arriving at shelters in worse condition than dogs (i.e. cats hit by cars, very young kittens that can die from illness).
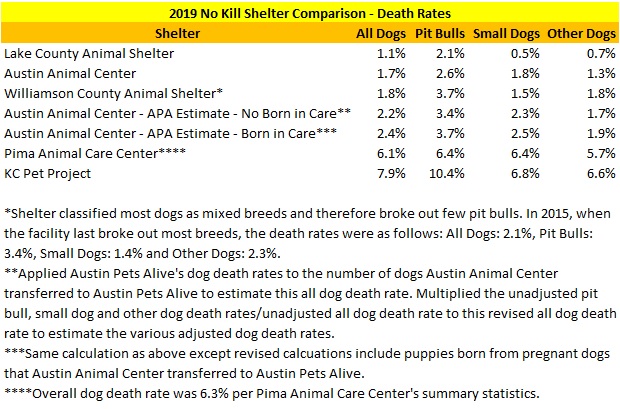
When calculating the shelters’ death rates, I decided to present alternative figures for both Williamson County Animal Shelter and Austin Animal Center. Unfortunately, Williamson County Animal Shelter did not break out breeds for most dogs in 2019. Therefore, I also presented the various dog death rates from 2015, when the shelter last broke out most dog breeds, since both the total dog intake and dog live release rate were similar to those in 2019. For Austin Animal Center, I included estimated dog death rates based on animals who potentially lost their lives at Austin Pets Alive as explained in the table below. Since Austin Animal Center transfers so many animals to Austin Pets Alive, its important to include these figures.
Overall, the shelters had significantly different dog death rates. As the table below shows, Lake County Animal Shelter had the lowest dog death rate for all types of dogs followed by Austin Animal Center, Williamson County Animal Shelter, Pima Animal Care Center and KC Pet Project. However, after we revise Austin Animal Center’s death rates for estimates of transferred dogs who lost their lives at Austin Pets Alive, Williamson County Animal Shelter and Austin Animal Center swap positions. Most notably, Pima Animal Care Center and KC Pet Project had much higher dog death rates than the other shelters. In fact, KC Pet Project’s pit bull death rate barely stayed within the lenient 10% no kill criteria.
The shelters’ nonreclaimed dog death rates followed the same pattern. Overall, Lake County Animal Shelter had the lowest nonreclaimed dog death rate for all types of dogs followed by Austin Animal Center, Williamson County Animal Shelter (the shelter’s 2015 pit bull nonreclaimed death rate of 4.6% is likely more reflective of the actual 2019 pit bull nonreclaimed death rate due to the small number of pit bulls broken out in 2019), Pima Animal Care Center and KC Pet Project. As mentioned above, Williamson County Animal Shelter and Austin Animal Center swap positions when I add an estimate of the number of Austin Animal Center dogs who lost their lives at Austin Pets Alive. Once again, Pima Animal Care Center and KC Pet Project had much higher nonreclaimed dog death rates than the other shelters.

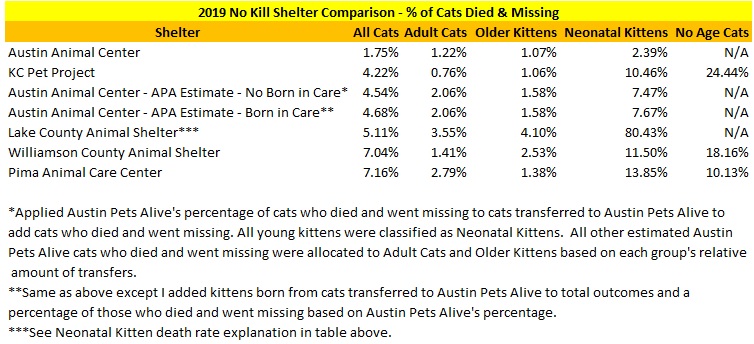
As the table below shows, the shelters had different cat death rates. Overall, Austin Animal Center reported the lowest cat death rate followed by KC Pet Project, Lake County Animal Shelter, Williamson County Animal Shelter and Pima Animal Care Center. Most notably, Pima Animal Care Center’s cat death rate significantly exceeded both my and the the general no kill death rate thresholds. Lake County Animal Shelter’s cat death rate may have been slightly lower since I excluded all cats brought to the shelter by the public under its Operation Caturday sterilization program. Based on my discussion with the shelter director, Whitney Boylston, people brought some of these cats in as strays, but the shelter convinced the individuals to allow the facility to do shelter-neuter-return (i.e. should be counted in statistics as live releases). While I don’t have any information on Williamson County Animal Shelter, its possible some of their feral cat sterilizations could have been similar and its cat death rate may have been a bit lower.
Some of the cat death rates by age group may not be accurate due to large numbers of cats having no age classification. For example, KC Pet Project, Williamson County Animal Shelter and Pima Animal Care Center had high death rates in the No Age category. If these cats were included in the applicable cat age groups’ death rate calculations, these death rates (especially neonatal kittens) would likely be much higher.
As the table below explains, Lake County Animal Shelter’s neonatal kitten death rate is unusually high due to the shelter’s Wait-til-8 program that resulted in the shelter taking in a small number of very young kittens in extremely poor condition. In addition, the shelter’s use of cat ages at the outcome dates may result in the neonatal kitten death rate calculation omitting some young kittens who had live releases when they were older.
Austin Pets Alive’s Bottle Baby Program helped save many young kittens (i.e. less than six weeks old) from Austin Animal Center. Under this program, Austin Pets Alive operates a kitten nursery that provides around the clock care to very young kittens. Prior to Austin Pets Alive creating this program in 2009, Austin Animal Center killed nearly all these animals. Thus, Austin Pets Alive significantly lowered Austin Animal Center’s neonatal kitten death rate.

The nonreclaimed cat death rates follow the same pattern except for Austin Animal Center. These death rate calculations exclude cats returned to owners and cats shelter-neutered-returned. Overall, these death rates are a bit higher than the normal cat death rates. Due to Austin Animal Center’s large shelter-neuter-return program, the organization’s nonreclaimed cat death rate is higher relative to its cat death rate compared to the other facilities. When looking at this metric, both KC Pet Project and Lake County Animal Shelter moved above Austin Animal Center (Austin Pets Alive adjusted).

Behavior Killing Data Reveals Some Shelters Value Life More Than Others
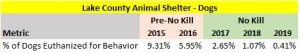
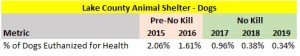
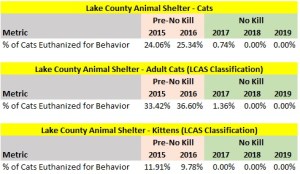
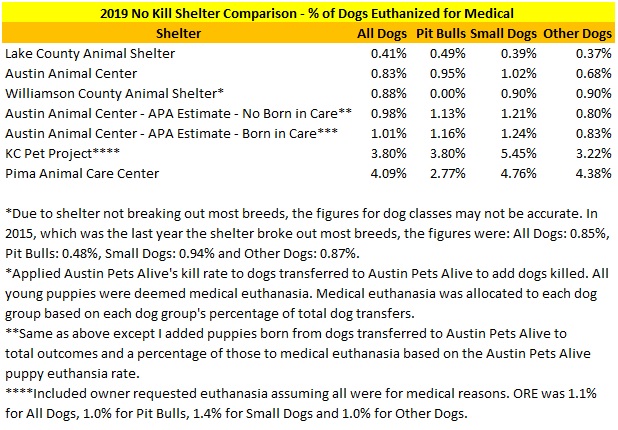
To better understand how strongly each shelter respects life, I computed the percentage of dogs and cats each shelter euthanized for behavior and medical reasons in the tables below.
Overall, Austin Animal Center euthanized the fewest dogs for behavior followed by Lake County Animal Shelter, Williamson County Animal Shelter, Pima Animal Care Center and KC Pet Project. KC Pet Project’s behavior euthanasia/killing figures were significantly higher than the other shelters. When we just look at pit bulls, Lake County Animal Shelter swaps positions with Austin Animal Center adjusted for Austin Pets Alive. Austin Animal Center, Lake County Animal Shelter and Williamson County Animal Shelter killed no small dogs for behavior while Pima Animal Care Center and KC Pet Project killed a small percentage of these dogs for behavior.
The shelters’ pit bull results reveal a large divide among the shelters. Both Lake County Animal Shelter and the Austin Animal Center (adjusted for Austin Pets Alive) euthanized around 0.90% of their pit bulls for behavior while Williamson County Animal Shelter (2015 figure – see table for explanation), Pima Animal Care Center and KC Pet Project killed/euthanized 1.93%, 2.11% and 4.87% of pit bulls for behavior. Clearly, this data indicates these three shelters did not have the same respect for pit bull lives as Lake County Animal Shelter and Austin Animal Center.
Williamson County Animal Shelter’s, Pima Animal Care Center’s and KC Pet Project’s detailed reasons for euthanizing/killing dogs revealed these shelters didn’t always have the highest levels of respect for life. While Williamson County Animal Shelter generally had good respect for life, it did kill two dogs for dog aggression which I believe is manageable. Similarly, Pima Animal Care Center killed nine dogs for animal aggression. KC Pet Project killed 19 dogs for animal aggression (17 were pit bulls), four dogs for extreme anxiety (three were pit bulls), five dogs for extreme arousal (four were pit bulls) and one dog for extreme resource guarding. Thus, these shelters, and KC Pet Project in particular, did not always uphold the most fundamental no kill principle of respecting life.

Lake County Animal Shelter euthanized the fewest dogs for medical reasons followed by Williamson County Animal Shelter, Austin Animal Center (adjusted for Austin Pets Alive), KC Pet Project and Pima Animal Care Center. Most notably, KC Pet Project and Pima Animal Care Center euthanized a much greater percentage of dogs for medical reasons than the other shelters.
On a very positive note, all five shelters did not kill a single cat for behavior. Given shelters should never kill cats for behavior since such animals are not a serious threat to people and lifesaving alternatives exist (i.e. TNR, shelter-neuter-return, barn and warehouse cat adoptions, etc.), this is an excellent result.
Austin Animal Center euthanized the fewest cats for medical reasons followed by Williamson County Animal Shelter, Lake County Animal Shelter, KC Pet Project and Pima Animal Care Center. However, when we look at the Austin Animal Center numbers adjusted for estimated Austin Pets Alive euthanasia, Austin Animal Center drops to fourth place. Overall, the top three shelters were very close with Austin Animal Center (adjusted for Austin Pets Alive) and Pima Animal Care Center in particular being further behind.
When looking at the cat age groups, we must consider two other things. The shelters with cats having no age would have had higher medical euthanasia rates if these organizations reported ages for these cats. As mentioned above, Lake County Animal Shelter’s neonatal kitten death rate is high due to the shelter’s Wait-til-8 program that resulted in the facility taking very few young kittens in who were likely in very bad shape. Therefore, this shelter’s percentage of neonatal kittens euthanized for medical reasons is abnormally high.

When we look at the percentage of cats who died and went missing, Austin Animal Center had the lowest figure followed by KC Pet Project, Lake County Animal Shelter, Williamson County Animal Shelter and Pima Animal Care Center. However, KC Pet Project switches positions with Austin Animal Center when we include the estimated number of Austin Animal Center cats who died at Austin Pets Alive. Overall, KC Pet Project, Austin Animal Center and Lake County Animal Shelter had similar results while both Williamson County Animal Shelter and Pima Animal Care Center had a much greater percentage of cats who died and went missing. As with the other metrics, KC Pet Project’s, Williamson County Animal Shelter’s and Pima Animal Care Center’s age class died and missing percentages would be higher if these facilities broke out the ages of all their cats.
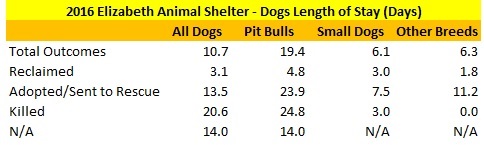
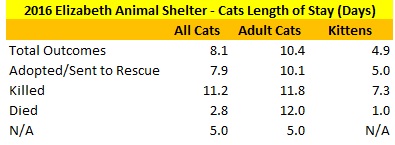
All the shelters except for Pima Animal Care Center took a good amount of time before euthanizing dogs. As the table below shows, the shelters other than Pima Animal Care Center on average euthanized dogs after one month. Pima Animal Care Center euthanized dogs after just five days on average. However, the shelter took a bit longer (20.7 days) to euthanize dogs for behavior than for medical reasons (2.1 days). While Pima Animal Care Center did euthanize many very old dogs for medical reasons, it did euthanize a significant number of younger dogs for health reasons as well (average age of dogs euthanized for medical reasons was 9.0 years). Thus, the length of stay data indicates all the shelters except for Pima Animal Care Center made a strong effort to save their euthanized dogs.

The euthanized cats average length of stay data show the same pattern. Since the shelters euthanized all the cats for medical reasons, the average lengths of stay are a bit lower than those for dogs. However, Pima Animal Care Center stood out again for euthanizing cats much quicker than the other shelters.

Austin Animal Center’s and Austin Pets Alive’s combined respect for life data must be interpreted with caution. Since Austin Pets Alive is not subject to the Texas Public Information Act and does not disclose intake and disposition records for individual animals, I had to estimate the number of animals who lost their lives at Austin Pets Alive and the number of those euthanized for medical and behavior reasons. Specifically, these estimates assumed 1) the percentage of Austin Animal Center animals who lost their lives at Austin Pets Alive was the same as the death rate for other animals Austin Pets Alive took in and 2) the allocation of euthanized animals to the underlying behavior and medical reasons was the same as those for animals euthanized at Austin Animal Center. While I don’t have objective data on the types of animals Austin Pets Alive took from places other than Austin Animal Center, I suspect Austin Pets Alive took more difficult behavior case dogs from Austin Animal Center than from elsewhere. In other words, the combined Austin Animal Center and Austin Pets Alive dog death rates and percentage of dogs euthanized for behavior reasons could be higher than the amounts I estimated.
To stress test my estimates, I recalculated the dog death rates and percentages of dogs euthanized for behavior and medical reasons using the overly conservative assumption that all 45 over five month old dogs Austin Pets Alive euthanized were Austin Animal Center dogs and Austin Pets Alive euthanized every single one of these animals for behavior reasons. This assumption changes my Austin Animal Center-APA Estimate – No Born in Care results as follows (the Born in Care results change by similar amounts):
- Death Rates: All Dogs: 2.2% to 2.5%, Pit Bulls: 3.4% to 3.8%, Small Dogs: 2.3% to 2.6% and Other Dogs: 1.7% to 1.9%
- Percentage of Dogs Euthanized for Behavior: All Dogs: 0.28% to 0.65%, Pit Bulls: 0.92% to 2.14%, Small Dogs: Remains at 0% and Other Dogs: 0.22% to 0.51%
- Percentage of Dogs Euthanized for Medical Reasons: All Dogs: 0.98% to 0.83%, Pit Bulls: 1.13% to 0.95%, Small Dogs: 1.21% to 1.02% and Other Dogs: 0.80% to 0.68%
Based on these overly conservative assumptions, Austin Animal Center-Austin Pets Alive would remain in third place for all dog death rates, drop from first to third place for the percentage of all dogs euthanized for behavior reasons and rise from third to second place for the percentage of all dogs euthanized for medical reasons. In reality, the actual figures are probably somewhere between the estimates above.
I strongly recommend Austin Pets Alive disclose their full intake and disposition records for each individual animal to allow the public to determine the exact death rates of Austin Animal Center animals and percentages of Austin Animal Center dogs and cats euthanized for behavior and medical reasons at the two shelters.
Lake County Animal Shelter’s Owner Surrender Policy Does Not Affect Results
Before we conclude this blog’s section on respect for life, we must determine whether Lake County Animal Shelter’s owner surrender policies made its figures look much better. Lake County Animal Shelter conducts an “adoptability assessment” before accepting owner surrenders. Based on my conversation with shelter director, Whitney Boylston, the only animals it won’t accept are the most severe medical and dog behavior cases where euthanasia is the only option. In other words, the shelter does not conduct owner requested euthanasia.
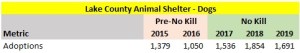
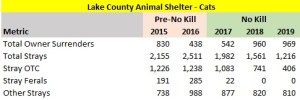
Lake County Animal Shelter’s intake data backs up the assertion that it does not accept very few animals. Overall, the shelter’s dog intake is similar to what it was before the facility went no kill. While owner surrenders in 2019 were a little lower than they were before the shelter went no kill, this could be due to data collection issues the facility had before it went no kill. Even so, the shelter had more owner surrenders in 2018 (when the shelter had a dog death rate of 2.0% compared to 1.1% in 2019) than it did in 2016 (when it was high kill). On the cat side, Lake County Animal Shelter had significantly more owner surrenders in 2019 than it did in both 2016 and 2015 when it was a high kill facility. While total cat intake was a little lower after the shelter went no kill, this was due to the shelter’s Operation Caturday TNR program that neutered and released cats rather than impounding them. Thus, Lake County Animal Shelter’s intake data indicates the shelter’s owner surrender policies were not artificially decreasing the facility’s death rate.
To evaluate whether Lake County Animal Shelter’s owner requested euthanasia policy impacted the results, I looked at owner requested euthanasia numbers at the other organizations. Unfortunately, KC Pet Project was the only shelter that broke this data out. KC Pet Project only euthanized 1.1% of its dogs and 0.1% of its cats for owner requested euthanasia. Clearly, this was not significant since 1) the 1.1% dog figure did not come close to making up the 6.8% dog death rate difference between KC Pet Project and Lake County Animal Shelter and 2) the cat owner requested euthanasia figure was tiny.
In order to evaluate whether Lake County Animal Shelter’s owner requested euthanasia policy altered the comparative results with the other organizations, I examined dog and cat death rates excluding owner surrendered animals. Since all the shelters take the most difficult stray animals and dangerous dog cases, we can compare each facility’s respect for life on an apples to apples basis.
The shelters’ comparative dog death rate results did not change after excluding owner surrenders. As you can see in the table below, the shelters’ dog death rate rankings excluding owner surrenders are exactly the same as the overall dog death rate rankings. In fact, all the shelters except for Pima Animal Care Center and KC Pet Project had dog death rates excluding owner surrenders within 0.2% of their overall dog death rates. While these two shelters had lower dog death rates when excluding owner surrenders, both facilities still remained firmly in the last two places.

The organizations’ comparative cat death rates results did not change after excluding owner surrenders. Overall, all the shelters ranked the same as they did using the overall cat death rates. All the shelters’ cat death rates excluding owner surrenders were between 0.5% to 1.5% higher than their overall cat death rates. Given many stray cats come into shelters in very poor condition (i.e. hit by cars, extremely young kittens, etc.), this is not surprising.
Lake County Animal Shelter’s cat death rates excluding owner surrenders may be artificially high. Since the facility counts young kittens finders bring to the shelter after the animals become a bit older than when originally found, this death rate is higher than it would be if these cats were considered strays (which the cats originally were). If we counted these cats as strays rather than owner surrenders, Lake County Animal Shelter’s cat death rate and cat nonreclaimed death rate excluding owner surrenders would be 9.3% and 11.9%.

2020 Data Confirms Respect for Life Results
2020 was the most unusual year in the history of animal sheltering due to COVID-19. As a result of fewer people losing pets and more restrictive shelter intake policies during the pandemic, facilities across the country took in significantly fewer animals. On the one hand, shelters had to deal with a greater percentage of more challenging animals as facilities continued to take in emergency case animals (i.e. dangerous dogs, severely sick and injured animals, etc.) and impounded fewer healthy and treatable animals. On the other hand, shelters had far more funding, space, time and human resources available for each individual animal. Thus, shelters operated in conditions that could result in either less or more lifesaving depending on the organizations’ commitments to respecting life.
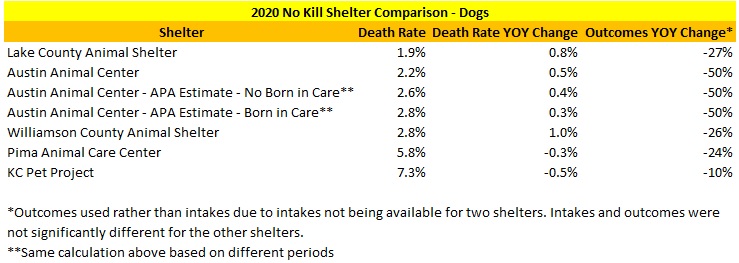
The shelters’ dog death rates in the three months after COVID-19 hit were remarkably similar to those from the same period in 2019. Overall, the death rate changes range from a 0.6% decrease at Lake County Animal Shelter to a 1.4% increase at Williamson County Animal Shelter. Also, the shelters ranked exactly the same in dog death rates as they did in 2019. Once again, both Pima Animal Care Center and KC Pet Project had remarkably higher dog death rates than the other shelters.
Overall, the decrease in dog intake was nearly exactly the same at all the shelters except for Austin Animal Center. Therefore, these shelters except for Austin Animal Center likely faced a similar change in the more challenging types of dogs each facility took in. Given Lake County Animal Shelter already had the lowest dog death rate, its decrease was very impressive and is another fact supporting this facility’s great respect for life. Additionally, Austin Animal Center’s much larger decrease in dog intake supports local advocates’ claims of the shelter not taking pets in who needed help during this time period in 2020.

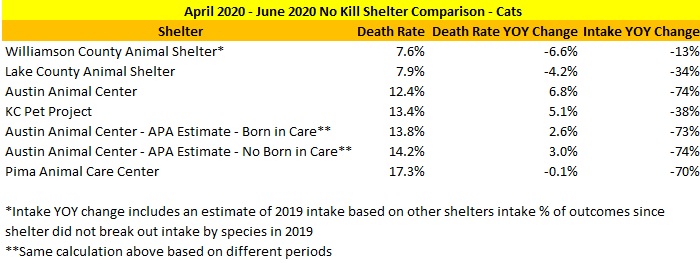
The shelters’ cat performances were vastly different over the three months after COVID-19 became prevalent in 2020. Both Williamson County Animal Shelter and Lake County Animal Shelter significantly lowered their cat death rates over the same period in 2019 and those death rates were at impressively low levels. While Williamson County Animal Shelter’s cat intake decreased by a much smaller percentage than the other shelters, Lake County Animal Shelter’s cat intake only decreased slightly less than KC Pet Project’s cat intake. Both Austin Animal Center and KC Pet Project had significantly higher cat death rates in April-June 2020 compared to April-June 2019. While Pima Animal Care Center’s cat death rate decreased slightly in April-June 2020 compared to April-June 2019, the overall cat death rate in April-June 2020 was shockingly high. In fact, all the shelters except for Williamson County Animal Shelter and Lake County Animal Shelter had high cat death rates in April-June 2020 despite these organizations having very good or state of the art facilities.
The full year 2020 dog death rates showed the same pattern as the 2019 results and the April 2020-June 2020 results. Once again, Lake County Animal Shelter, Austin Animal Center and Williamson County Animal Shelter had much lower dog death rates than Pima Animal Care Center and KC Pet Project. Lake County Animal Shelter, Austin Animal Center and Williamson County Animal Shelter had slightly higher dog death rates compared to 2019 while Pima Animal Care Center’s and KC Pet Project’s dog death rates decreased slightly. However, these changes did not come close to making up the gap in dog death rates.
Overall, the shelters took fewer animals in compared to 2019, but the decrease was less than the decrease during the spring months. This matches the national animal sheltering data trends that show animal sheltering intake gradually normalizing as 2020 went on. However, Austin Animal Center also stood out again for its much larger decrease in dog intake and suggests advocates’ claims of the shelter leaving animals on the streets may have validity.
Overall, the full year 2020 cat death rates showed almost all the shelters achieved no kill for cats. Williamson County Animal Shelter had the lowest cat death rate followed by Lake County Animal Shelter, Austin Animal Center (adjusted for Austin Pets Alive), KC Pet Project and Pima Animal Care Center. Once again, Pima Animal Care Center failed to achieve no kill for cats and had a much higher cat death rate than the other shelters. Interestingly, all the shelters except for Austin Animal Center (unadjusted for Austin Pets Alive) had lower cat death rates in 2020.
All the shelters except KC Pet Project reported lower cat intake in 2020 compared to 2019. As with dogs, the intake reduction (as measured by total outcomes) was not as much during the full year as it was in the spring months after COVID-19 first hit. In fact, KC Pet Project’s cat intake changed so much that it took in more cats in 2020 than it did in 2019. On the other hand, Austin Animal Center and Pima Animal Care Center still had very large decreases in cat intake during the entire year. As mentioned above, Austin Animal Center’s questionable intake policies may have caused its 55% decrease in cat intake. While Pima Animal Care Center’s sharp drop in cat intake could be due to programs designed to keep animals out of the shelter (the shelter’s director led the implementation of the Humane Animal Support Services shelter operating model in 2020), its possible the shelter may have been more strict in following the National Animal Care and Control guidelines to only take animals in on an emergency basis during the pandemic (the shelter’s director was on the board of this organization before she left Pima Animal Care Center).

Lake County Animal Shelter Excels at Returning Dogs to Owners
The primary purpose of shelters is to return lost pets home. If an animal has an owner, that animal should go to its family rather than to a new place. Due to a variety of reasons, shelters generally only have success returning lost dogs to owners. In other words, almost all shelters have difficulty reuniting stray cats with their families.
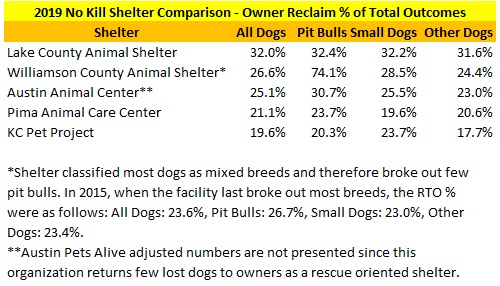
Lake County Animal Shelter returned the greatest percentage of its dogs to owners in 2019 followed by Williamson County Animal Shelter, Austin Animal Center, Pima Animal Care Center and KC Pet Project. With the exception of the likely inaccurate 2019 pit bull results from Williamson County Animal Shelter, Lake County Animal Shelter led all the shelters for each dog grouping.
The 2020 total dog results followed the same pattern. In fact, Lake County Animal Shelter outperformed the other shelters by an even greater margin in 2020 than in 2019.

Since the owner reclaims percentage of all dog outcomes might not accurately represent the true percentage of lost dogs shelters return to owners, I also calculated the percentage of stray dogs returned to owners during 2019. Once again, Lake County Animal Shelter returned the greatest percentage of dogs to owners. When looking at this metric, Pima County Animal Care Center jumped from fourth to second place while the other shelters followed the same order as the owner reclaim percentage of total dog outcomes.

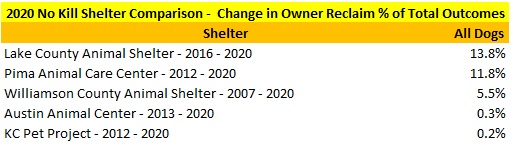
While socioeconomic factors drive differences in return to owner rates between shelters, this typically applies to regressive shelters that take a passive approach to returning lost pets to their families (i.e. primarily rely on licenses and microchips rather than doing proactive work). In fact, Lake County Animal Shelter increased the percentage of dogs it returned to owners by a greater amount from 2016 to 2020 than any of the other shelters did over much longer periods of time (periods selected based on first year before no kill effort started, or if not available, the oldest year accessible after the no kill effort started). As I mentioned in a prior blog on Lake County Animal Shelter, the facility achieved this success by doing good old fashioned hard work and using technological solutions.
Shelter-Neuter Return Programs Differ
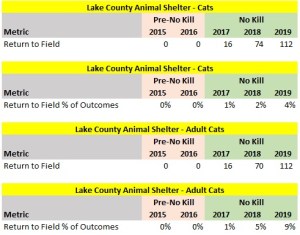
Austin Animal Center returned the greatest percentage of its community cats to their outdoor homes followed by Pima Animal Care Center, Lake County Animal Shelter and Williamson County Animal Shelter and KC Pet Project. KC Pet Project could not conduct shelter-neuter return due to ordinance restrictions, but the organization is trying to change the statute.

The three shelters conducting shelter-neuter-return had different policies for including young kittens. Under Austin Animal Center’s shelter-neuter-return program, the shelter transfers community cats “who are in good health, older than three months and weigh no less than three pounds” to Austin Humane Society to do the veterinary procedures. However, critics argue Austin Animal Center shelter-neuter-returns too many young kittens (i.e. under six months), which may have higher mortality rates on the streets. In fact, 204 or 20% of the 1,022 community cats Austin Animal Center returned to field in 2019 were two to five months old. Similarly, 15% of Pima Animal Care Center’s shelter-neuter-return cats in 2019 were between one to five months old (almost all were three to five months old). In contrast, Lake County Animal Shelter only shelter-neuter-returned cats that were six months of age and older.
Several shelters conducted significant numbers of cat sterilizations through TNR programs that are not included in the above statistics. If we count these cats, Lake County Animal Shelter and Williamson County Animal Shelter would have returned 22% and 11% of their cats sterilized to their communities. Unfortunately, Pima Animal Care Center did not break out the TNR and owned cat portions of its cat sterilizations at its vet clinics. If we counted all these cat sterilizations, Pima Animal Care Center would have returned 41% of their cats sterilized to their communities. However, this would clearly overstate Pima Animal Care Center community cat sterilizations.
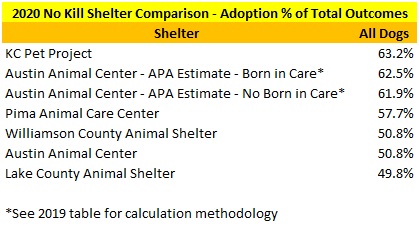
KC Pet Project’s Adoption Results Stand Out
The following table lists each shelter’s dog adoption rates. KC Pet Project had the highest dog adoption rate followed by Austin Animal Center (adjusted for the estimated number of Austin Pets Alive’s adoptions of transferred dogs), Williamson County Animal Shelter, Pima Animal Care Center and Lake County Animal Shelter. Austin Animal Center was dead last due to its heavy reliance on Austin Pets Alive to adopt out its dogs.
Pima Animal Care Center had the highest pit bull adoption rate followed by KC Pet Project, Lake County Animal Shelter, Austin Animal Center (adjusted for Austin Pets Alive and puppies born from transferred dogs), Austin Animal Center (adjusted for Austin Pets Alive) and unadjusted Austin Animal Center. As the table discusses, Williamson County Animal Shelter’s pit bull adoption rate is unreliable, but it was quite high in the most recent year the shelter broke out most breeds.

The 2020 dog adoption rates showed slightly different results. Overall, KC Pet Project had the highest dog adoption rate followed by Austin Animal Center (adjusted for Austin Pets Alive and puppies born from transferred dogs), Austin Animal Center (adjusted for Austin Pets Alive), Pima Animal Care Center, Williamson County Animal Shelter, unadjusted Austin Animal Center and Lake County Animal Shelter.
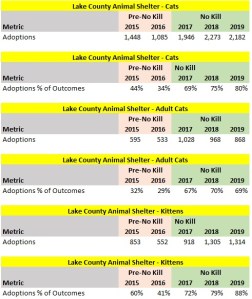
KC Pet Project had the highest cat adoption rate in 2019 followed by Williamson County Animal Shelter, Lake County Animal Shelter, Austin Animal Center (adjusted for estimated Austin Pets Alive adoptions of Austin Animal Center cats), Pima Animal Care Center and Austin Animal Center (unadjusted). Both Pima Animal Care Center and Austin Animal Center had significantly lower cat adoption rates. In the case of Pima Animal Care Center, this was largely due to its higher transfer percentage and death rate. For Austin Animal Center, this was due to its very high transfer percentage and large percentage of cats shelter-neutered-returned.

The 2020 cat adoption rates followed the same pattern. Specifically, the cat adoption rates rankings were exactly the same as in 2019.

To better assess the scale of the shelters’ adoption programs, we need to look at how many animals the facilities adopt out relative to the human populations in their service areas. For example, a shelter may have adoptions make up a large percentage of total outcomes, but adopt few animals out.
KC Pet Project had the highest per capita dog adoption rate in 2019 followed by Pima Animal Care Center, Austin Animal Center (adjusted for estimated Austin Pets Alive adoptions of Austin Animal Center dogs), Williamson County Animal Shelter, Lake County Animal Shelter and Austin Animal Center (unadjusted). When we just look at pit bulls, Lake County Animal Shelter jumped to third place and Williamson County Animal Shelter fell to last place. Most notably, KC Pet Project achieved the highest pit bull per capita adoption rate I’ve ever seen.

In 2020, the results were similar with a few changes. First, all of the shelters adopted out fewer dogs due to COVID-19 reducing intake. Second, Lake County Animal Shelter jumped up to third place. Third, Williamson County Animal Shelter moved ahead of Austin Animal Center (adjusted for transferred dogs to Austin Pets Alive).

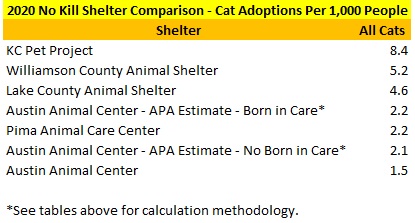
KC Pet Project had the highest per capita cat adoption rate in 2019 followed by Lake County Animal Shelter, Williamson County Animal Shelter, Austin Animal Center (adjusted for estimated Austin Pets Alive adoptions of Austin Animal Center cats), Pima Animal Care Center, and Austin Animal Center (unadjusted). Once again, Austin Animal Center itself had a much lower per capita adoption rate than the other organizations. When we look at just adult cats, both KC Pet Project and Lake County Animal Shelter adopted out far more of these animals than the other shelters.
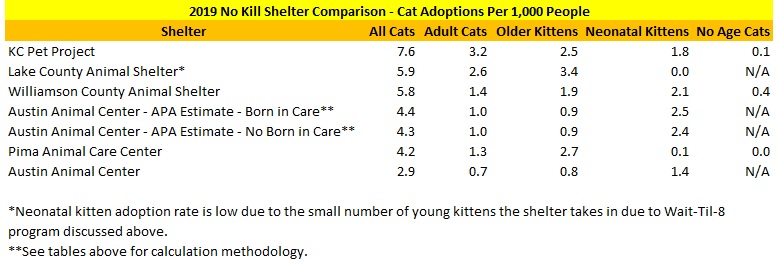
In 2020, KC Pet Project had the highest per capita cat adoption rate followed by Williamson County Animal Shelter Lake County Animal Shelter, Austin Animal Center (adjusted for estimated Austin Pets Alive adoptions of Austin Animal Center cats and kittens born from those cats), Pima Animal Care Center, Austin Animal Center (adjusted for estimated Austin Pets Alive adoptions of Austin Animal Center cats) and Austin Animal Center (unadjusted). KC Pet Project increased its per capita cat adoptions in 2020 while all the other shelters had lower cat adoptions per 1,000 people figures. Notably, Pima Animal Care Center and Austin Animal Center had much lower per capita cat adoptions than the other shelters in 2020.
When looking at per capita adoption rates, one must also consider several factors. First, shelters with higher animal intake will be able to adopt out more pets, and especially easier to adopt ones. Second, shelters that return fewer animals to owners and shelter-neuter return less cats will have more animals to adopt out. Thus, these factors partially helped increase KC Pet Project’s per capita adoption rates for dogs and cats and Pima Animal Care Center’s per capita dog adoption rate.
As mentioned in my discussion about respect for life, Austin Animal Center’s results may appear better than they really are. Since I used Austin Pets Alive’s overall adoption rates in the tables above, it could overstate the Austin Animal Center-Austin Pets Alive adoption rates if Austin Pets Alive adopted out a greater percentage of animals obtained from places other than Austin Animal Center. Based on Austin Pets Alive’s overall dog death rates only changing a few tenths of a percent using overly conservative assumptions, this would not have large impact on the dog adoption rates. Additionally, I have no data to suggest Austin Pets Alive’s cat adoption rates are radically different for Austin Animal Center cats and cats taken in from elsewhere.
Pima Animal Care Center Moves Animals Out of the Shelter Quickly
Reducing the time animals spend in shelters is crucial to achieving no kill. When animals stay at shelters longer, the animals are more likely to get sick or develop behavior problems. Furthermore, shelters where animals stay too long cost more to run, have frequent serious disease outbreaks and become overcrowded. Simply put, an animal control shelter must have a short average length of stay to achieve and sustain no kill.
Pima Animal Care Center had the shortest average length of stay for dogs followed by Austin Animal Center, Lake County Animal Shelter, KC Pet Project and Williamson County Animal Shelter (see explanation in table for data issues). Impressively, Pima Animal Care Center’s average length of stay was less than half that of the second place shelter. Overall, all the shelters had short average lengths of stay for dogs with the possible exception of Williamson County Animal Shelter.
When we just look at pit bulls, the results change a bit. While Pima Animal Care Center still had the shortest average length of stay, the margin between it and the other facilities was smaller. Also, KC Pet Project had the second shortest average length of stay for pit bulls.

Pima Animal Care Center also had the shortest average length of stay for cats followed by Austin Animal Center, Lake County Animal Shelter, KC Pet Project and Williamson County Animal Shelter (see explanation in table for data issues). Pima Animal Care Center’s average length of stay was around one third that of the second place shelter. All the shelters had short average lengths of stay for cats with the possible exception of Williamson County Animal Shelter.

Since the overall average length of stay can be lower due to killing animals quickly, transferring many animals, returning many animals to owners and shelter-neuter-returning large numbers of cats, its helpful to look at the adoption average length of stay. In other words, this measures the average time it took to adopt animals out.
Pima Animal Care Center had the shortest adoption average length of stay for dogs followed by KC Pet Project, Austin Animal Center, Lake County Animal Shelter and Williamson County Animal Shelter (see explanation in table for data issues). Pima Animal Care Center’s adoption average length of stay was less than half that of the second place shelter. With the possible exception of Williamson County Animal Shelter, all the other shelters had short adoption average lengths of stay.
When we just look at pit bulls, the results change a bit. While Pima Animal Care Center still had the shortest adoption average length of stay, the difference between it and KC Pet Project was smaller. Interestingly, Austin Animal Center’s pit bull adoption average length of stay was much higher than the other shelters. When coupled with its low per capita pit bull adoption rate, this suggests Austin Animal Center needs to do a better job adopting out its pit bulls. As previously mentioned, Williamson County Animal Shelter’s pit bull adoption average length of stay is likely not accurate due to the shelter labeling very few dogs as pit bulls (i.e. data is only for 16 adoptions).

Pima Animal Care Center also had the shortest adoption average length of stay for cats followed by Lake County Animal Shelter, KC Pet Project, Austin Animal Center and Williamson County Animal Shelter (see explanation in table for data issues). Pima Animal Care Center’s cat adoption average length of stay was less than one third of the second place shelter’s figure. All the shelters had short adoption average lengths of stay for cats with the possible exception of Williamson County Animal Shelter. Austin Animal Center’s difference between its cat adoption average length of stay and its overall cat average length of stay was much larger than the other shelters. This is due to Austin Animal Center’s heavy reliance on both Austin Humane Society, for shelter-neuter return, and Austin Pets Alive, for cat rescues.

Finally, when examining the average length of stay figures, readers should consider differences in death rates. Specifically, shelters with lower death rates will have a more challenging mix of animals to save. Thus, all else being equal, these shelters would have longer overall and adoption average lengths of stay.
Final Rankings
5. Pima Animal Care Center
Pima Animal Care Center’s live release programs yielded some impressive results. In 2019, the shelter had the second highest stray dog reclaim rate and shelter-neuter return percentage of total cat outcomes. Additionally, in both 2019 and 2020, Pima Animal Care Center achieved the second highest per capita dog adoption rate. Also, the shelter had the second highest pit bull per capita adoption rate in 2019. Finally, Pima Animal Care Center had the shortest overall and adoption lengths of stay for dogs and cats, as well as for pit bulls and adult cats, by very wide margins. Thus, Pima Animal Care’s had some excellent live release programs.
While Pima Animal Care Center performed impressively for the most part in its live release programs, its cat adoption program fell short. In both 2019 and 2020, the shelter had the second lowest cat adoption percentage of total cat outcomes and per capita cat adoption rate. Additionally, the top ranking shelters outperformed Pima Animal Care Center by wide margins in these metrics.
Pima Animal Care Center’s shelter-neuter-return program sent a significant number of relatively young kittens back to their outdoor homes. Specifically, 15% of these cats were five months or younger (almost all were between three and five months). While some cat experts believe shelters should return such animals to field if healthy, I’m not comfortable doing so given these animals could be more susceptible to outdoor deaths and are easy to adopt out if they are not truly feral. Personally, I think organizations should hold off on shelter-neuter-returning young cats until large scale studies prove animals of this age are at low risk of death on the streets.
The shelter had the second largest decrease in cat intake in the three months after COVID-19 hit and for all of 2020 compared to the prior year periods. While we don’t know whether this was due to good intake reduction programs relating to the shelter’s implementation of the Humane Animal Support Services model of sheltering or simply refusing to take animals in who needed help, the reduction in dog intake was similar to most of the other shelters. Therefore, this suggests the shelter may have took fewer cats in due to its intake policies rather than surrender prevention and other programs to responsibly reduce animal intake.
Despite Pima Animal Care Center having several impressive live release programs, the shelter failed to achieve no kill for both dogs and cats based on my standards. The organization’s 6% dog death rate in both 2019 and 2020, which was the second worst of all the shelters, fell below my and many other no kill advocates 5% benchmark for no kill. In the three months after the COVID-19 pandemic began in the Spring of 2020, the dog death rate rose to 8%. When it came to cats, Pima Animal Care Center failed to even achieve the more lenient generally accepted standard of no kill (i.e. 10% death rate or less). The shelter had cat death rates of 12% in 2019, 17% in the three months after COVID-19 hit in Spring 2020 and 11% in 2020. As a result, Pima Animal Care Center is still a kill shelter.
Pima Animal Care Center was a mixed bag when it came to animals with behavioral issues. The shelter did not kill any cats for behavior/aggression problems since such animals are not a serious threat to people and lifesaving alternatives exist. On the other hand, Pima Animal Care Center killed the second highest percentage of dogs for behavior/aggression in 2019. Even worse, the shelter killed around two and half times the percentage of pit bulls for behavior as the top ranked shelter in 2019. While the overall dog behavior euthanasia percentage was not that much higher than the other shelters in 2019 and the 2020 percentage was similar to the other shelters’ 2019 percentages, Pima Animal Care Center still killed three small dogs for behavior/aggression in 2019 and killed a number of dogs for animal aggression in both years. Furthermore, the shelter killed dogs for behavior reasons quicker than the other facilities (21 days on average) in 2019 that suggests it did not commit as much of an effort as it could to these animals. Thus, Pima Animal Care Center still killed some dogs with manageable behavior problems.
Pima Animal Care Center killed too many dogs and cats for medical issues and allowed too many animals to die. Overall, Pima Animal Care Center had the highest percentages of both dogs and cats euthanized for medical reasons in 2019. Furthermore, the shelter had the highest percentage of cats who died or went missing. In a stunning video from the 2020 American Pets Alive Conference, Pima Animal Care Center’s Director of Veterinary Services admitted the shelter has no written protocols for dealing with animals who come in with serious medical problems and allows the veterinarians to make killing/euthanasia decisions in these cases without any oversight from the shelter director or a euthanasia committee. Even more surprising, the shelter director, Kristen Hassen-Auerbach, collaborated on the behavior parts of a No Kill Advocacy Center guide that also included medical euthanasia protocols requiring shelter directors to sign off on medical euthanasia decisions. Additionally, the shelter killed cats for medical reasons far quicker than the other shelters (3 days on average compared to 10 days to 39 days) that suggests it did not always do everything it could to save these animals. Simply put, Pima Animal Care Center’s leadership team needs to scrutinize its medical euthanasia decisions much more carefully.
The shelter’s results in this blog are consistent with assertions made by a local no kill group several years ago. In April 2018, No Kill Pima County wrote a blog towards the end of Kristen Hassen-Auerbach’s first year at the facility. In that blog titled “Are We There Yet?”, the advocacy organization stated the shelter still killed animals for “treatable medical conditions”, such as “diabetes”, “poor body scores, renal disease, suspected/undiagnosed early cancer, suspected liver issues or calcivirus with mouth ulcers.” While the records I received did not contain this level of detail, the cat death rates in 2019 were not that much lower than they were at the time No Kill Pima County wrote that blog. Additionally, the blog mentioned the killing of “sweetheart dogs who love people but just cannot get along with other dogs and need to be a ‘one and only.’ ” Given Pima Animal Care Center did kill a decent number of dogs solely for animal aggression in both 2019 and 2020, this issue still exists today. As a result, Pima Animal Care Center has not reached the pinnacle that no kill requires.
Pima Animal Care Center’s performance is disappointing given the vast resources it had. Overall, the shelter had the second highest revenue per dog and cat and it was more than twice as much as Lake County Animal Shelter which had significantly lower dog and cat death rates. Furthermore, Pima Animal Care Center had a new state of the art facility during all the periods I examined (no other shelter had one for both years). Additionally, the facility had the second highest level of rescue support. While the shelter did have the second highest per capita dog intake, its facility also had the second greatest amount of time to get animals out alive due to its large size. Furthermore, Pima Animal Care Center had many intangible resources from the shelter’s relationships with both American Pets Alive and Maddie’s Fund. Clearly, Pima Animal Care Center had the resources to achieve no kill.
Ultimately, Pima Animal Care Center’s performance is a story of a missed opportunity. When Kristen Hassen-Auerbach came to lead the shelter, I had huge expectations given her great success at Virginia’s Fairfax County Animal Shelter and at Austin Animal Center. While Pima Animal Care Center did reduce its dog death rate by a good margin (though still not to a no kill level in my book) after she took over the shelter, the cat death rate remained unchanged. Given the organization moved into a brand new state of the art facility at the end of 2017, these results are underwhelming.
Despite Pima Animal Care Center’s disappointing results, it can easily move up this list and achieve the success it should. If the organization improves its veterinary treatment and related protocols and handles its behavior case dogs better, the shelter can rank higher. Given Pima Animal Care Center’s excellent adoption program, short average lengths of stay and innovative programs (e.g. world class foster program), the shelter should be able to accomplish these things. Unfortunately, the shelter will have to do this without Ms. Hassen-Auerbach as she left to join American Pets Alive in October 2020.
4. KC Pet Project
KC Pet Project’s adoption performance stood out from all the other organizations. During 2019 and 2020, KC Pet Project had the highest adoptions percentage of total outcomes and per capita adoption rates for both dogs and cats. Additionally, the shelter’s 2019 pit bull per capita adoption rate was the highest I’ve ever seen.
While KC Pet Project’s adoption program was excellent, it had the worst owner redemption metrics. Specifically, the shelter had the lowest owner reclaim percentage of total dog outcomes in both 2019 and 2020 and the worst stray dog reclaim rate in 2019. Furthermore, KC Pet Project’s owner reclaim percentage of total dog outcomes has barely increased since 2012 (the first year it took over the shelter). This was the smallest improvement of any shelter. While KC Pet Project did not return any cats to field, this is due to legal constraints.
KC Pet Project’s average length of stay was short and in line with the other shelters. While the organization had the second longest average length of stay for both dogs and cats in 2019, it was pretty close to the next two shelters and still short. When we consider KC Pet Project’s heavy reliance on adoptions, which usually take longer than owner reclaims, shelter-neuter-return and transfers to rescues, this makes sense. In fact, KC Pet Project had the second shortest dog adoption average length of stay and third shortest cat adoption average length of stay. Given KC Pet Project’s high per capita adoption rate, these adoption average lengths of stay are impressive since the organization had to find many adopters.
The shelter did not severely limit intake after the COVID-19 pandemic began. In April-June 2020, the decrease in KC Pet Project’s dog and cat intake from the corresponding 2019 period was similar to most of the other organizations. For all of 2020, KC Pet Project had the smallest decrease in dog intake and took in more cats than the prior year (all the other shelters impounded fewer cats). Thus, KC Pet Project did not leave animals at risk on the streets or elsewhere.
KC Pet Project achieved no kill for cats in both 2019 and 2020. In both years, the organization had death rates that achieved the general no kill standard (i.e. 10%) and my stricter standard (i.e. 8%). However, the shelter did not meet either standard during the three months after COVID-19 started in April-June 2020. The shelter had the second lowest cat death rate in 2019 (just behind the top ranked organization), third lowest cat death rate during April-June 2020 and second highest cat death rate in 2020. Most impressively, KC Pet Project had the lowest nonreclaimed cat adoption rate, which excludes cats returned to owners and shelter-neutered-returned, in 2019 when we include Austin Animal Center with Austin Pets Alive rather than Austin Animal Center alone. Additionally, KC Pet Project had the lowest percentage of cats who died or went missing (when combining Austin Animal Center and Austin Pets Alive) and a medical euthanasia percentage in line with the other shelters during 2019. Finally, the shelter did not kill any cats for behavior/aggression in 2019. Considering KC Pet Project could not do shelter-neuter-return due to legal constraints, these results are impressive.
KC Pet Project failed to achieve no kill for dogs. Overall, the shelter had the highest dog death rate in 2019, April-June 2020 and 2020. While the shelter did meet the general no kill threshold of 10% in these periods, the organization did not come close to meeting my higher standard of 5% in any of them. In fact, the shelter barely met the 10% standard for pit bulls in 2019 (10.4% death rate).
The organization euthanized the second highest percentage of dogs for medical reasons in 2019. When looking at medical euthanasia, KC Pet Project euthanized around 3% more dogs and four times the percentage of dogs than the next higher ranking shelter. While I don’t have the shelter’s detailed reasons for these euthanasia decisions, the difference is too large for me to write these all off as truly hopelessly suffering animals.
KC Pet Project’s behavior killing was shocking and shows why it failed to achieve no kill for dogs. During 2019, the shelter killed the greatest percentage of dogs for behavior. In fact, the shelter killed four times the percentage of the next higher ranking organization and ten times the percentage of the top ranking shelter. When we examine the 2019 numbers more closely, KC Pet Project killed 19 dogs for animal aggression (17 were pit bulls), four dogs for extreme anxiety (three were pit bulls), five dogs for extreme arousal (four were pit bulls) and one dog for extreme resource guarding. In 2020, the shelter killed 19 dogs for animal aggression (14 were pit bulls), two dogs for extreme anxiety (one was a pit bull), seven dogs for extreme arousal (six were pit bulls) and two dogs for extreme resource guarding (one was a pit bull). Additionally, the shelter killed six times the percentage of small dogs for aggression as the next closest shelter in 2019 (the other three shelters did not kill a single small dog for behavior). Clearly, KC Pet Project did not fully commit to respecting the lives of dogs. Thus, KC Project failed to achieve no kill for dogs.
The organization faced a tough challenge in 2019. KC Pet Project had the highest per capita intake for dogs, cats and pit bulls in 2019 and the second highest adult cat per capita intake during that year. Also, the shelter’s smaller size gave it the second shortest amount of time to get animals out alive in 2019. Additionally, KC Pet Project had the second least amount of funding per dog and cat and second worst facility during 2019. Thus, KC Pet Project faced significant obstacles.
While KC Pet Project faced a tough situation in 2019, that does not explain why it killed too many dogs. Many shelters with higher per capita dog intake rates have achieved no kill. Additionally, the organization with the least funding per dog and cat and worst facility had a much lower dog death rate and did not kill dogs for treatable or manageable behavior problems. Furthermore, KC Pet Project moved into a state of the art shelter in the beginning of 2020 and continued to kill dogs for the same reasons as it did in 2019. This $26 million shelter, which taxpayers paid $14 million for, has three times the space as the old one and is located in a desirable location near the Kansas City Zoo and a major theatre. As a result, KC Pet Project failed to achieve no kill for dogs due to the organization not fully respecting life rather than it lacking resources.
Despite KC Pet Project killing dogs, it can still easily achieve no kill if it revamps its dog medical and behavior protocols. On a positive note, the shelter generally took a long time before killing/euthanizing animals (i.e. longest and second longest time on average for cats and dogs among the shelters) which suggests the shelter is giving animals a chance. However, the shelter needs to go further when it comes to dogs. If it does, the organization can easily achieve no kill given the many other things it does well.
3. Austin Animal Center and Austin Pets Alive
Austin Animal Center had no kill level death rates in both 2019 and 2020. In 2019, Austin Animal Center had the third lowest dog death rate (second if not counting Austin Pets Alive) and the best cat death rate. The shelter met my stricter no kill thresholds for cats and was well under the 5% dog death rate standard. However, the shelter dropped to third place (including Austin Pets Alive) when we look at the cat nonreclaimed death rate due to the many cats shelter-neutered-returned. During 2020, Austin Animal Center had the second lowest dog death rate and the third best cat death (second lowest if not counting Austin Pets Alive). For both dogs and cats in 2020, the shelter was well below my no kill death rate thresholds. During April-June 2020, Austin Animal Center had the second lowest dog death rate and the second worst cat death rate. While the shelter was well under my more stringent dog death rate threshold for no kill in this three month period, the facility’s cat death rate was significantly above the more lenient 10% no kill threshold.
The shelter euthanized the lowest percentage of animals for behavior/aggression in 2019. Austin Animal Center euthanized no cats and no small dogs for behavior or aggression. Additionally, the shelter euthanized the fewest percentage of dogs for aggression/behavior and finished a close second (including Austin Pets Alive) and first (not including Austin Pets Alive) when looking at pit bull behavior euthanasia. However, it is possible the two shelters euthanized a greater percentage of dogs for behavior based on much more conservative assumptions (Austin Animal Center-Austin Pets Alive would rank third among the five communities’ shelters). Thus, Austin Animal Center had good behavior euthanasia numbers.
Austin Animal Center’s medical euthanasia and cat death metrics were in line with the other shelters in 2019. Overall, Austin Animal Center and Austin Pets Alive euthanized the third and fourth lowest percentages of dogs and cats for medical reasons. However, these percentages were close to the facilities ranking higher. The two shelters also had the second lowest percentage of cats who died or went missing.
The shelter took a decent amount of time before euthanizing animals. Austin Animal Center had the third longest average length of stay for euthanized dogs and cats.
Austin Animal Center’s owner reclaim performance was average among the shelters. In both 2019 and 2020, Austin Animal Center’s owner reclaims percentage of total dog outcomes ranked third. However, the shelter only ranked fourth for the stray dog reclaim rate. Additionally, the shelter’s owner reclaims percentage of total dog outcomes only increased slightly over the last seven years. Nonetheless, Austin Animal Center’s two owner redemption metrics were very close to the shelters just above it.
Austin Animal Center shelter-neutered-returned the most cats by far of all the shelters. The shelter returned nearly three times the percentage of cats to field as the next closest shelter. As with Pima Animal Care Center, Austin Animal Center shelter-neutered-returned a significant number of under six month old kittens (two to five months old) that I have safety concerns about.
Austin Animal Center’s adoption performance was a mixed bag. When we include Austin Pets Alive, the two organizations had the second highest adoption percentage of dog outcomes in both 2019 and 2020. Both organizations had the third highest per capita dog adoption rate in 2019 and either the second lowest (including puppies born from dogs Austin Animal Center transferred to Austin Pets Alive) or the lowest dog per capita adoption rate (not counting these puppies) in 2020. When it came to cats, the two shelters had the second lowest cat adoptions percentage of outcomes in 2019 and 2020. The two combined shelters had the second lowest cat per capita adoption rate in 2019 and either the second lowest (counting kittens born after Austin Animal Center transferred their mothers to Austin Pets Alive) or the lowest cat per capita adoption rate (not counting these kittens) in 2020. However, Austin Animal Center itself (i.e.without Austin Pets Alive) finished dead last in every adoption metric except for the 2020 adoption percentage of dog outcomes (the shelter placed second to last). Thus, Austin Animal Center did a poor job adopting out animals and relied heavily on Austin Pets Alive to find animals new homes.
While Austin Animal Center had pretty good average length of stay metrics, the figures are skewed due to the shelter transferring many animals to Austin Pets Alive. Overall, Austin Animal Center had the second shortest average lengths of stay for dogs and cats. The shelter also had the third shortest dog adoption average length of stay and second longest cat adoption average length of stay. However, this data is misleading since Austin Animal Center transfers so many more animals than the other shelters. Given many animals stay a long time at Austin Pets Alive, an apples to apples comparison with the other organizations would likely show Austin Animal Center and Austin Pets Alive have a much longer combined average length of stay. Thus, Austin Animal Center and Austin Pets Alive’s combined average length of stay metrics likely would rank lower (especially when it comes to adoptions).
Austin Animal Center faced the easiest challenge of all the shelters. While the shelter did have the shortest time to get animals out alive due to the smaller size of its facility (which was due to Austin Animal Center management at the time), the organization also received the second fewest dogs and cats on a per capita basis. In fact, Austin Animal Center took in around only half as many pit bulls and adult cats on a per capita basis as the highest per capita intake shelter. Additionally, Austin Animal Center sent two to three times the percentage of dogs and four to fifteen times the percentage of cats to rescues and other shelters as the other organizations. Austin Animal Center also received significantly more funding per dog and cat than the other shelters. In fact, the shelter received around three times as much as the shelter with the lowest revenue per dog and cat. Finally, Austin Animal Center had a very good physical facility. As a result, Austin Animal Center had far more resources than the other shelters.
The shelter’s results also raise concerns about how it tried to achieve no kill. First, 20% of the cats released through the shelter-neuter-return programs were between two to five months old and may be at higher risk of prematurely dying outdoors. Second, Austin Animal Center took in 72% and 50% fewer dogs during April-June 2020 and in all of 2020 compared to the prior year periods. Similarly, the shelter shelter impounded 74% and 55% fewer cats over these time frames. In fact, no other shelter came close to these decreases except for Pima County Animal Care (cats during April-June 2020). Given this data corroborates local advocates claims about the shelter leaving animals on the streets and the shelter’s management efforts to codify that practice, this is a major issue for me.
Ultimately, Austin Animal Center did not rank higher due to it not performing well enough with its vast resources. While the shelter did have good respect for life data (i.e. death rates, percentages of animals euthanized for behavior and medical reasons), the results did not stand out from the higher ranking shelters with far less rescue help and funding. Furthermore, the shelter seemed to try and take shortcuts to achieve no kill that put animals at risk. Thus, Austin Animal Center’s performance fell short of the the two higher ranking shelters.
2. Williamson County Animal Shelter
Williamson County Animal Shelter had low death rates. In 2019, the shelter had the second best dog death rate (1.8%), which was well below my no kill threshold of 5%, when we combine Austin Animal Center and Austin Pets Alive and the second highest cat death rate (10.8%). The 2019 cat death rate seems like a fluke as the cat death rates in 2017 (9.6%), 2018 (7.0%) and 2020 (April-June: 7.6%; full year: 5.4%) were much lower and met the general or even my more stringent no kill thresholds. In fact, Williamson County Animal Shelter mentioned it struggled with many cruelty cat cases (where the cats must stay in the shelter until the case is adjudicated) in its fiscal year ending 9/30/19 report. During April-June 2020, Williamson County Animal Shelter had the second lowest dog death rate (2.5%) when we combine Austin Animal Center and Austin Pets Alive and the lowest cat death rate. For all of 2020, Williamson County Animal Shelter’s dog death rate tied for second place when combining Austin Animal Center and Austin Pets Alive (including puppies born at Austin Pets Alive) and the shelter’s cat death ranked best. Thus, Williamson County Animal Shelter had impressively low death rates.
The shelter did an excellent job with behavior cases animals. Williamson County Animal Shelter did not kill a single cat or small dog for behavior/aggression in 2019. Additionally, the organization euthanized the third fewest dogs for behavior (0.47%) and was very close to the two higher ranking shelters. While the shelter did euthanize two dogs for animal aggression, the shelter’s questionable dog euthanasia decisions were far fewer than KC Pet Project and Pima Animal Care Center.
Williamson County Animal Shelter’s medical euthanasia statistics were generally good. Overall, the shelter had the second lowest dog medical euthanasia rate and best cat medical euthanasia percentage when combining Austin Animal Center and Austin Pets Alive during 2019.
While Williamson County Animal Shelter’s percentage of cats who died or went missing (7.04%) was second highest in 2019, this was likely an anomaly due to the many cruelty cases that year. In 2017, 2018 and 2020 the percentages were only 5.3%, 3.4% and 2.5%. These percentages would either fall in line with the other shelters in 2019 or rank among the best.
The shelter also did a good job returning dogs to owners. Williamson County Animal Shelter had the second highest owner reclaims percentage of dog outcomes in both 2019 and 2020. Additionally, the facility had the third best improvement in this metric. Finally, the shelter had the third highest stray dog reclaim rate in 2019.
While Williamson County Animal Shelter did not shelter-neuter-return cats, it still had a good size community cat sterilization program. If we counted the shelter’s TNR cats in its statistics, these would have been 11% of cat outcomes.
Williamson County Animal Shelter’s dog adoption performance was pretty good. The shelter had the third and fourth highest adoptions percentage of dog outcomes in 2019 and 2020. The organization had the fourth highest per capita dog adoption rate in both 2019 and 2020. However, the shelter’s high percentage of owner reclaims and lower dog intake (for the per capita dog adoption rate) impacted these metrics. Given we want shelters to return dogs to owners, this is a good thing.
Williamson County Animal Shelter did an excellent job adopting out cats. In 2019 and 2020, the shelter had the second highest adoptions percentage of cat outcomes. Additionally, the shelter had the third best (just behind the facility above it) and second highest per capita cat adoption rate in 2019 and 2020.
While Williamson County Animal Shelter had much longer average lengths of stay than the other shelters, I could not make conclusions due to discrepancies between this data and what the shelter reported. Therefore, I did not incorporate average length of stay into my assessment.
Williamson County Animal Shelter did not leave animals on the streets after COVID-19 began. During April-June 2020, the shelter’s dog intake decreased around the same as most of the other shelters and its cat intake dropped the least. Similarly, Williamson County Animal Shelter’s dog intake decreased around the same as the other organizations and its cat intake dropped by the second smallest percentage for all of 2020.
The shelter’s challenges were about average among the facilities. While Williamson County Animal Shelter had the lowest per capita dog intake in 2019, it had the third highest per capita cat intake that year. The organization had the third shortest time to get animals out alive in 2019. During 2019 and 2020, Williamson County Animal Shelter had the third and second worst physical facility. The shelter had the third smallest amount of funding per animal in 2019. Additionally, the shelter had the second lowest amount of rescue support for both dogs and cats. While the shelter did not break out most dog breeds in 2019, the shelter took in a much smaller number of pit bulls on a per capita basis than the other facilities when it last included this information.
Overall, Williamson County Animal Shelter performed extremely well. The shelter’s balanced approach helped it achieve no kill in a variety of ways (i.e. owner reclaims, community cat sterilization and adoptions). Additionally, the shelter mostly demonstrated good respect for life. So why didn’t Williamson County Animal Shelter rank first? The shelter’s dog breed data and average length of stay data was not sufficient in 2019. More importantly, the top ranking shelter just performed better. Regardless, Williamson County Animal Shelter should be proud of its accomplishments.
1. Lake County Animal Shelter
Lake County Animal Shelter had the lowest dog death rates and achieved no kill for dogs in every period. In 2019, the shelter’s dog death rate was just 1.1%, which was way below my more strict 5% no kill threshold, and was significantly better than every other organization. When we look at just pit bulls in 2019, the 2.1% death rate was around 1.3% to 1.6% lower than the next highest ranking shelter (when combining Austin Animal Center and Austin Pets Alive). The pit bull death rate difference was even larger than for all dogs. During April-June 2020 and all of 2020, Lake County Animal Shelter’s dog death rates were 0.7% and 1.9% and again were significantly lower than the next closest shelter (i.e. 1.8% less and 0.7% less in April 2020-June 2020 and all of 2020). Thus, Lake County Animal Shelter had the best dog death rates and easily achieved no kill for dogs.
The shelter also had low cat death rates. In 2019, the shelter’s 9.0% cat death was less than the general no kill threshold of 10%. While the cat death rate was slightly higher than my more stringent no kill threshold of 8.0%, its possible the shelter’s cat death was lower if some cats I excluded from the calculations as TNR were really shelter-neuter-return (i.e. finder brings cat to shelter as a stray, but then agrees to do TNR and become a caretaker). In fact, the facility’s stray cat intake from finders decreased significantly in 2019 while the number of cats it took in under its Operation Caturday sterilization program increased that year. Even using the 9.0% cat death rate, Lake County Animal Shelter finished in third place and its cat death rate was less than 1% higher than the best performing shelter (when combining Austin Animal Center and Austin Pets Alive). During April-June 2020 and all of 2020, Lake County Animal Shelter’s 7.9% and 6.2% cat death rates were both lower than my more strict no kill threshold. In both periods, Lake County Animal Shelter had the second lowest cat death rate (when combining Austin Animal Center and Austin Pets Alive). Thus, Lake County Animal Shelter did an excellent job with cats.
Lake County Animal Shelter also handled behavior euthanasia decisions extremely well. The shelter did not kill a single cat or small dog for behavior/aggression in 2019. Additionally, the shelter euthanized the second lowest percentage of dogs for behavior (just behind Austin Animal Center) and the lowest percentage of pit bulls for behavior (when combining Austin Animal Center and Austin Pets Alive).
The shelter also limited medical euthanasia to a great degree. In 2019, Lake County Animal Shelter euthanized the smallest percentage of dogs and second lowest percentage of cats (when combining Austin Animal Center and Austin Pets Alive) for medical reasons. Additionally, the shelter’s percentage of cats who died or went missing was in the middle of the range for all shelters and within 1% of the best performing shelter (when combining Austin Animal Center and Austin Pets Alive). Finally, the shelter took a similar amount of time before euthanizing animals as other high performing shelters. As a result, Lake County Animal Shelter did an excellent job treating and saving sick and injured animals.
Lake County Animal Shelter outperformed all the other shelters when it came to returning dogs to owners. In 2019, Lake County Animal Shelter’s owner reclaims percentage of dog outcomes and stray dog reclaim rate were significantly higher than the other shelters. During 2020, Lake County Animal Shelter’s owner reclaims percentage of dog outcomes further increased and was around 12% higher than the next best organization. Furthermore, Lake County Animal Shelter increased its owner reclaims percentage of dog outcomes more in the four years after it went no kill than all the other shelters did over periods ranging from seven to thirteen years. Simply put, Lake County Animal Shelter’s proactive owner redemption program is a role model for all shelters.
The shelter also had excellent community cat sterilization programs. Lake County Animal Shelter had the third highest shelter-neuter-return percentage and ranked close behind the second place shelter. As mentioned above, the organization’s shelter-neuter-return percentage could be higher if some the cat sterilizations I excluded as TNR were really shelter-neuter-return. If we counted all cat sterilizations in total cat outcomes, these would represent 22% of such outcomes and be twice Williamson County Animal Shelter’s percentage. Unlike the two higher ranking shelter-neuter-return facilities, Austin Animal Center and Pima Animal Care Center, Lake County Animal Shelter did not shelter-neuter-return a single cat that was under six months of age. Thus, Lake County Animal Shelter’s excellent community cat sterilization programs helped large numbers of cats and did so in a manner consistent with no kill values.
Lake County Animal Shelter dog adoption metrics were in the middle and lower end of the rankings. In 2019, the shelter’s adoption percentage of dog outcomes ranked last and its per capita dog adoption rate was tied for fourth best when combining Austin Animal Center and Austin Pets Alive. However, when we look at harder to adopt pit bulls, Lake County Animal Shelter placed third in both metrics. In 2020, the shelter’s adoption percentage of dog outcomes ranked last, but the shelter’s per capita dog adoption rate was third best.
While these dog adoption results may not seem that impressive, they are when you consider the shelter had fewer dogs to adopt out due to it returning so many dogs to owners. In fact, Lake County Animal Shelter had the highest percentage of dogs returned to owners or adopted out and third highest on a per capita basis. Additionally, the two shelters that had more dogs returned to owners or adopted out on a per capita basis took in more dogs and had much higher kill rates. Therefore, these two higher ranking shelters had more dogs and more easy to adopt ones to place. As a result, Lake County Animal Shelter’s dog adoption results were very good when considering the big picture.
Lake County Animal Shelter’s cat adoption results were very good. During 2019, the shelter had the third best adoption percentage of cat outcomes and second highest per capita cat adoption rate. Since the organization shelter-neutered-returned a significant number of cats, its adoption numbers were lower than they would have otherwise been. In 2020, Lake County Animal Shelter had the third best adoption percentage of cat outcomes and per capita cat adoption rate (which was more than double the fourth place shelter’s rate). Thus, Lake County Animal Shelter did an excellent job at adopting out cats.
The shelter also placed animals quickly. Overall, Lake County Animal Shelter had the third shortest average length of stay for both dogs and cats. However, the shelter would have had a shorter average length of stay and placed second for dogs, and possibly for cats, if we had Austin Pets Alive’s length of stay data for dogs and cats Austin Animal Center transferred to Austin Pets Alive. Additionally, the 19.2 days and and 29.2 days average lengths of stay for dogs and cats were very short. When we look at average adoption lengths of stay, Lake County Animal Shelter placed fourth for dogs and second for cats. However, the shelter would undoubtedly place third for dogs if we had Austin Pets Alive’s length of stay data. Additionally, KC Pet Project, which ranked just above Lake County Animal Shelter for dog adoptions average length of stay, killed a much larger percentage of dogs and had an easier mix of dogs to adopt out (i.e. have shorter lengths of stay). Thus, Lake County Animal Shelter got animals out alive of its shelter quickly.
Lake County Animal Shelter had a difficult challenge with animal intake and rescue assistance during 2019. While the shelter had the longest time to get animals out of its facility alive, it wasn’t much more than most of the other shelters and was still short. On the other hand, Lake County Animal Shelter had the third highest per capita dog and cat intake (fourth for dogs and second for cats) and the highest per capita dog and cat intake among the low death rate shelters. Additionally, Lake County Animal Shelter had the third highest pit bull per capita intake, which was highest among the low death rate shelters, and highest per capita adult cat intake. Furthermore, Lake County Animal Shelter had the third lowest amount of rescue assistance for both dogs and cats and it was close to the organization transferring the smallest percentage of animals. Thus, Lake County Animal Shelter faced a very difficult circumstance with the volume of animals it received.
The shelter had the least financial resources and worst physical facility. In 2019, Lake County Animal Shelter had around 30% less revenue per dog and cat than the shelter with second least funding per animal. Furthermore, Pima Animal Care Center and Austin Animal Center had two to three times the funding per dog and cat as Lake County Animal Shelter. In both 2019 and 2020, Lake County Animal Shelter had the worst physical facility. Additionally, the building was nowhere even close in terms of physical quality as the others in 2020 after KC Pet Project moved out of its old shelter. As a result, Lake County Animal Shelter faced the greatest challenge by far in terms of financial and physical resources.
Overall, Lake County Animal Shelter was the clear winner in this comparison. First and foremost, the shelter demonstrated the greatest respect for life, both inside and outside the shelter. Additionally, the shelter’s balanced approach, such as its proactive owner redemptions, community cat sterilization and high-powered adoption programs, allowed it to achieve no kill in an effective, efficient and sustainable manner. As I mentioned in a prior blog, Lake County Animal Shelter comprehensively implemented all eleven No Kill Equation programs. Furthermore, the shelter achieved this success while facing greater challenges than the other facilities. Simply put, Lake County Animal Shelter stood out from the other organizations and is the nation’s top no kill shelter.
No Kill Shelters Must Show the Utmost Respect for Life
This analysis proves no kill works and disproves anti-no kill arguments. Despite critics claiming no kill is impossible, all the shelters saved 90% or more of their pit bulls and did not kill a single cat for behavior or aggression. Additionally, most of the shelters did not kill a single small dog for behavior or aggression. Finally, the shelters placed animals quickly and did not “hoard” animals.
The blog also exposes a clear divide among shelters claiming no kill status. As the death rate and euthanasia reasons data showed, some shelters showed a great respect for life and some did not. While none of the shelters killed animals left and right, Pima Animal Care Center and KC Pet Project clearly killed some animals and failed to achieve no kill. Even though Austin Animal Center had good death rate and euthanasia reasons statistics, the shelter’s intake and community cat placement data indicate the shelter’s respect for life outside of the facility is not strong enough. Thus, no kill mandates shelters fully respect life.
The lower ranking shelters must refocus on fully respecting life. Ironically, the shelters that publicized themselves and their programs the most, such as through conference presentations, blogs, webinars and sheltering industry Zoom meetings, performed the worst. While these organizations successfully put many excellent programs into place, these shelters still failed to achieve no kill in my view. Why? One could argue these shelters failed to properly implement the No Kill Equation’s Medical and Behavior Prevention and Rehabilitation program and therefore killed treatable animals. However, I believe we must look deeper than this. After all, one might say KC Pet Project did do behavioral rehabilitation for its dogs given the long time it took to euthanize dogs for behavior and aggression. Similarly, Austin Animal Center’s Medical and Behavior Prevention and Rehabilitation program had nothing to do with the shelter’s failure to take in animals off the streets in 2020 or the facility shelter-neuter-returning younger kittens. Instead, these shelters did not fully respect life and made decisions to kill animals or put them at too much risk outside their facilities. Ultimately, progressive shelter programs, such as those found in the No Kill Equation, are a means to ending the killing of treatable animals. In other words, the principal of respecting life reigns supreme. As a result, the lower ranking shelters must refocus on fully respecting life rather than solely concentrating on technical programs to achieve no kill.
Appendix – Data Sources and Raw Statistics
Pima Animal Care Center
2019 Dogs, Adult Cats, Older Kittens and Neonatal Kittens
2020 Dogs, Adult Cats, Older Kittens and Neonatal Kittens
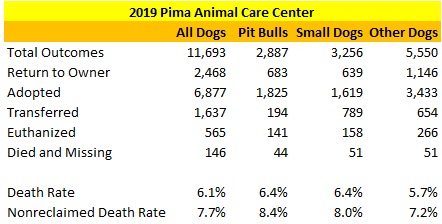


KC Pet Project
April-June 2020 and 2019 Dogs and Cats
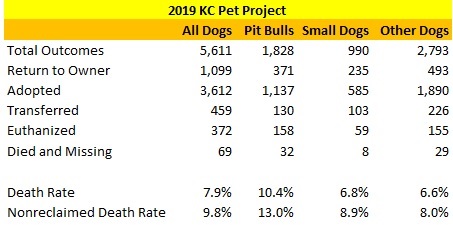


Austin Animal Center
2019, April-June 2019 and 2020 and 2020
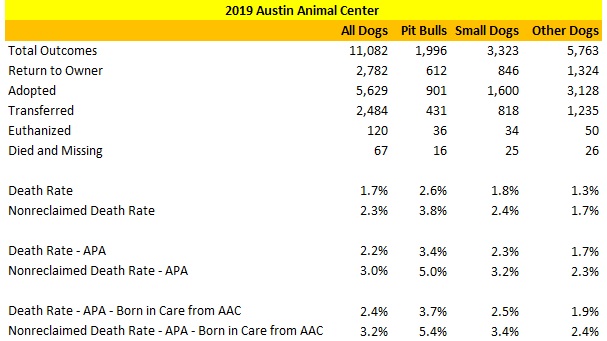
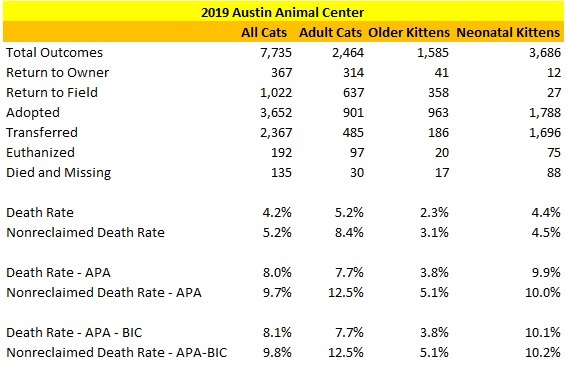
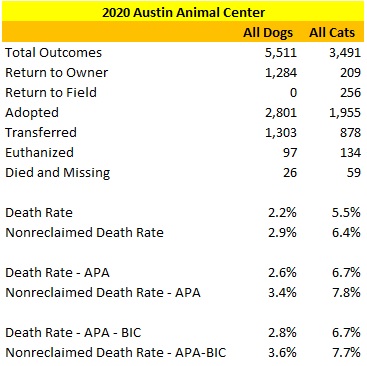
Williamson County Animal Shelter
2019 and April 2019-June 2019 Dog and Cat Outcomes
2020 and April 2020-June 2020 Dog and Cat Outcomes
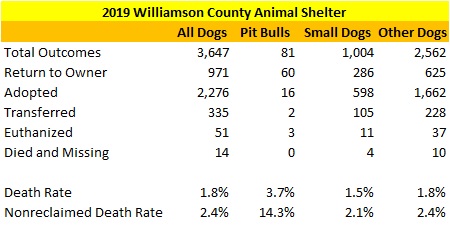
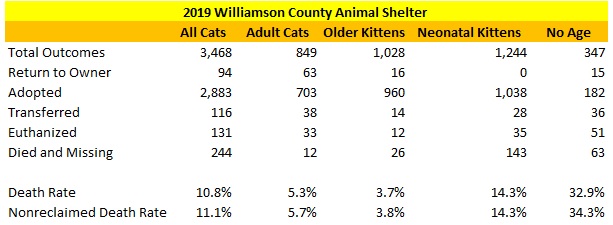
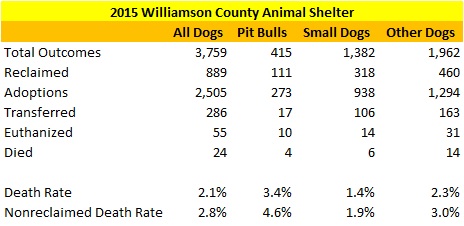
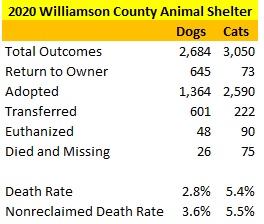
Lake County Animal Shelter
2019 Dog and Cat Intakes and Outcomes
April 2019-June 2019 and April 2020-June 2020 Dog and Cat Intakes and Outcomes
2020 Dog and Cat Intakes and Outcomes