Roger Haston’s Ridiculous Kill Shelter Model

Last January, I wrote about Dr. Roger Haston’s “The Future of Animal Welfare” presentation at an Animal Care Centers of NYC sponsored event. Dr. Haston, who was serving as the Chief of Analytics at PetSmart Charities at the time, was giving the same presentation at events held by shelters across the nation. While I acknowledged Roger Haston made some good points, I was deeply disturbed by his anti-pit bull and pro-killing shelter animals views. Furthermore, I addressed a number of problems with the arguments and so-called facts he presented. Subsequently, Animal Farm Foundation wrote a blog refuting many of Dr. Haston’s points and futile attempts to get Dr. Haston to address these. Additionally, Nathan Winograd dismantled Dr. Haston’s pro-killing arguments.

Shortly thereafter, Roger Haston left PetSmart Charities. Currently, Dr. Haston’s Linkedin profile states he is the President of the Institute for Animals. Unfortunately, I could not find anything about this organization. However, Dr. Haston’s Linkedin profile states the following about his position:

Strategy development, though leadership, research and leadership development services for the animal welfare industry. Focusing on the positive aspects of the relationship between people and animals.

Based on this description, it seems Dr. Haston may provide consulting services to animal shelters. Given the views Dr. Haston expressed in his “The Future of Animal Welfare” presentation, it seems kill shelters could look to him for guidance. In other words, kill shelters might look to his analyses as a way to argue against no kill.

What is the analytical basis of Dr. Haston’s anti-no kill views? Does this analysis make sense? Does this analysis match reality?

Haston’s Anti-No Kill Model

While Roger Haston did not present the model he used as the basis for his recent “The Future of Animal Welfare” events, a presentation from several years before may provide this information. In January 2015, when Dr. Haston was the Executive Director of Colorado’s Animal Assistance Foundation, he gave a presentation titled “Beyond Labels: Understanding the True Impact of Live Release Rates and Intake Policies” in a Society of Animal Welfare Administrators webinar. You can view the presentation here and the accompanying slides here.

Dr. Haston uses an interesting and robust statistical method, stochastic modeling, to conduct his analysis. Most animal sheltering data models, such as the one I created, use “deterministic modeling.” Deterministic modeling yields the same results from the inputs or variables included. On the other hand, stochastic modeling, incorporates the varied results an input or variable could have to predict the results generated from those variables. Therefore, in theory stochastic modeling is a powerful statistical tool.

While the deterministic model I use to target New Jersey animal shelter performance (amounts of animals shelters should adopt out, send to rescues and euthanize) is simpler theoretically, I reduce much of the sources of variability and therefore weaknesses of this type of model. For example, I analyze animal intake on a monthly basis, which accounts for higher intake during warmer months, and incorporate the breeds of dogs and ages of animals shelters impound and the overall adoption demand in a region. Furthermore, since I assess past performance, much of the input data I use has no variability at all. Therefore, my model performs quite well when I compare it to the actual benchmark shelters’ performance I use.

In a nutshell, Dr. Haston uses various shelter data estimates to make future projections. For example, he forecasts if a shelter will exceed capacity, what will happen when it exceeds capacity and what the facility’s future financial performance will look like.

Rigged Assumptions Lead to Anti-No Kill Results

Dr. Haston’s model would yield the same general conclusion regardless if he used stochastic or deterministic modeling. Why? He uses excessive animal intake and insufficient shelter capacity, excludes some of the quickest ways animals leave shelters and ignores how shelters would act if they exceeded capacity.

In Dr. Haston’s model, he assumes the shelter takes 3,000 dogs in during the year and the facility can hold 150 dogs at one time. Additionally, he assumes, based on an undisclosed sample of shelters, that different classes of dogs (from most to least adoptable) make up different portions of shelter intake and have varying average lengths of stay.

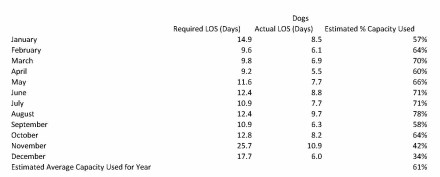
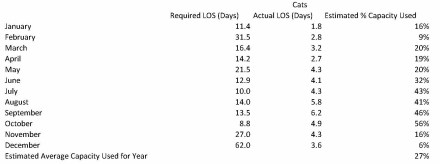
Using standard animal shelter capacity calculations, which assume animals come in evenly during the year, the shelter would have to on average move its dogs out of the shelter in 18.3 days or less to avoid consistently going over capacity. However, Dr. Haston’s model, which is based on each major class of dog’s average length of stay, shows these dogs would have an average length of stay of 32.0 days. Thus, a less sophisticated model would also show this shelter quickly exceeding capacity.

If there is anything to take away from this blog, this is it. Why? These key assumptions drive Dr. Haston’s subsequent conclusions that no kill animal control shelters severely restrict intake, are filled with animals few or no people want and financially implode.

Under Dr. Haston’s model, a shelter only adopts out or euthanizes an animal under the assumption all dogs are owner surrenders. Obviously, that is not realistic since stray dogs usually are a larger source of dog intake than owner surrenders. In addition, owners sometimes reclaim dogs they previously surrendered.

Typically, owners reclaim lost dogs within a few days since the animals usually have a license and/or a microchip that allows shelters to quickly identify the owner. Therefore, the model yields an excessively long average length of stay since it excludes owner reclaims.

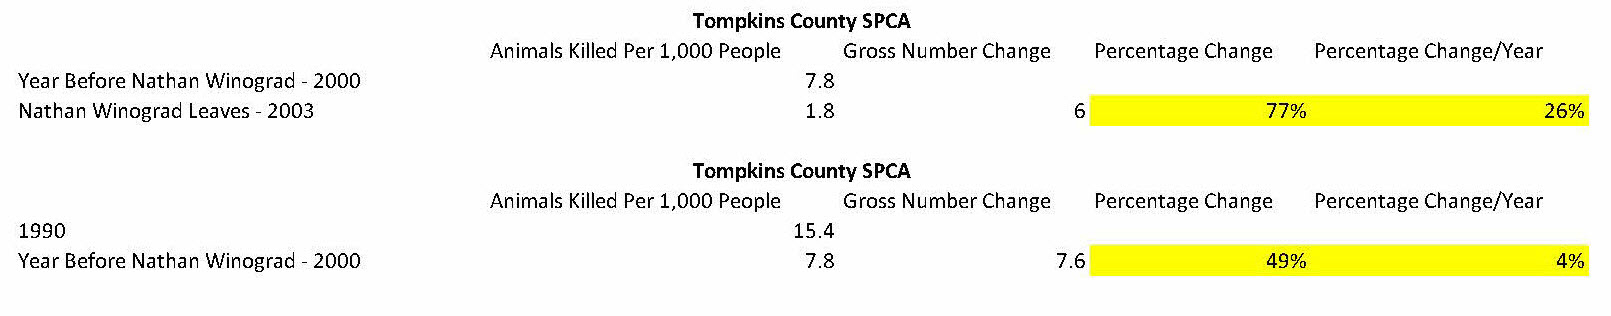
To incorporate owner reclaims into the analysis, I used Tompkins County SPCA’s most recent statistics. Dr. Haston appeared to use Tompkin County SPCA’s adoption length of stay based off his citation of Brown, et al., 2013. While Dr. Haston did not give the full reference of this source, I believe it is this study that takes place mostly at Tompkins County SPCA from 2008-2011 which I use in my own dog analysis. Since I could only find Tompkins County SPCA’s 2018 data, I used this data to compute a revised average length of stay from Dr. Haston’s model based on an assumed 3 days and 32 days average length of stay for owner reclaims and all other outcomes and the percentage owner reclaims made up of total adoptions, total euthanasia and total owner reclaims at Tompkins County SPCA in 2018. A 3 day average length of stay falls into the middle of the range of owner reclaims’ average length of stay I computed from several New Jersey animal control shelters.

After making this adjustment, the model’s average length of stay decreased from 32.0 days to 23.1 days. As a result, the difference between the average length of stay required to avoid exceeding capacity continuously and the model’s average length of stay dropped significantly.

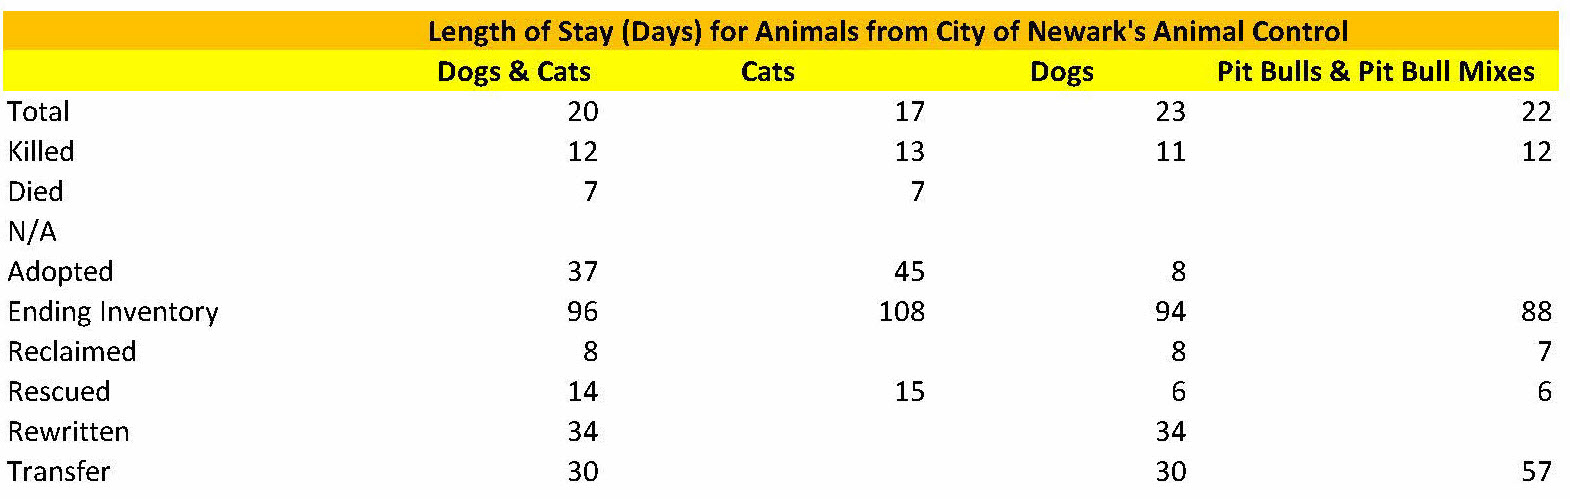
As you will see below, several no kill animal control shelters have dog average lengths of stay around the required average length of stay to avoid perpetual overcrowding implied in Dr. Haston’s model. First, these shelters generally do a better job adopting out dogs than the facility (primarily Tompkins County SPCA from 2008-2011) Dr. Haston used and most likely adopt out dogs quicker. Second, Dr. Haston’s model does not incorporate dogs shelters transfer to rescues. Frequently, shelters can transfer dogs quicker to rescues, especially when the facilities are rescue friendly and make an effort. For example, the Paterson Animal Shelter, which is far from a progressive shelter, transferred a large percentage of all of its dogs as well as pit bull like dogs in 2015 after just seven days on average. Similarly, 2018 Animal Care Centers of NYC data I obtained showed the organization transferred a large number of dogs to rescues in ten days on average. Additionally, my 2017 analysis of Elizabeth Animal Shelter indicated dogs adopted out and transferred to rescues, which mostly were dogs sent to rescues rather than adopted out, spent only 14 days in the shelter. Thus, Dr. Haston’s failure to use role model no kill animal control shelters and dogs sent to rescues in his model makes the model yield inaccurate or skewed results.

Dr. Haston’s failure to include foster homes in his model grossly understates shelter capacity. While most people appreciate the benefits foster programs can have on both the mental and physical health of animals, many don’t realize how much extra capacity these programs can add to a shelter. For example, Dr. Ellen Jefferson provided a goal in a presentation at the 2019 American Pets Alive Conference for animal control shelters to have 3% of their annual dog intake in foster homes at a given point in time. Dr. Jefferson developed this target based on certain no kill animal control shelters’ successful foster programs. Since average length of stay incorporates animals in foster homes, we can add this to the shelter’s dog holding capacity in Dr. Haston’s example. This adjustment increases the shelter’s capacity from 150 dogs to 240 dogs.

As you can see below, the shelter in Dr. Haston’s example will normally have significant excess capacity even without accounting for animals sent to rescues and no kill animal control shelters with stronger adoption programs. While the inherent volatility of dog intake at an animal control shelter, such as a large hoarding case, could temporarily cause capacity concerns, this data shows Dr. Haston’s perpetual overcrowding and related conclusions are simply incorrect.

Real World Data Contradicts Dr. Haston’s Predictions

Dr. Haston’s model predicts a 95% live release rate animal control shelter will have a ridiculously long average length of stay. While his model implies a 32 day average length of stay based on the make-up of dogs brought to the shelter, the model actually predicts an astonishing 90 day average length of stay after one year.

Why does the model predict such a longer average length of stay? Unfortunately, Dr. Haston doesn’t explain whether he is calculating average length of stay for all the animals that came into the shelter during the period or the actual population of dogs in the shelter at a point in time. Assuming Dr. Haston calculated average length of stay of all dogs taken in during the period, which is how shelters typically calculate this metric, the increase in average length of stay from 32 days to 90 days may be due to the shelter exceeding capacity and not accepting all dogs, including many easy to adopt ones. Therefore, the harder to adopt dogs, which take significantly longer to place, will make up a larger portion of the total dog intake and increase the average length of stay.

Even if shelters consistently exceed capacity, which they shouldn’t as explained above, managed admission policies could mitigate that. For example, a managed admission shelter would be more likely to immediately accept an easier to adopt small dog than a larger dog with behavioral issues if the facility was near or at capacity. Therefore, these shelters would have  a much shorter average length of stay than 90 days if these facilities exceeded capacity consistently and restricted intake.

To analyze the Dr. Haston model’s predictions, I compared his model’s key results to actual data from three no kill animal control shelters. These shelters are as follows:

  1. KC Pet Project serving Kansas City, Missouri
  2. Williamson County Animal Shelter serving most of Williamson County, Texas
  3. Lynchburg Humane Society serving Lynchburg, Virginia during the period of my analysis

Due to the lag in non-profit financial data reporting, I had to use 2017 and 2016 data for KC Pet Project and Lynchburg Humane Society, respectively. I listed the links to the data I used in this analysis at the end of this blog.

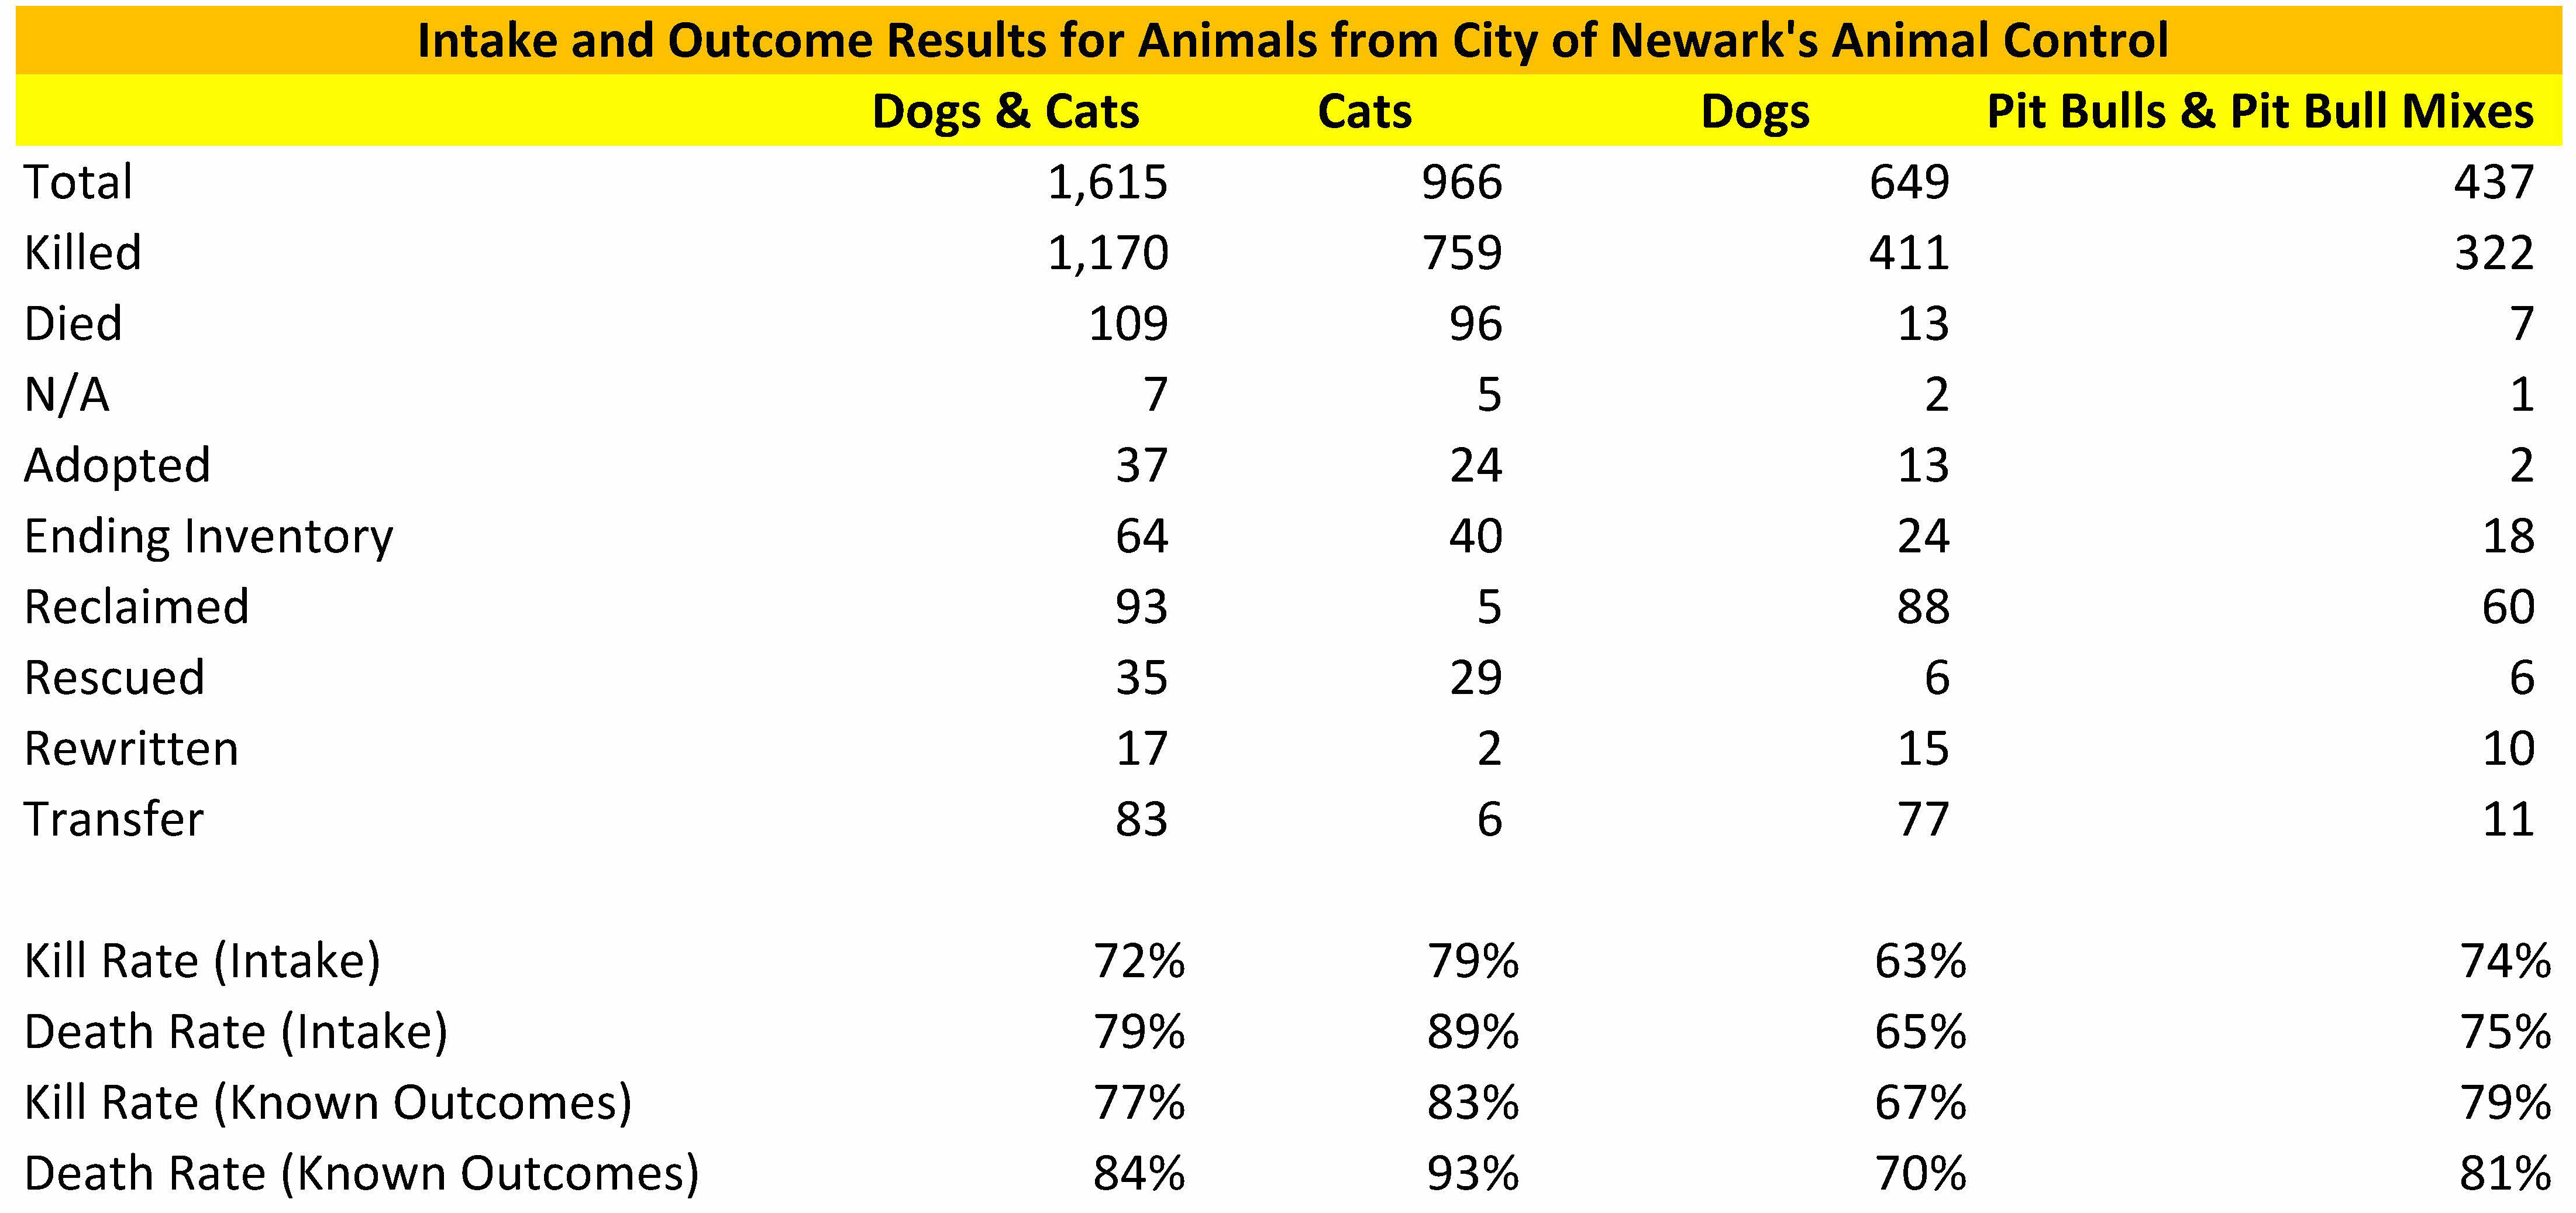
The average length of stay computed by Dr. Haston’s model vastly exceeds the three no kill animal control shelters’ average lengths of stay. Specifically, Dr. Haston’s model predicts an animal control shelter with a 95% live release rate will have an average length of stay of 90 days while KC Pet Project, Williamson County Animal Shelter and Lynchburg Humane Society had average lengths of stay of 18 days, 9 days and 19 days. In other words, Dr. Haston’s model predicted average lengths of stay five to ten times longer than these three comparable no kill animal control shelters with the same or higher live release rates. Thus, Dr. Haston’s conclusion that a 95% dog live release rate at an animal control shelter will result in the shelter holding large numbers of animals for extremely long times does not match the reality of well run no kill animal control facilities.

Successful no kill animal control shelters also have significantly lower costs than the amounts Dr. Haston’s model predicts. Dr. Haston’s model appears to only include medical and behavior costs in its “operating costs.” Unfortunately, I don’t have this subset of data for the three no kill animal control shelters. Therefore, I used each organization’s total costs, which would include other costs, such as various fixed and overhead costs, that Dr. Haston’s operating costs do not appear to include. To allocate these costs just to dogs, I used each shelter’s annual intake of dogs and cats as well as an estimate of the per animal cost based on average length of stay from the Maddie’s Fund Financial Management Tool. Even using an apparently broader measure of shelter costs, the estimated total costs per dog at KC Pet Project, Williamson County Animal Shelter and Lynchburg Humane Society were $406, $287 and $635 compared to the $750 per dog figure Dr. Haston’s model predicted.

Dr. Haston’s model also understates shelter revenue at no kill animal control shelters. Specifically, Dr. Haston only measures adoption revenue. In reality, adoption fees usually fall way short of covering animal care costs. No kill animal control shelters recoup some of these costs through funding received from the governments running or contracting with them. However, no kill organizations, especially private ones, receive significant donations since the public wants to support shelters that save lives. As you can see below, the estimated total revenue per dog (allocated the same way as total costs per dog above) was $381, $453 and $701 at KC Pet Project, Williamson County Animal Shelter and Lynchburg Humane Society compared to the $176 of adoption revenue per dog Dr. Haston’s model predicted.

The three no kill animal control shelters’ revenue and cost data disprove Dr. Haston’s implicit assertion that no kill leads to financial ruin. Dr. Haston’s model predicted a net loss of around $574 per dog. During the periods presented, both Williamson County Animal Shelter and Lynchburg Humane Society, which received only modest government funding, turned an estimated profit of $166 per dog and $66 per dog, respectively. While KC Pet Project did have an estimated loss of $25 per dog during the year presented, this was an anomaly. Since KC Pet Project was formed in 2011 and began running a no kill animal control shelter shortly thereafter, its net assets increased from $0 to $1,146,550 due to its revenues exceeding its costs over this time period. Thus, Dr. Haston’s model predicting financial ruin at no kill animal control shelters does not match the experience of these three no kill groups.

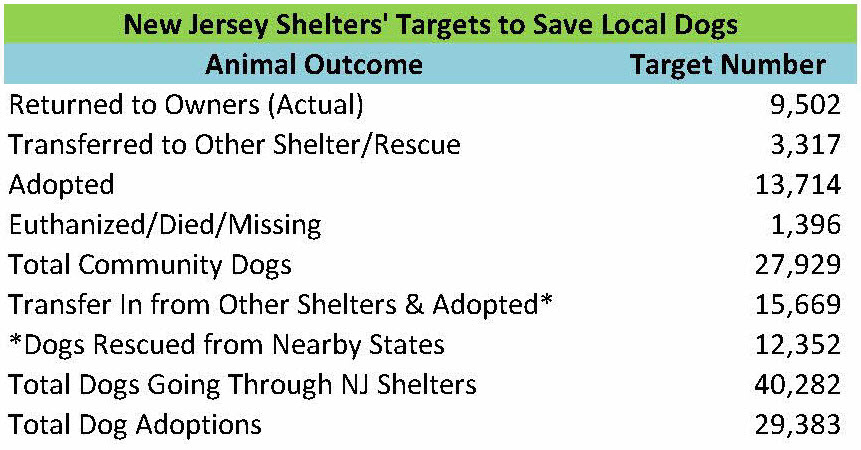
These three no kill organizations also disprove Dr. Haston’s assertion that a 95% live release rate animal control shelter turns significant numbers of dogs away. According to widely accepted estimates, the average American animal control shelter takes in 14 dogs and cats per 1,000 people. Based on the ASPCA’s estimated total animal shelter intake in the United States, which includes animal control and rescue oriented facilities, approximately half the animals are dogs and half are cats. Therefore, the average American animal control shelter takes in around 7 dogs per 1,000 people. As you can see below, KC Pet Project, Williamson County Animal Shelter and Lynchburg Humane Society took in 12 dogs per 1,000 people, 8 dogs per 1,000 people and 22 dogs per 1,000 people. In other words, these three shelters received more dogs than the average American animal control shelter. While these three no kill facilities do manage intake at times, its hard to argue they are “turning away” significant numbers of dogs and those dogs are having bad outcomes.

The three no kill animal control shelters also disprove Dr. Haston’s prediction that an animal control shelter with a 95% live release rate will do few adoptions. As you can see below, KC Pet Project, Williamson County Animal Shelter and Lynchburg Humane Society adopted out 6 dogs per 1,000 people, 5 dogs per 1,000 people and 18 dogs per 1,000 people. In other words, these three shelters adopt out around as many or significantly more dogs than the average American animal control shelter takes in let alone adopts out.

Absurd Predictions When Incorporating Rescue Oriented Shelters into the Analysis

Dr. Haston laid out one scenario where a rescue oriented shelter in the community took all dogs in when it had room and the animal control shelter had a 90% live release rate. In a second scenario, Dr. Haston assumed the animal control facility had a 95% live release rate and the rescue oriented shelter in the community did not accept the least adoptable dogs (i.e. the dogs an animal control shelter with an 85% live release rate would kill). In the real world, the rescue oriented shelter’s intake policy almost always is more similar to scenario 2 than scenario 1 since most of these organizations pick and choose which dogs they take in. While some of the qualitative results of the first scenario compared to the second scenario make sense (i.e. the animal control shelter in scenario 2 will have a longer average length of stay and higher operating costs than the animal control facility in scenario 1), the actual model’s results do not match reality.

The table below compares Dr. Haston’s animal control shelter’s predicted results under scenario 2 with successful no kill animal control shelters. All three no kill animal control shelters have selective admission rescue oriented shelters in their areas. Therefore, they are operating in a similar scenario to Dr. Haston’s model. As you can see, Dr. Haston’s model predicts an average length of stay 6-14 times longer than these shelters’ average lengths of stay. Similarly, the no kill animal control shelters pulled in 3-5 times more revenue per dog, incurred 40%-73% lower costs per dog and took in more dogs than Dr. Haston’s model shelter did. Thus, Dr. Haston’s model becomes even more absurd after he incorporates rescue oriented shelters.

So how did Dr. Haston calibrate his model to real world results? He contacted 100 no kill shelters across the country about accepting a large dog with behavioral issues and almost all of the facilities did not agree to take the dog in. Since Dr. Haston did not say which shelters these were, I assume these were selective admission shelters. Given we already know selective admission shelters cherry pick their animals, including those near the three no kill animal control shelters above, this is meaningless.

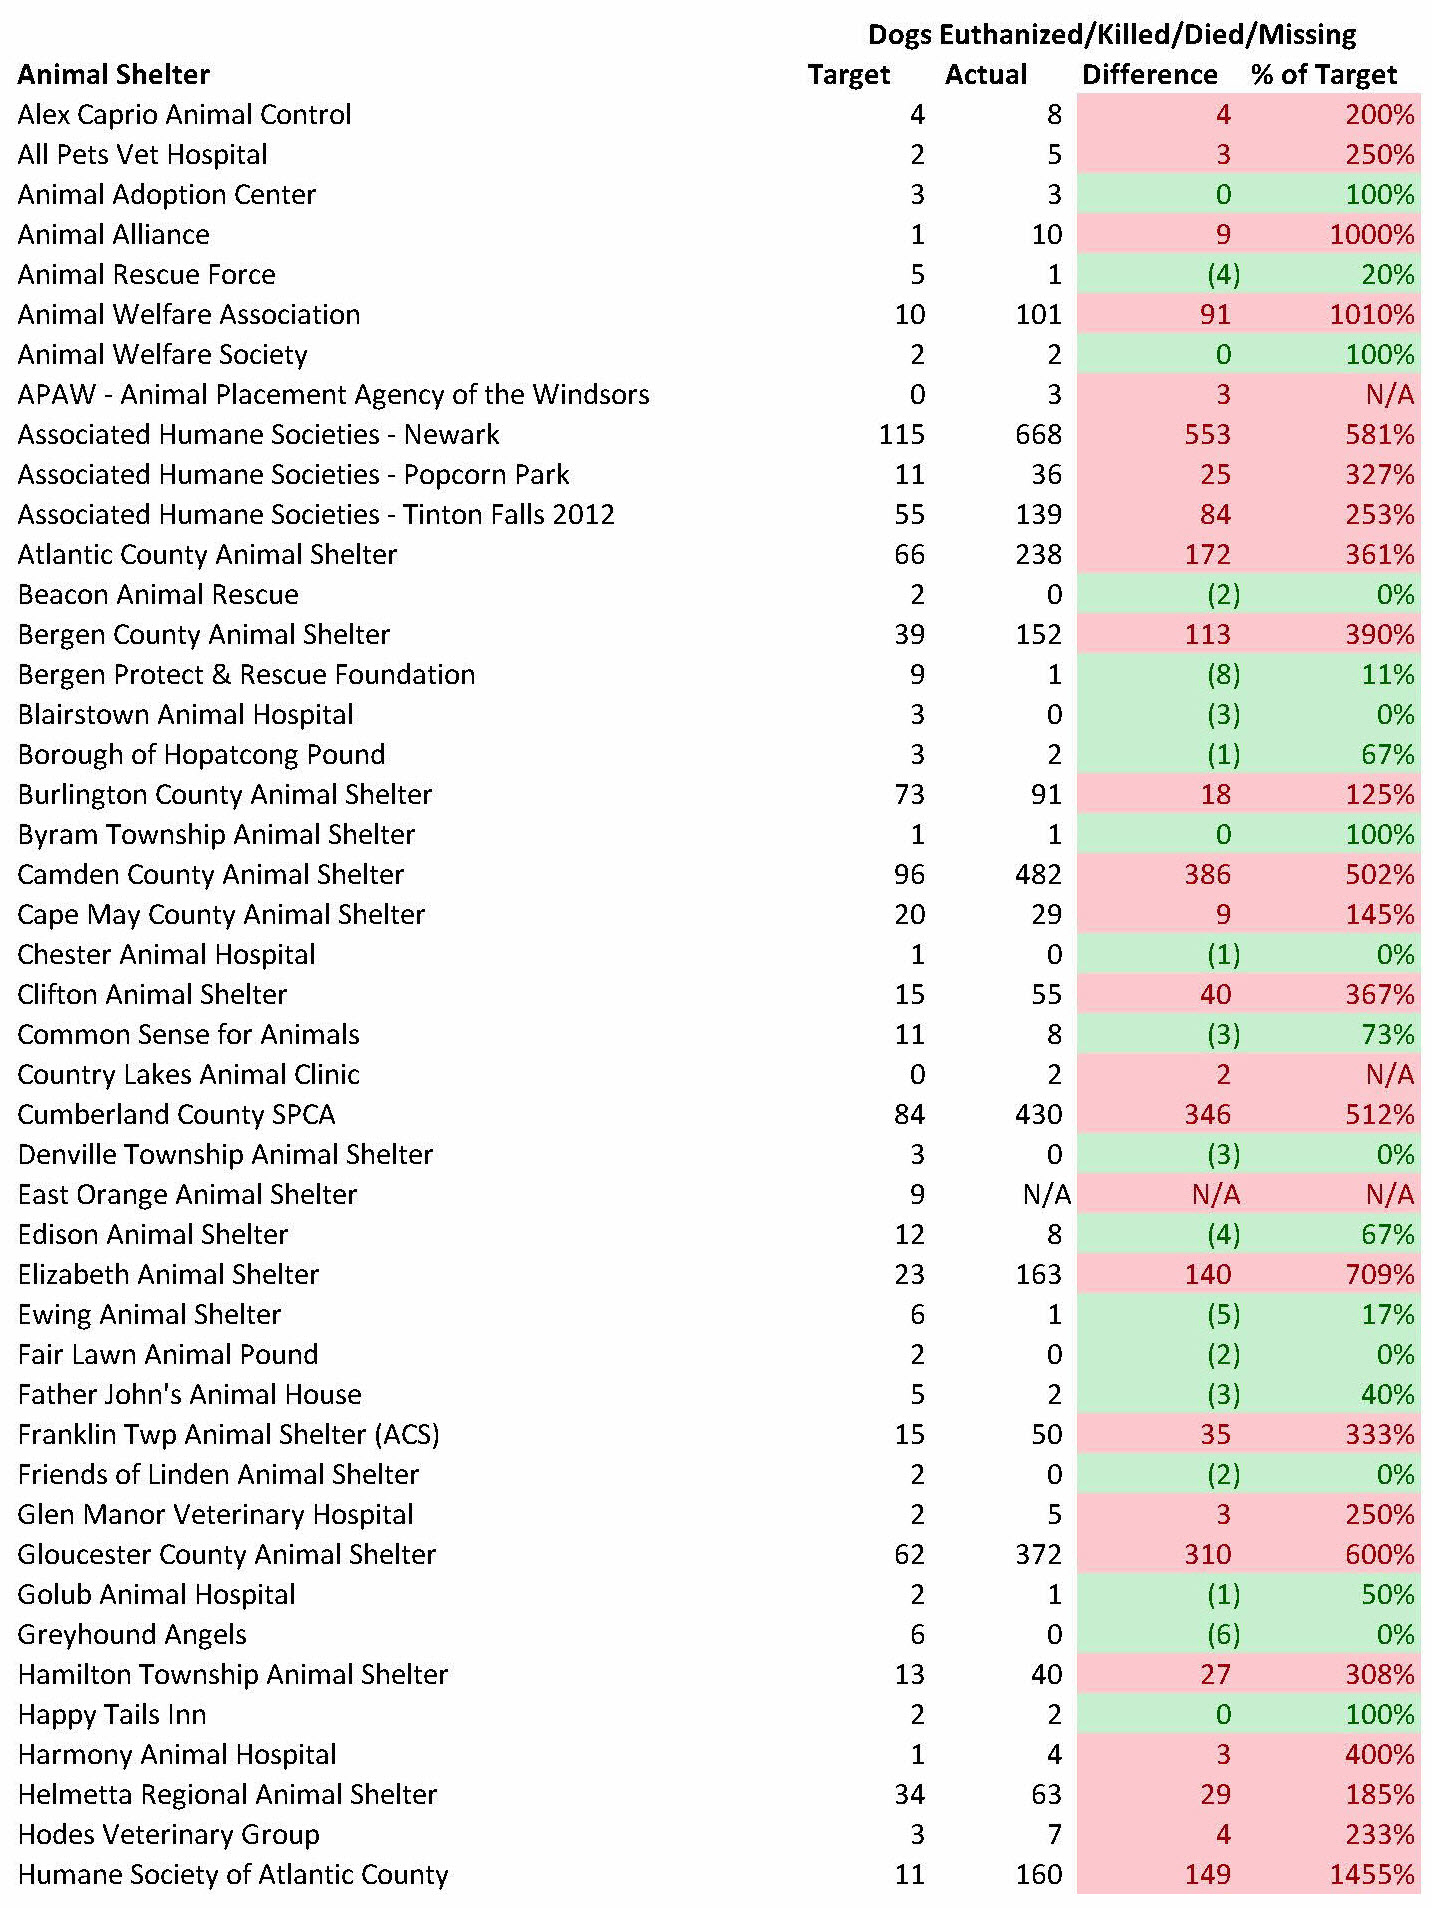
If that was not bad enough, Dr. Haston used his favorite punching bag, pit bulls, at a regressive shelter to validate his model. In a slide titled “Concentration of Difficult Animals in Open Admission Facilities”, Dr. Haston cited pit bulls making up 45% of dog intake and around 25%-30% of dogs killed at Milwaukee Area Domestic Animal Control Commission (MADACC) as evidence supporting his model’s results. First, Dr. Haston citing pit bulls as “difficult” tells you much about his attitude about these animals. While dogs having a pit bull label do stay longer at shelters, a peer-reviewed scientific study proves removing breed labels significantly reduces pit bulls lengths of stay at shelters. Second, MADACC is a regressive shelter that had 21% of their dogs lose their lives last year and 32% of dogs lose their lives in 2014 (one year after Dr. Haston’s MADACC data goes up to). For example, the Wisconsin Watchdog blog detailed the shelter needlessly killing a “pit bull mix” with a potential adopter waiting in 2014. Does anyone in their right mind think this shelter was doing all it could do five years ago? Thus, the idea that rescue oriented shelters put an unfair burden on animal control shelters and that forces them to kill is absurd.

Dystopian Conclusions

Dr. Haston makes a good point that the live release rate is a key metric, but we must also look at other data as well. I fully agree with this. For this reason, my dog report card blog each year also grades shelters on the number of local animals (which often require more effort to save) these facilities take in and adopt out. Additionally, the no kill and animal welfare movements should also create other metrics of success to ensure shelters follow all parts of the No Kill Equation. That being said, the live release rate will always be extremely important given killing animals is intolerable.

Unfortunately, Dr. Haston repeats the false notion that raising the live release rate from 85% to 95% results in longer lengths of stay, increased costs and refusing animals. While I know some shelters do severely restrict intake in order to raise their live release rates, that is not what well-run no kill animal control shelters do. As the three no kill animal control shelters’ data above showed, large no kill animal control shelters take many dogs in, save around 95% or more of these animals and do so in a financially responsible way. Can a shelter have a shorter average length of stay and lower costs if it settles for an 85% live release rate and quickly kills every challenging dog? Yes, that is likely. However, the three no kill animal control shelters’ data above prove you can still achieve a very short average length of stay and have manageable costs at a 95% or above dog live release rate. Additionally, no kill animal control shelters’ revenue surge when the public realizes these facilities are doing everything possible to save their animals. Thus, Dr. Haston’s thunderous conclusions about doom and gloom for animal control shelters achieving around 95% live release rates are wrong.

Most disturbing, Dr. Haston describes an “optimal” live release rate where killing is not only acceptable, but desirable. In essence, Dr. Haston says we should quickly kill “difficult” animals, such as pit bulls, and take in more easy to adopt dogs. In other words, shelters should operate more like pet stores instead of doing the necessary work to save “difficult” animals. While Dr. Haston doesn’t explicitly state this in his presentation, he did say “we can’t adopt our way out of” the so-called pit bull problem in a presentation he recently gave. Furthermore, Dr. Haston’s 2015 presentation stated saving more lives may mean sacrificing the individual.

Sadly, Dr. Haston’s myopic view need not be true. While shelters will adopt out more easy to adopt dogs all else being equal, all else is not equal. As the no kill movement spreads, the innovative policies will spur positive change in many organizations. As organizations improve, they will responsibly reduce dog intake, increase live outcomes and therefore rescue more at risk animals. By contrast, Dr. Haston’s narrow view only allows shelters to increase adoptions by having easy to adopt animals. That is a recipe for stagnation.

What happens when shelters run out of these easy to adopt animals in the future? Apparently, they may work with “responsible breeders.” According to a recent Animal Farm Foundation Facebook live video (starting at 11:00 minute mark), the 2019 HSUS Animal Expo conference had a session on doing just this. Specifically, shelters would have “responsible breeders” breed desirable dogs for “gold level adopters” since the shelters would be filled with those “difficult” to adopt dogs “nobody wants” like pit bulls. While I can’t say Dr. Haston supports this, it is a logical extension of his kill the “difficult” dogs and adopt out the easy dogs philosophy.

At the end of the day, Dr. Haston’s and many so-called shelter leaders’ anti-no kill views are based on a deeply flawed model. Not only do the model’s conclusions violate basic ethical values, the actual quantitative predictions fall apart when we compare them to well-run no kill animal control shelters. Clearly, no organization should consider this a prediction of what real no kill sheltering looks like. Instead, shelters should consider the model useful if they attempt to implement no kill the wrong way. If that happens, then the model could show what will happen. However, Dr. Haston does not present his model this way and declares no kill/high live release rates a disaster. Sadly, Dr. Haston’s messaging ruins what could be a very good way to illustrate the perils of not implementing no kill the right way. As a result, Dr. Haston’s model will be used by lazy shelter directors to defend the status quo and not improve.

Appendix – No Kill Animal Control Data Used in Comparison to Dr. Haston’s Model

KC Pet Project 2017 Animal Data

KC Pet Project 2016 Dog Average Length of Stay (2017 data not available, but unlikely to differ significantly)

KC Pet Project 2017 Form 990 Tax Return

Williamson County Animal Shelter 2017-2018 Animal Data, Dog Average Length of Stay and Financial Information

Lynchburg Humane Society 2016 Animal Data

Lynchburg Humane Society 2016 Dog Average Length of Stay

Lynchburg Humane Society 2016 Form 990 Tax Return

Maddie’s Fund Financial Management Tool to Estimate Cost to Care for Dogs

Passaic’s Pitiful Animal Shelter

In 2004, Passaic Animal Shelter banned its volunteer group for allegedly “violating a number of policies.” However, the volunteers, who were also known as Helping Hands Passaic, also complained about the facility’s poor conditions and unnecessary killing. Therefore, Passaic Animal Shelter, like many regressive facilities, banned the volunteers in order to protect themselves at the expense of the animals.

The New Jersey Department of Health vindicated the volunteers after it issued a scathing inspection report later that year. The inspection report’s key findings were as follows:

  1. Illegal killing of stray cats during the seven day hold period
  2. Inadequate isolation of a kitten with ringworm
  3. Several cats and dogs did not have access to water
  4. Two outdoor dog runs had metal pipes with rusty and sharp edges that could cause serious injuries
  5. Improper food storage, including cleaning solution spilled on dog food bags
  6. Improper record keeping
  7. No required inspection performed by the Passaic Health Department
  8. An animal control officer left an opossum in a vehicle for two hours in 107 degree temperatures

After the inspection, the NJ SPCA issued three summonses to shelter staff for needlessly killing the stray cats during the seven day hold period and leaving the opossum in the hot vehicle. Despite this horrific treatment of animals, one of the charged staff, Marilyn Comerford, stayed on as the Animal Control Officer for 10 more years until she retired in 2014. Even worse, the City of Passaic honored Ms. Comerford, who also was the shelter manager, “for her years of dedication and service.”

How does the Passaic Animal Shelter perform today? Is the shelter a refuge for homeless animals or a place where they go to die?

Passaic Runs a High Kill Shelter

Passaic Animal Shelter killed many dogs at its shelter in 2016.  You can view the actual records here. Overall, 22% of all dogs who were impounded in 2016 lost their lives at the Passaic Animal Shelter. If we just count the dogs not reclaimed by owners (i.e. dogs the shelter had to find new homes for), 39% of all the dogs Passaic Animal Shelter took in during 2016 were killed or died. In other words, more than one out of three dogs Passaic Animal Shelter had to find new homes for lost their lives.

Passaic Animal Shelter killed large numbers of pit bulls. Of the 86 pit bulls arriving at Passaic Animal Shelter in 2016, 33 or 39% of these animals lost their lives. If we just count pit bulls Passaic Animal Shelter had to find new homes for, 58% of these dogs lost their lives. Thus, Passaic Animal Shelter operated more like a pit bull killing factory than a shelter for pit bulls.

While Passaic Animal Shelter’s live release rate appeared good for small dogs and other non-pit bull like dogs, it still killed too many of these animals. 10% of small dogs and 13% of other non-pit bull like dogs impounded during 2016 and not reclaimed by owners lost their lives. As a comparison, the Elizabeth Animal Shelter, which is not a role model shelter, only euthanized 2% of nonreclaimed small dogs and 6% of nonreclaimed medium-large sized breeds other than pit bulls in 2016. Thus, Passaic Animal Shelter killed too many small dogs and medium to large sized non-pit bull like dogs.

Passaic Animal Shelter adopted out hardly any dogs. Of the 170 dogs arriving at Passaic Animal Shelter in 2016, the facility adopted out just 8 dogs or 5% of the dogs it took in. To put it another way, the shelter adopted out just 1 dog every 1.5 months. Frankly, a single person could foster and adopt out more dogs than the Passaic Animal Shelter did last year. Given this tiny number of dog adoptions, is it any wonder why the shelter kills so many dogs?

Passaic Animal Shelter 2016 Dog Statistics

Passaic Animal Shelter also killed large numbers of cats. You can read the actual records here. Overall, 48% of the 292 cats who were impounded during 2016 lost their lives. 45% of neonatal kittens (under 6 weeks old), 43% of older kittens (6 weeks to under 1 year) and 58% of adult cats (1 year and older) failed to leave the shelter alive. Simply put, Passaic Animal Shelter performed terribly for all types of cats.

Austin Animal Center in Texas proves Passaic Animal Shelter can save all of its healthy and treatable cats. Only 5% of all cats, 7% of cats 1 year and older, 3% of kittens aged 6 weeks to just under 1 year and 5% of kittens under 6 weeks lost their lives or went missing at Austin Animal Center in 2016. In other words, the death rate at Passaic Animal Shelter was 8 to 14 times greater for cats of various ages. Therefore, despite Passaic Animal Shelter impounding far fewer cats than Austin Animal Center in total and on a per capita basis, Passaic Animal Shelter killed a much higher percentage of these animals.

Passaic Animal Shelter also hardly adopted out any cats. Of the 292 cats entering the shelter in 2016, only 32 cats or 11% were adopted out. In fact, Passaic Animal Shelter only adopted out 1 cat every week and a half. To put it bluntly, the shelter seemed to make little to no effort to adopt out its cats.

Passaic Animal Shelter 2016 Cat Statistics

Austin Animal Center 2016 Cat Statistics

Passaic Animal Shelter’s length of stay data reveals it quickly killed dogs. On average, Passaic Animal Shelter killed all dogs after 18.9 days, pit bulls after 41.9 days, and small dogs after 10.7 days. Only one dog from other breeds was killed making its 103 day length of stay irrelevant.

To make matters worse, Passaic Animal Shelter killed dogs with empty kennels. Based on an equation for determining a shelter’s population, we can estimate the Passaic Animal Shelter’s average dog population during the year. Using the 170 annual dog intake figure and the 19.3 day average length of stay for all dogs, we can estimate Passaic Animal Shelter had on average 9 dogs in its shelter during 2016. The Passaic Department of Health’s June 7, 2016 inspection report (10 dogs at facility) and Passaic Animal Shelter’s 2016 Shelter/Pound Annual Report (7 dogs and 10 dogs at facility on 1/1/16 and 12/31/16) indicate this estimate was reasonable. 9 dogs only represents 3/4 of the shelter’s 12 dog capacity per its 2016 Shelter/Pound Annual Report. Thus, Passaic Animal Shelter killed dogs while other kennels remained empty during the year.

Passaic Animal Shelter 2016 Dogs Length of Stay

Passaic Animal Shelter quickly killed cats and took too long to safely place the other cats. On average, the shelter killed all cats after 23.3 days, neonatal kittens after 20.5 days, older kittens after 29.0 days and adult cats after just 19.5 days. With Passaic Animal Shelter killing so many cats, one would expect the facility to have an easy time adopting out the remainder who should have exhibited few behavioral or medical issues. On average, Passaic Animal Shelter adopted out all cats after 56.9 days, neonatal kittens after 71.7 days, older kittens after 40.0 days and adult cats after 71.8 days. Similarly, Passaic Animal Shelter took 43.4 days to send cats of all ages to rescues with adult cats taking nearly 2 months. As a comparison, Colorado’s Longmont Humane Society, which serves as an animal control shelter, achieved a live release rate of 91% for cats over 4 months of age as well as for kittens 4 months and under with average lengths of stay of just 23 days for the older cats and 27 days for the younger cats in 2016. In other words, cats at Passaic Animal Shelter lost their lives at 5 times the rate as Longmont Humane Society despite Longmont Humane Society impounding more cats and having a 30% lower average length of stay than Passaic Animal Shelter (24.4 days verses 34.6 days).

The shelter also killed cats when empty cages existed. Based on the same equation used for dogs above, Passaic Animal Shelter only had an average population of 28 cats in 2016 compared to a capacity of 35 cats. The Passaic Department of Health’s June 7, 2016 inspection report (25 cats at facility) and Passaic Animal Shelter’s 2016 Shelter/Pound Annual Report (13 cats and 17 cats at facility on 1/1/16 and 12/31/16) indicate this estimate was not too low. While the shelter may have been full during certain kitten season months, the shelter clearly killed cats while empty cages existed in many other parts of the year.

Passaic Animal Shelter 2016 Cats Length of Stay.jpg

Passaic Animal Shelter Fails to Provide Good Reasons for Killing

Passaic Animal Shelter killed most of its dogs for no reason. Overall, Passaic Animal Shelter listed no documented reason in the records provided to me for 69% of the dogs it killed. In other words, the shelter could not even explain why it took these animals’ lives. The shelter listed “aggressive” and “unpredictable” as reasons for 11% of the dogs it killed. Of the remaining reasons for killing dogs, Passaic Animal Shelter reported 8% were for bite cases, 6% were for serious injuries, 3% were for being nervous and 3% had an undisclosed illness.

Passaic Animal Shelter Dogs Killed Reasons

Hazel was an adult pit bull surrendered by her owner to the Passaic Animal Shelter on May 22, 2016. According to the shelter, Hazel had a “good” temperament, was not “aggressive” and had not bitten anyone. Despite this dog being clearly adoptable, Passaic Animal Shelter killed her for no documented reason 12 days later.

D69 Surrender Form

D69 Kennel Card

D69 Euthanasia Record

Kahloua was a 4 year old pit bull surrendered to the Passaic Animal Shelter by her owner on August 1, 2016. Her owner wrote a letter stating the dog was “not aggressive”, was “friendly”, was “happy”, “likes attention”, has “a good appetite” and “likes to play.” The owner also informed the shelter that Kahloua barked a little bit at people at first, but stopped once she got to know them. Despite the owner’s obvious plea to not kill her dog, Passaic Animal Shelter killed Kahloua 18 days later for no documented reason.

D112 Owner Letter to Shelter

Kaholoua.jpg

D112 Kennel Card

D112 Euthanasia Record.jpg

King was a stray adult pit bull picked up at a Burger King on December 21, 2016. Passaic Animal Shelter stated King had a “good” temperament, was not aggressive and was not involved in a bite incident. Despite King being obviously adoptable and arriving at a time of the year when few animals come into animal shelters, Passaic Animal Shelter killed King just 8 days later.

D173 pt 2

D173 Euthanasia Record

Passaic Animal Shelter Kills Cats for No Reasons and Preventable Conditions

Passaic Animal Shelter killed cats using the reasons in the table below. Overall, the shelter most commonly killed cats for no documented rationale. Additionally, the facility often killed cats for exhibiting illnesses, such as Feline Panleukopenia and upper respiratory infections, that it could significantly reduce by vaccinating cats upon intake to the facility, using volunteers to provide enrichment (improves immune response to disease), cleaning the shelter properly, and reducing the animals’ length of stay in a good way. Also, many of the cats with undisclosed illnesses likely had one of these preventable diseases. Thus, Passaic Animal Shelter killed numerous cats for no reasons and preventable causes.

Passaic Animal Shelter Cats Killed Reasons.jpg

Cat C66 was a 1 year old cat surrendered to the Passaic Animal Shelter by its owner on May 23, 2016. After just 11 days, Passaic Animal Shelter killed this cat for no documented reason.

C66 Surrender Form

C66 Euthanasia Record.jpg

Cat C188 was a 4 month old cat picked up a stray on August 25, 2016. Subsequently, the cat was surrendered to the Passaic Animal Shelter by his owner on September 6, 2016. After 21 days, Passaic Animal Shelter killed him and 3 other cats he came in with for having Feline Panleukopenia. Given the 14 day incubation period and the many other cases at Passaic Animal Shelter, it is likely Cat C188 and the other cats he came in with contracted the disease at the shelter.

C188 Intake Record

C188 Surrender Form.jpg

C188 Euthanasia Record.jpg

Frankly, the large number of Feline Panleukopenia cases at Passaic Animal Shelter are disturbing. Shelter medicine experts state shelters can greatly reduce the instances of this disease by vaccinating animals upon intake, housing cats appropriately, and cleaning effectively:

Although a scary and potentially devastating disease in a shelter, reliable vaccination on intake, effective routine cleaning with a parvocidal disinfectant, and housing that minimizes fomite transmission will greatly reduce the risk of spread. With new tools for diagnosis and risk assessment, even outbreaks can generally be managed without resorting to depopulation.

Furthermore, if Passaic Animal Shelter welcomed volunteers, it could treat cats with Feline Panleukopenia by sending these animals to specially trained fosters (technically the shelter has a foster program, but the facility does not promote fostering and few people would be willing to return fostered kittens to a high kill shelter). At these homes, the cats would receive anti-nausea drugs, antibiotics and fluid therapy in an safe environment where they would not infect other animals.

Cat C175 was a stray adult cat taken to the Passaic Animal Shelter on August 17, 2016. After 27 days, Passaic Animal Shelter killed her for being dehydrated, underweight and being icteric (i.e. having jaundice). Since this cat was at the Passaic Animal Shelter for nearly a month, she likely contracted the disease causing these symptoms at the facility.

C175 Kennel Card.jpg

C175 Euthanasia Record.jpg

Veterinarian Contracts Support Killing

Passaic Animal Shelter contracts with Rutherford Animal Hospital to provide veterinary care. On the surface, Rutherford Animal Hospital looks like an excellent choice given it is a large and modern veterinary facility. However, when one looks at the specifics in the contracts, major concerns arise.

Passaic Animal Shelter rarely vaccinates animals upon intake. While Rutherford Animal Hospital vaccinates the shelter’s animals, it visits the shelter as little as twice a week. Since Rutherford Animal Hospital, and not anyone who works at the shelter, vaccinates animals, many dogs and cats, including ones carrying highly contagious diseases, will sit in the facility spreading disease until the outside veterinarian comes to the shelter. The UC Davis Koret Shelter Medicine Program clearly explains why shelters must immediately vaccinate animals to control diseases in their facilities:

When should the vaccine be given?

Immediately upon intake, if not sooner! In almost all cases, shelter animals should be vaccinated immediately upon intake. A delay of even a day or two will significantly compromise the vaccine’s ability to provide protection. In a cost saving effort, some shelters delay vaccination until the animal is made available for adoption, or even until it is adopted. While this does provide a service to adopters, the protective effect of the vaccine within the shelter is greatly reduced or eliminated. (In some cases, the chance of the vaccine preventing disease may be 90% or better if given the day before exposure, but will drop to less than 1% if given the day after exposure.) When possible, vaccination prior to intake is ideal (e.g. for owner surrendered animals or those returning from foster care).

Therefore, Passaic Animal Shelter’s vaccination program is ineffective and this may partially explain why the facility killed so many cats for illnesses and had so many other cats die.

Passaic Animal Shelter’s contract provides details on the veterinary funding it provides. In the City of Passaic’s contract with Rutherford Animal Hospital, Passaic only pays $1,516 per month for veterinary services and $70.82 per month to test the cats it adopts out for FIV testing. Based on the details of the arrangement outlined in Rutherford Animal Hospital’s response to Passaic’s request for proposal, the city will only pay $850 per year for the FIV testing. Therefore, Passaic could pay Rutherford Animal Hospital a maximum of $19,150 per year ($20,000 total fee cap – $850 FIV fee) to provide veterinary care (excluding FIV testing and spay/neuter which adopters pay for) or $41.45 per dog and cat the shelter impounded in 2016.

The City of Passaic’s veterinary funding is inadequate. After we back out the cost of vaccines of approximately $15.53 per animal (based on $21.25 per adult dog, $27.25 per puppy, $9.25 per adult cat and $13.25 per kitten according the Maddie’s Fund’s Financial Management Tool) from the average $41.45 veterinary care fee per animal, Passaic Animal Shelter would have just $25.92 to treat each animal for all other illnesses and injuries. Clearly, that is not nearly enough to treat sick or injured animals. Given this fee also must cover the cost of killing, the city and Rutherford Animal Hospital have strong incentives to kill any animal where veterinary treatment may be costly or might not work. Thus, the contract’s financial terms encourage killing.

Passaic Animal Shelter Veterinary Care Funding.jpg

Rutherford Animal Hospital plays a major role in Passaic Animal Shelter’s high kill operation. Specifically, Rutherford Animal Hospital “makes the final determination of status of animal for adoption, fostering or euthanasia.” In other words, Rutherford Animal Hospital approves all the absurd reasons for killing animals documented in this blog. Sadly, Rutherford Animal Hospital apparently chooses to kill for financial reasons rather than treat the shelter animals like valued clients from its private practice.

Passaic Animal Shelter’s contract with Rutherford Animal Hospital seems to indirectly cap adoptions at a low number. According to the City of Passaic’s contract for spay/neuter services with Rutherford Animal Hospital, it only pays a maximum of $6,000 per year with $80, $55 and $130 fees to spay/neuter each female cat, male cat and dog of either sex. Assuming the shelter used its spay/neuter fees based on the proportions of dogs and cats it took in (i.e. 37% dogs, 63% cats) and altered equal numbers of each sex, it could only spay/neuter 17 dogs and 56 cats. Based on the shelter’s Petfinder web site indicating the adoption fees include spay/neuter and the shelter’s policy and procedure manual indicating all adopted animals must be altered, this suggests the shelter could only adopt out 17 dogs and 56 cats for the entire year. However, Passaic Animal Shelter would need to have adopted out 39 dogs and 148 cats last year to achieve 95% dog and 92% cat live release rates. Thus, Passaic Animal Shelter cannot come close to achieving no kill status based on its contract.

Passaic Animal Shelter Spay & Neuter Contractual Cap.jpg

Despite Rutherford Animal Hospital being required under its contract to maintain legally required euthanasia records, an unusually large number of dogs had weights ending in convenient numbers such as 0 or 5. Under state law, the shelter must weigh each animal prior to killing/euthanizing. If Passaic Animal Shelter only estimated weights, the shelter could have provided the wrong amount of tranquilizing and killing agents to these dogs. Thus, the shelter’s dog euthanasia records raise questions as to whether the facility actually humanely killed/euthanized dogs.

Passaic Animal Shelter Veterinary Records.jpg

Passaic Must Take a New Path

Clearly, Passaic Animal Shelter took action to protect itself at the expense of the city’s homeless animals after volunteers exposed its dirty little secrets more than a decade ago. After banning volunteers, the shelter no longer had anyone to make sure they tried to save lives. Instead, the shelter used its unilateral control to take the easy way out and kill animals needlessly. Why? The shelter’s leadership, within the facility, the Passaic Health Department, and its elected officials, simply found it easier to save a few animals and kill the rest. In fact, Passaic Animal Shelter’s “Animal Control Policy and Procedure Manual” explicitly states it will not run a no kill shelter.

Passaic Animal Shelter has more than enough resources to run a no kill facility where it only euthanizes hopelessly suffering animals. In 2016, Passaic Animal Shelter received $384 of city funding per each of the 462 dogs and cats it impounded. As a comparison, Michigan’s Chippewa County Animal Shelter only received $253 of funding per dog and cat and saved 99.5% of the 398 dogs and 99.2% the 471 cats who had outcomes in 2016. Furthermore, Chippewa County Animal Shelter impounded more animals in total (851 dogs and cats at Chippewa County Animal Shelter verses 462 dogs and cats at Passaic Animal Shelter) and on a per capita basis (22.4 dogs and cats per person at Chippewa County Animal Shelter verses 6.5 dogs and cats per resident at Passaic Animal Shelter). Unlike Passaic Animal Shelter, Chippewa County Animal Shelter welcomes volunteers and operates its facility using no kill methods. Thus, Passaic Animal Shelter has no excuse for running a high kill shelter.

Passaic residents must call newly elected Mayor Hector Lora at 973-365-5510 and make sure the mayor keeps the following promise he made:

This was about leaving a legacy for our children and (setting) an example for all.

Clearly, Passaic must set an example that taking the easy way out and killing homeless animals for convenience is unacceptable. Mayor Lora can leave a legacy for Passaic’s children by turning his shelter around and allowing his constituents and others to help him do so. Teaching children the value of life and hard work is priceless. Let’s help Mayor Lora understand this.

Bergen County Animal Shelter’s No Kill Con Job (Part 1 of 3)

In 2015, Bergen County Executive, James Tedesco, and the Bergen County Board of Chosen Freeholders announced the approval of a resolution recognizing Bergen County Animal Shelter as a “no kill shelter by adopting the Asilomar Accords.” Mr. Tedesco went on to state the following:

As an animal lover, I believe formalizing this designation gives the residents of our county a better understanding of the shelter’s mission and helps us highlight what a great organization this is. Bergen County’s Animal Shelter is not only one of the best public animal shelters in the state, but arguably one of the best in the Northeast.

Furthermore, Bergen County Freeholder, Dr. Joan Voss, gave Bergen County Animal Shelter Director, Deborah Yankow, a “Women of Distinction” award in 2016 for Ms. Yankow’s achievements in “The field of Animal Compassion.”

Is Bergen County Animal Shelter a no kill shelter? Is Bergen County Animal Shelter one of the best public animal shelters in New Jersey and arguably in the Northeast? Should Bergen County Animal Shelter’s Director receive an award for animal compassion?

Asilomar Accords Do Not Equal a No Kill Shelter

The Asilomar Accords were a deeply flawed agreement. In 2004, the regressive shelter establishment, Maddie’s Fund and certain limited admission shelters created the Asilomar Accords to allegedly save more animals in shelters. In general, the Asilomar Accords did not require shelters to adopt any lifesaving programs. However, the Asilomar Accords required members to not criticize each other, even if such criticism was warranted. Additionally, the Asilomar Accords encouraged members to not use terms such as “no kill’ as it was “divisive.”

The Asilomar Accords require members to compile specific animal shelter statistics and report this data to the public each year. Animal shelters must report the numbers of impounded animals each year and the specific outcomes in an “Animal Statistics Table.” Euthanized animals are broken down into “healthy”, “treatable” and “unhealthy-untreatable” categories. Animals are considered “treatable” if a “reasonable and caring pet owner/guardian in the community would provide the treatment necessary to make the animal healthy” or “maintain a satisfactory quality of life.” However, animals that “pose a significant risk to human health or safety or to the health or safety of other animals” are not “treatable” per the Asilomar Accords. Shelters calculate an Asilomar Accords Live Release Rate excluding animals euthanized by request of their owners and classified as “untreatable” and dogs and cats who died or went missing. Shelters must share these statistics with the public by posting on their web site, in newsletters, etc.

The Asilomar Accords statistics often have been exploited by regressive shelters. For example, many poorly run facilities classify large numbers of animals as “untreatable” and then claim they are no kill (i.e. “we don’t euthanize healthy and treatable animals”).

Bergen County Animal Shelter fails to comply with the Asilomar Accords despite the county’s elected leaders claims. Bergen County Animal Shelter does not publicly share its “Animal Statistics Table” on its web site as required by the Asilomar Accords. In addition, Bergen County Animal Shelter is not listed as a participating organization on the Shelter Animals Count web site (current version of the Asilomar Accords data reporting standards). Even worse, Bergen County Animal Shelter fails to explain in its Standard Operating Procedures manual how its definition of “unadoptable” (i.e.”unhealthy-untreatable” per the Asilomar Accords) is consistent with Asilomar Accords requirement that the shelter provide care that a “reasonable and caring pet owner/guardian in the community” would give to the animal. The shelter simply uses a general definition of “unadoptable” for “animals with serious unmanageable health problems, or an aggressive bite history toward humans or other animals, or who exhibit unmanageable antisocial behavioral characteristics.” To fully comply with the Asilomar Accords, Bergen County Animal Shelter needs to state what specific health problems are “unmanageable” and why “a reasonable and caring pet owner/guardian” in Bergen County would not provide that care. Given Bergen County is in the top 1% of the wealthiest counties in the country, most residents would provide lots of care to their pets before deciding to euthanize a beloved family member. Thus, Bergen County Animal Shelter fails to comply with the weak and traditional shelter friendly Asilomar Accords.

Statistics Reveal Bergen County Animal Shelter is a High Kill Shelter

Bergen County Animal Shelter’s 2015 “Shelter Pound Annual Report” proves the shelter is far from a “no kill” facility. In 2015, 24% of dogs and 28% of cats were killed, died or went missing. Specifically, Bergen County Animal Shelter reported killing 166 dogs and 561 cats. On average, Bergen County Animal Shelter kills 2 dogs and cats each day of the year. The animal welfare community generally requires a shelter to achieve a 90% or greater live release rate to call itself no kill. However, no kill leader, Nathan Winograd, who created the 90% test, recently raised the standard to achieve higher live release rates. Clearly, Bergen County Animal Shelter’s 2015 reported statistics prove Bergen County Animal Shelter is a high kill shelter and not a no kill facility.

Bergen County Animal Shelter 2016 Shelter Pound Annual Report

Bergen County Animal Shelter’s 2015 statistics in its Asolomar Accords format were different from its 2015 Shelter/Pound Annual Report. While Bergen County Animal Shelter does not publicly report its Asilomar Accords Animal Statistics Table, I obtained each month’s table from 2015 under the New Jersey Open Public Records Act (“OPRA”) and tabulated the totals below. Bergen County Animal Shelter reported taking in significantly fewer cats in the Asiolmar Accords format. Similarly, Bergen County Animal Shelter reported fewer cats reclaimed by owners and more cats adopted, killed and died in the Asilomar Accords Animal Statistics Table. The shelter also reported taking in significantly more dogs in the Asilomar Accords Statistics Table. Furthermore, Bergen County Animal Shelter disclosed significantly more dogs who were killed in the Asilomar Accords Statistics Table. Additionally, a number of various other outcomes were different. Thus, Bergen County Animal Shelter reported different statistics in the two reporting formats indicating the numbers in one of the reports were incorrect.

2015 Bergen Asilomar Stats.jpg

Bergen County Animal Shelter’s Underlying Records Reveal Much Higher Kill Rates

In order to better understand the Bergen County Animal Shelter’s performance, I obtained the facility’s 2015 intake and disposition records under OPRA. Bergen County Animal Shelter sent me shelter software reports listing each dog and cat the shelter impounded in 2015, its outcome and its intake and outcome dates.

I tabulated all of this data and recalculated Bergen County Animal Shelter’s statistics. While the intake numbers are calculated the same way as the Shelter/Pound Annual Report above (i.e. all animals impounded in 2015), the outcome numbers are calculated slightly differently. In the Shelter/Pound Annual Report, only 2015 outcomes are counted. This could include animals impounded in 2014 who were subsequently adopted or killed in 2015. On the other hand, my data counts the animals who were impounded in 2015 and had outcomes in 2015 and 2016. However, the outcomes should be close as both methods calculate outcomes over a 12 month period and the overwhelming number of ultimate outcomes occur in the year the animals were impounded in.

The table below summarizes Bergen County Animal Shelter’s 2015 statistics using the shelter’s underlying records. The total number of impounded cats is significantly different than the “Shelter/Pound Annual Report.” The “Shelter/Pound Annual Report” had 578 more cats than the underlying records. Apparently, much of the difference is due to Bergen County Animal Shelter reporting more cats that the shelter neutered and released in its “Shelter/Pound Annual Report.” In a recent article, Bergen County Animal Shelter Director, Deborah Yankow, stated the shelter neutered and released 788 cats in 2015, which accounts for much of the difference between the 852 cats reclaimed per the Shelter/Pound Annual Report and the 71 cats reclaimed per the underlying records. However, the underlying records have a “Release” outcome as well and the shelter only recorded only 122 cats in this category. It is unclear to me whether that represents cats who were trapped, neutered and released or cats released to their owners. Thus, it seems Bergen County Animal Shelter overstated the number of cats that were trapped, neutered and released in its 2015 Shelter/Pound Annual Report or failed to record hundreds of these cats in its records as required by N.J.A.C. 8.23A-1.13.

The total numbers of impounded dogs and dogs killed are significantly different than the corresponding figures in the Shelter/Pound Annual Report. Specifically, the “Shelter Pound Annual Report” reported 104 fewer impounded dogs during 2015. Apparently, this is primarily due to Bergen County Animal Shelter excluding 103 dogs classified as owner-requested euthanasia from the Shelter Pound Annual Report’s total dogs taken in and killed figures. Thus, Bergen County Animal Shelter’s Shelter Pound/Annual Report clearly is incorrect.

Bergen County Animal Shelter’s intake and disposition records revealed it killed many more cats and dogs than it reported in its 2015 Shelter/Pound Annual Report. Specifically, Bergen County Animal Shelter reported killing 58 more cats and 97 more dogs in its underlying records than its Shelter/Pound Annual Report.

Additionally, Bergen County Animal Shelter reported sending 52 fewer cats and 54 fewer dogs to rescues in its intake and disposition records compared to its Shelter/Pound Annual Report. Most of the other outcome categories in the underlying records and the Shelter/Pound Annual Report were reasonably close.

Overall, Bergen County Animal Shelter’s intake and disposition records revealed a far higher death rate than that reported in its 2015 Shelter/Pound Annual Report. 42% of cats were killed, died or went missing per the facility’s underlying records compared to just 28% of cats per data from Bergen County Animal Shelter’s Shelter/Pound Annual Report. Similarly, 33% of dogs were killed, died or went missing per the facility’s underlying records compared to just 24% of dogs per data from Bergen County Animal Shelter’s Shelter/Pound Annual Report. Thus, Bergen County Animal Shelter’s underlying records reveal far more animals are losing their lives at this self-described “no kill shelter.”

Bergen County Animal Shelter’s death rate for animals actually requiring sheltering is even higher. Since Bergen County Animal Shelter serves a very wealthy county, most stray dogs have licenses and/or microchips allowing the shelter to quickly return these dogs to their owners. While the cat owner reclaim rate is low, it is still significantly higher than the nationwide cat owner reclaim rate. If we calculate the death rate based off animals not reclaimed by owners, which are the ones the shelter has to work to save, 44% of cats and 49% of dogs lost their lives. Thus, nearly half of all dogs and cats requiring any amount of real work lose their lives at this so-called “no kill shelter.”

Bergen County Animal Shelter also reported large owner-requested euthanasia figures. Specifically, the shelter’s records indicated owner-requested euthanasia represented 3% and 12% of all impounded cats and dogs. If we just count animals surrendered by their owners, Bergen County Animal Shelter classified 15% of cat and 32% of dog owner surrenders as owner requested euthanasia. While the cat numbers seem a bit high, the dog numbers are off the charts. The shelter asserts that nearly 40% of the dogs killed and around 1 of 3 dogs surrendered by their owners are owner requested euthanasia. Given Bergen County Animal Shelter largely serves a wealthy area, I find the number of dogs requested by their owners to be euthanized suspicious. I’m also concerned since some shelters coerce people to sign owner-requested euthanasia forms. Thus, Bergen County Animal Shelter’s large owner-requested euthanasia figures raise major red flags.

Even if we exclude owner-requested euthanasia, 40% and 23% of all cats and dogs lost their lives at Bergen County Animal Shelter in 2015. If we exclude owner-requested euthanasia from the non-reclaimed animal death rate, 41% and 37% of all non-reclaimed cats and dogs lost their lives at Bergen County Animal Shelter in 2015. Thus, Bergen County Animal Shelter is still a high kill shelter even if we exclude owner-requested euthanasia.

Bergen 2015 Intake and Disposition Records Summary (3)

Bergen County Animal Shelter’s length of stay data reveals much about the shelter’s operation. On average, the shelter kills cats and dogs after 20 days and 16 days. However, these figures, particularly for dogs, are heavily influenced by the large number of owner surrendered animals that the shelter kills immediately. As expected, owner reclaimed animals go home quickly (10 days for cats and 3 days for dogs). On the other hand, the shelter takes way too long to adopt out cats (66 days) and dogs (47 days) particularly given the types of animals it adopts out (i.e. few challenging animals make it to the adoption floor due to the high kill rate).Bergen County Animal Shelter LOS All Dogs and Cats

Bergen County Animal Shelter’s length of stay data indicates the shelter kills with empty kennels. Based on standard animal shelter population equations, we can estimate the average number of animals at the shelter during the year as follows:

Daily capacity or population = Daily animal intake x average length of stay

Therefore, based on the shelter’s reported animal intake and average length of stay, we can estimate the facility housed 219 cats and 56 dogs on average during 2015. Based on these estimates and the shelter’s capacity disclosed in its 2015 Shelter/Pound Annual Report, Bergen County Animal Shelter only used roughly 2/3 of its available animal holding space on average during 2015. Thus, Bergen County Animal Shelter clearly kills dogs and cats when the shelter has room to house those animals.

Bergen County Animal Shelter 2015 Capacity Used

Adult Dogs and Cats Killed at an Alarming Rate

Bergen County Animal Shelter’s statistics are far worse when we focus on animals the shelter labels as “adult.” Generally speaking, the shelter classified cats and dogs over 1 year old as “adult”, but there were a few classification errors (i.e. older dogs classified as “adult”). However, the number of these animals were not large enough to significantly impact the outcomes below. 54% of adult cats and 36% of adult dogs were killed or died. Similarly, 59% of non-reclaimed adult cats and 54% of non-reclaimed adult dogs were killed or died per the facility’s underlying records. In other words, more than half of adult cats and dogs requiring actual sheltering lost their lives at this so-called “no kill shelter.”

Even if we exclude owner-requested euthanasia, 51% and 25% of all adult cats and dogs lost their lives at Bergen County Animal Shelter in 2015. If we exclude owner-requested euthanasia from the non-reclaimed animal death rate, 55% and 41% of all non-reclaimed adult cats and adult dogs lost their lives at Bergen County Animal Shelter in 2015. Thus, Bergen County Animal Shelter’s underlying records reveal this self-proclaimed “no kill shelter” kills tremendous numbers of adult cats and dogs.

Bergen Adult Animals 2015

Bergen County Animal Shelter’s adult animal length of stay data revealed the shelter killed adult dogs and cats quickly and took too long to adopt out these animals. Specifically, Bergen County Animal Shelter killed adult cats and dogs after just 18 days and 15 days, respectively. In other words, the shelter generally seemed to make little effort to rehabilitate animals. Furthermore, the shelter took 74 days and 50 days on average to adopt out each adult cat and dog. These figures are even worse considering these are likely very adoptable animals since the shelter kills virtually all animals with any significant issues.

Bergen Adult Animals LOS

Pit Bulls Killed in Droves

Bergen County Animal Shelter kills pit bull like dogs at an astounding rate. 50% of all pit bull like dogs lost their lives at Bergen County Animal Shelter in 2015. Even worse, 67% of non-reclaimed pit bull like dogs were killed or died at Bergen County Animal Shelter in 2015. If we exclude owner-requested euthanasia, Bergen County Animal Shelter still killed 47% of its pit bulls and 64% of its pit bulls not reclaimed by owners. Thus, Bergen County Animal Shelter kills around half of all its pit bull like dogs and around two thirds of those pit bull like dogs requiring actual sheltering.

Bergen County Animal Shelter kills most of its adult pit bull like dogs. 61% of adult pit bull like dogs lost their lives at Bergen County Animal Shelter in 2015. In fact, 83% of non-reclaimed adult pit bull like dogs were killed or died at Bergen County Animal Shelter in 2015. Even if we exclude owner-requested euthanasia, the shelter killed 58% of its adult pit bulls and 81% of its adult pit bulls not reclaimed by owners. As a result, adult pit bull like dogs virtually have no chance of making it out alive of the so-called “no kill” Bergen County Animal Shelter.

Bergen Pit Bull Data

Bergen County Animal Shelter’s poor performance is exemplified by its pit bull length of stay data. While Bergen County Animal Shelter’s average length of stay of 36 days for all pit bulls is reasonable, the actual details uncover the true story. The shelter’s average length of stay is relatively low due to owners reclaiming and Bergen County Animal Shelter killing many pit bulls. Of course, we want owners to reclaim their lost pets. However, Bergen County Animal Shelter’s respectable number of reclaimed pit bulls is due mostly to the relatively wealthy people in its service area obtaining licenses and microchips (i.e. making it easy for the shelter to find the owner). On the other hand, Bergen County Animal Shelter kills its pit bulls relatively quickly (26 days on average). These two factors mask the horrendously long time it takes to adopt out pit bulls (73 days for all pit bulls, 115 days for adult pit bulls). As a comparison, data from recent years showed no kill animal control shelters adopting out pit bull like dogs within around 20-40 days. Given the pit bulls Bergen County Animal Shelter adopts out are likely easier to place (i.e. Bergen County Animal Shelter quickly kills many of the types of pit bulls these other shelters spend time to rehabilitate), this performance is even more disappointing. Thus, Bergen County Animal Shelter quickly kills its pit bulls and takes way too long to adopt out the few pit bulls it allows to live.

Bergen Pit Bulls LOS

Small Dogs Are Not Safe at Bergen County Animal Shelter

At most New Jersey animal shelters, small dogs fly out the door to rescues and adopters. For example, Perth Amboy Animal Shelter, which has little space and serves a poor area, saved 97% of 116 small dogs it took in during 2014 and the first half of 2015 per records I reviewed last year. Even the regressive Elizabeth Animal Shelter saved 95% of the 144 small dogs it impounded in 2015. Thus, “no kill” shelters should save 95% or more of the small dogs they take in.

Bergen County Animal Shelter’s killing even extends to large numbers of small dogs. 26% of all small dogs lost their lives at Bergen County Animal Shelter in 2015. Even worse, 39% of non-reclaimed small dogs were killed or died at Bergen County Animal Shelter in 2015. Additionally, the shelter labeled an extraordinary large number of these dogs as “owner-requested euthanasia”, which raises questions about whether these animals were truly hopelessly suffering. If we exclude owner-requested euthanasia, Bergen County Animal Shelter still killed 14% of its small dogs and 24% of its small dogs not reclaimed by owners. Thus, Bergen County Animal Shelter fails to achieve “no kill” status even for small dogs.

Bergen Small Dog Data.jpg

Bergen County Animal Shelter’s length of stay data shows how poorly the facility handles small dogs. Overall, Bergen County Animal Shelter killed small dogs after just 10 days on average. On the other hand, Bergen County Animal Shelter took an astonishingly long 42 days on average to adopt out its small dogs. As a comparison, Perth Amboy Animal Shelter took 14 days on average to adopt out its small dogs based on data from 2014 and the first half of 2015. Similarly, Elizabeth Animal Shelter took 5 days on average to safely get non-reclaimed small dogs out of the shelter in 2015. Thus, Bergen County Animal Shelter quickly killed small dogs and took way too long to adopt out these highly desirable animals.

Bergen Small Dogs LOS

Wildlife Slaughtered

Bergen County Animal Shelter killed wildlife at an alarming rate. Based on over 450 records of wild animals I reviewed, 46% of all wild animals impounded during 2015 lost their lives. In fact, this figure would be even higher if I counted the many animals who died on their way to Bergen County Animal Shelter after being picked up by the shelter’s animal control officers.

Bergen County Animal Shelter’s wildlife kill rate was much higher for some species. Specifically, Bergen County Animal Shelter killed 65%, 62% and 69% of all the opossums, raccoons and skunks it impounded during 2015. While raccoons and skunks are considered “rabies vector species”, it is virtually impossible that most of these animals were exhibiting signs of the disease or bit someone. Furthermore, the shelter killed a similar percentage of opossums, which are not rabies vector species. Thus, Bergen County Animal Shelter appeared quite content to kill common wildlife species without even sending the animals to a wildlife rehabilitation facility.

Bergen Wildlife 2015

Clearly, Bergen County Animal Shelter is a high kill shelter rather than a “no kill” facility. Despite Bergen County’s highest elected officials boasting, the shelter kills large numbers of all types of animals and the Director does not deserve any award for “animal compassion.”

In Part 2 of this series of blogs, I will examine the reasons why Bergen County Animal Shelter kills large numbers of animals.

Elizabeth’s Enigma of an Animal Shelter (Part 2 of 2)

In my last blog, I discussed the recent history of the Elizabeth Animal Shelter. Specifically, I wrote about how the shelter’s illegal killing of Jennifer Arteta’s two dogs, Daphne and Rocko, during the 7 day hold period in June 2014 sparked an effort to reform the Elizabeth Animal Shelter. Additionally, I analyzed the shelter’s 2015 statistics to see if the changes the shelter made improved the plight of animals entering the Elizabeth Animal Shelter. To read Part 1 of this blog, please click this link.

Part 2 of this blog analyzes Elizabeth Animal Shelter’s compliance with New Jersey shelter laws. This blog also examines the shelter’s recent actions. Finally, I provide an answer to the question as to whether the Elizabeth Animal Shelter still needs reform.

Elizabeth Animal Shelter Illegally Kills Massive Numbers of Animals Prior to the End of the 7 Day Hold Period

Elizabeth Animal Shelter illegally killed animals during the 7 day hold before and after the illegal killing of Daphne and Rocko. Despite Daphne being playful and Rocko loving to cuddle, Elizabeth Animal Shelter wrote “aggressive” on their intake and disposition records and killed them on the day the two dogs arrived at the shelter. Under New Jersey shelter law, shelters cannot kill any animal, whether stray or surrendered by their owners, until after 7 full days. Elizabeth Animal Shelter illegally killed 48 dogs and 35 cats in 2014 prior to the end of the 7 day hold period. To put it another way, Elizabeth Animal Shelter illegally killed 49% of the dogs and 85% of the cats it killed in 2014. In fact, Elizabeth Animal Shelter illegally killed 25 dogs and 14 cats in 2014 after News 12 New Jersey reported Elizabeth Animal Shelter’s illegal killing of Daphne and Rocko. Even worse, Elizabeth Animal Shelter resumed the illegal killings less than a month after the News 12 story came out and the related uproar. Thus, Elizabeth Animal Shelter thumbed its nose at animal advocates, state law and all Elizabeth pet owners.

Elizabeth Animal Shelter continued to illegally kill animals during the 7 day hold period in 2015. Elizabeth Animal Shelter illegally killed 28 dogs and 96 cats during the 7 day hold period in 2015. To state it another way, Elizabeth Animal Shelter illegally killed 53% of the dogs and 86% of the cats it killed in 2015. In addition, Elizabeth Animal Shelter killed 9 of those dogs and 5 of those cats after the New Jersey Department of Health issued a memo on October 20, 2015 reminding all shelters that it is illegal to kill animals during the 7 day hold period. Under New Jersey law, shelters technically can’t kill animals who are hopelessly suffering during the 7 day hold period, but the New Jersey Department of Health generally does not go after shelters if a veterinarian documents the animal was hopelessly suffering in a detailed manner. While Elizabeth Animal Shelter labeled some animals as “sick” or “medical euthanasia”, the city provided no veterinary records proving these animals were in fact hopelessly suffering. Thus, Elizabeth Animal Shelter illegally killed even more animals in 2015 than 2014.

You can find all the intake and disposition records for 2014 here and for 2015 here.

Elizabeth Animal Shelter Illegally Adopts Out and Sends Stray Animals to Rescues During the 7 Day Hold Period

Elizabeth Animal Shelter illegally adopted out and sent large numbers of dogs and cats to rescues during the 7 day stray/hold period in 2014. Under New Jersey shelter law, shelters must hold stray animals for 7 days prior to adopting those pets out or sending them to rescues. The law is designed to provide pet owners a reasonable opportunity to find their animals. In 2014, Elizabeth Animal Shelter adopted out/transferred to rescues 21 stray dogs and 120 stray cats during their stray/hold periods. 13% and 36% of all dogs and cats Elizabeth Animal Shelter adopted out/sent to rescues were done so illegally in 2014. Thus, Elizabeth Animal Shelter violated the 7 day stray hold period on a massive scale in 2014.

Elizabeth Animal Shelter continued to illegally adopt out and send large numbers of animals to rescues during the 7 day hold period in 2015. In 2015, Elizabeth Animal Shelter illegally adopted out/transferred to rescues 30 dogs and 75 cats. 14% and 25% of all dogs and cats Elizabeth Animal Shelter adopted out/sent to rescues were done so illegally in 2015. In fact, Elizabeth Animal Shelter illegally killed or adopted out/sent to rescues 106 of 171 stray cats or 62% of these animals during the 7 day stray/hold period in 2015. Similarly, Elizabeth Animal Shelter illegally killed or adopted out/sent to rescues 35 out of 209 stray dogs or 17% of these animals during the 7 day stray/hold period in 2015. Thus, Elizabeth Animal Shelter willfully violated state shelter law and potentially prevented scores of animals from finding their families.

While I can understand Elizabeth Animal Shelter feels pressure to place animals quickly with its small facility, the shelter’s actions are not justified. Certainly, Elizabeth Animal Shelter’s limited space causes the shelter to fill up quickly. However, Elizabeth Animal Shelter did not appear to consistently use its full capacity. The following table compares the “required length of stay” or the maximum time the shelter could keep each animal on average before it runs out of room each month with the average length of of stay for these periods. In other words, this metric estimates how much shelter capacity was used. As you can see, Elizabeth Animal Shelter only used around 61% and 27% of its dog and cat capacity on average during the year. In fact, Elizabeth Animal Shelter did not come close to reaching its maximum capacity in any one month.

Elizabeth Dog Capacity Used

Elizabeth Animal Shelter 2015 Statistics (25)

Clearly, Elizabeth Animal Shelter’s space constraints did not force it to adopt out and send animals to rescues during the 7 day stray/hold period. The city and the shelter simply wanted to save money and do less work by handing animals to rescues as quickly as possible.

To further support the shelter having enough space to obey the state’s 7 day hold period, I recalculated Elizabeth Animal Shelter’s average length of stay if it kept animals for the required 7 day hold period. If the shelter held animals it either illegally killed or adopted out or sent to rescues during the 7 day hold period for 7 days, the shelter’s average length of stay would only rise to 6.3 days for cats and 8.2 days for dogs. As a comparison, the shelter’s required length of stay each month was significantly below these figures (8.8 days to 62 days for cats and 9.2 days to 25.7 days for dogs). Thus, Elizabeth Animal Shelter did not have to violate the state’s 7 day hold law to avoid overcrowding.

Animals Killed Off the Books

Elizabeth Animal Shelter took a number of injured and sick animals directly to an outside veterinarian and did not report doing so in its intake and disposition records. The veterinarian killed/euthanized almost all of these animals (3 dogs, 12 cats plus a number of wild animals). While many were hopelessly suffering, the veterinarian’s invoices inadequately documented the reason for killing/euthanasia in some cases. The example below provides one such example where the veterinarian killed a cat and listed the animal as “injured” without any specific details:

Elizabeth Vet Invoice

Furthermore, the shelter provided me no additional veterinary records in response to my OPRA requests. Given this veterinarian killed most of these dogs and cats on behalf of Elizabeth Animal Shelter prior to the 7 day hold period, the inadequate documentation represents additional shelter law violations. Also, I could not find any of these animals included in the Elizabeth Animal Shelter’s intake and disposition records. Therefore, the shelter violated N.J.A.C. 8.23A-1.13 which requires intake and disposition data on every single impounded animal. Finally, the shelter’s inability to count these animals in its records raises questions as to whether the shelter is also killing other animals off the books.

If I add these dogs and cats to the intake and disposition records, the shelter’s death rates increase by 1-2 percentage points:

Elizabeth Animal Shelter 2015 Statistics (23).jpg

Elizabeth Animal Shelter 2015 Statistics (24)

Highly Questionable Categorization of Animals as Owner Surrenders

Elizabeth Animal Shelter classified an unusually large number of dogs and cats as owner surrenders. Specifically, the shelter classified 42% of dogs and 60% of cats as being surrendered by their owners. As a comparison, New Jersey animal shelters as a whole only classified 32% and 27% of stray and surrendered dogs and cats as owner surrenders in 2014. Furthermore, shelters serving poor areas, such as Liberty Humane Society (20% of both stray and owner surrendered dogs and cats classified as surrendered by owners), Camden County Animal Shelter (28% and 19% of stray and owner surrendered dogs and cats classified as surrendered by owners), and Atlantic County Animal Shelter (19% and 11% of stray and owner surrendered dogs and cats classified as surrendered by owners), categorized much lower percentages of animals as owner surrenders. Thus, Elizabeth Animal Shelter placed unusually large numbers of animals into the owner surrender category.

In fact, per the records I reviewed, the shelter classified nearly every single animal turned in by a person as an owner surrender. However, in reality, shelters receive significant numbers of strays from people finding animals and turning them over to the shelter. Below is an example of one of the shelter’s animal surrender forms (I removed certain information to protect the person’s personal information). As you can see, the form does not state the person surrendering the animal is the owner nor does the form seek any documentation that the animal is in fact owned by the person.

Elizabeth Surrender form.jpg

Elizabeth Animal Shelter’s convenient classification of most animals as owner surrenders rather than strays reduces costs and saves shelter staff from doing more work. Under current state law, shelters must hold all strays for 7 days to provide the animal’s owner the opportunity to get their family member back. If Elizabeth Animal Shelter classifies the animal as an owner surrender rather than a stray under current law, the shelter can immediately hand the animal over to a rescue instead of caring for the animal for 7 days. Prior to 2011, the shelter could also immediately kill an owner surrendered animal upon intake. As discussed above, Elizabeth Animal Shelter still operates as if the old law relating to owner surrendered animals was still in place and often kills owner surrenders during the 7 day hold period. To make matters worse, Elizabeth Animal Shelter only accepts owner surrenders on Thursdays, the day its part-time veterinarian comes to the shelter, and kills large numbers of so-called owner surrenders on that day. In fact, Elizabeth Animal Shelter illegally killed 77 or 72% of the 107 “owner surrender” dogs and cats it killed in 2015 on the day the shelter accepted those animals. In other words, just like Daphne and Rocko, Elizabeth Animal Shelter conveniently classifies animals as owner surrenders to kill them as soon as possible, even if doing so is illegal.

Records Raise Serious Questions as to Whether Elizabeth Animal Shelter Humanely Euthanizes Animals 

Elizabeth Animal Shelter’s euthanasia records do not specify how the shelter killed or euthanized animals. Specifically, the records do not state whether the shelter euthanized/killed each animal by an intravenous (preferred method), intraperitoneal or intracardiac (i.e. heart sticking) injection. Per New Jersey law, shelters can only use intraperitoneal injections on comatose animals and neonatal kittens. Under this method, animals are injected in the abdominal cavity and can take up to 30 minutes to die. Heart sticking, as the name implies, involves stabbing an animal in the heart with Fatal Plus poison and New Jersey shelters can only use this method on heavily sedated, anesthetized or comatose animals. Additionally, Elizabeth Animal Shelter’s records do not state what specific euthanasia drug the facility used for each animal. Thus, Elizabeth Animal Shelter’s euthanasia records do not indicate whether animals are in fact humanely euthanized.

Elizabeth Animal Shelter chooses to sedate rather than comfort animals prior to euthanasia. Specifically, the shelter injected Ketamine into nearly every animal to restrain them prior to administering a poison to kill the animals. The Humane Society of the United States Euthanasia Reference Manual states shelters should avoid using a preeuthanasia anesthetic and hold and comfort animals when appropriate:

When appropriate, it is often best practice to hold and comfort an animal for direct IV or IP injection of sodium pentobarbital rather than injecting a preeuthanasia anesthetic, but neglecting or refusing to use pre-euthanasia drugs when direct injection would cause the animal undue stress is equally ill-advised.

Elizabeth Animal Shelter’s decision to sedate virtually every animal instead of comforting these creatures speaks volumes about how the shelter feels about animals. While some animals are aggressive and require sedatives, surely not 163 of 164 cats and dogs were vicious or incapable of being comforted. After all, when you order the “owner surrenders” to come in on Thursdays for killing you don’t have time to hold and comfort animals. You just stick them with Ketamine and then poison them to death.

To make matters worse, Elizabeth Animal Shelter’s use of pure Ketamine as a preeuthanasia drug is cruel. The Humane Society of United State Euthanasia Reference Manual states shelters should not use Ketamine alone to sedate an animal for killing as it makes the animal’s muscles rigid and the injection stings so much that the animal reacts very negatively to it. If that was not bad enough, large doses can cause convulsions and seizures.

Ketamine (available commercially as Ketaset, Ketaject, and others) is an anesthetic agent that renders an animal completely immobile. However, when used alone it can cause the muscles to become rigid, causing the body to  stiffen. It also stings so much upon injection that it creates a fairly pronounced reaction in most animals. Moreover, in large doses it can produce convulsions and seizures. For these reasons, ketamine is recommended for use only when combined with another drug (like xylazine to create PreMix, above), that tempers these negative effects.

Elizabeth Animal Shelter also used excessive doses of Ketamine. Elizabeth Animal Shelter administered 1.5 cubic centimeters of Ketamine to virtually every adult cat. The product label states 1 milliliter, which equals 1 cubic centimeter, of the Ketamine drug contains 100 milligrams of the active Ketamine ingredient. In addition, the product label states cats requiring restraint should receive a dose of 5 milligrams/pound of cat. The product label also states veterinary personnel should use a dose of 10-15 milligrams/pound of cat to produce anesthesia. Based on most cats weighing 8 pounds, that means the cats should have only received 40-120 milligrams or 0.4-1.2 cubic centimeters of the Ketamine drug. In other words, Elizabeth Animal Shelter provided doses up to 4 times greater than the label indicates. In addition, cats weighing as little as 5 pounds, which would require 0.25-0.75 cubic centimeter doses per the product label, also received the 1.5 cubic centimeter dose. Given large doses can “produce convulsions and seizures”, this indicates many animals could have experienced agony prior to their killing.

Elizabeth Animal Shelter also used incorrect doses of its euthanasia drug assuming it used sodium pentobarbital or Fatal Plus. Per the Humane Society of United States Euthanasia Reference Manual, shelters should use 1 cubic centimeter of Fatal Plus per 10 pounds of animal body weight for intravenous and heart sticking injections and 3 cubic centimeters of Fatal Plus per 10 pounds of animal body weight for intraperitoneal injections. For an 8 pound cat, that would equal 0.8 cubic centimeters of Fatal Plus. However, Elizabeth Animal Shelter used 2 cubic centimeters of its euthanasia drug for just about every adult cat weighing 8 pounds and for most adult cats of different weights. If the shelter used intraperitoneal injections on the 8 pound cats, that would require 2.4 cubic centimeters of the drug compared to the 2 cubic centimeters used by the shelter. Animals receiving too small of a dose may have been still alive before being dumped in the trash or an incinerator if the shelter used intraperitoneal injections. Thus, Elizabeth Animal Shelter’s use of these drugs raises serious questions about whether the facility humanely euthanizes animals.

Elizabeth Animal Shelter’s euthanasia logs list questionable weights for the animals and raise questions as to whether the shelter actually weighed the animals. Under N.J.A.C. 8:23A-1.11 (f) 3 and 4, shelters must weigh each animal and keep a log of those body weights as well as the drugs used to immobilize and euthanize the animals. Almost all the adult cats weighed exactly 8 pounds. Additionally, most of the weights listed for dogs were convenient numbers, such as 60, 65, and 80 pounds. Frankly, I find it highly unlikely that many dogs just happened to weigh in at these user friendly amounts.

Perhaps the most egregious example was Elizabeth Animal Shelter listing a groundhog weighing 40 pounds in its euthanasia log below. Groundhogs typically weigh from 4-9 pounds with 31 pounds being the maximum weight. Now either Elizabeth Animal Shelter impounded the largest groundhog in world history or it didn’t actually weigh the animal. Conveniently, the animal preceding this mammoth sized groundhog was a raccoon weighing the same 40 pounds.

Elizabeth Groundhoug weight.jpg

Elizabeth Animal Shelter’s questionable record keeping raise concerns about whether controlled substances at the shelter are secure. If the shelter reports using more of these controlled substances than they actually do (i.e. a possibility if they are in fact running a humane operation), that provides staff the opportunity to steal some of these drugs. In the case of Ketamine, this is a highly sought after black market recreational drug. As a result, the shelter’s euthanasia records raise concerns that go beyond animal welfare.

Shelter Budget Reflects Misguided Priorities

Elizabeth spends almost its entire shelter budget on employee salaries. Unlike most municipalities that separately disclose the animal shelter’s budget, Elizabeth buries the shelter’s projected expenditures within its Health Department budget. The Health Department’s 2016 budget reveals the Elizabeth Animal Shelter pays salaries totaling $144,481 for its ACOs and $23,241 for a part-time veterinarian. In addition, the Health Officer, Mark Colicchio, who spends part of his time overseeing the shelter, receives a salary of $92,787 a year. Unfortunately, the budget provides no other details on animal shelter expenditures. Unless other animal shelters costs are covered in the $145,000 “Other Charges” line in the Health Department budget, the shelter devotes nearly 100% of its costs to paying people’s salaries and not on animal care.

Elizabeth Animal Shelter’s part-time veterinarian seems to do nothing more than come in and kill animals. Based on discussions I’ve had with several people familiar with the shelter, the part-time veterinarian works at the shelter every Thursday. As discussed above, the shelter only accepts “owner surrenders”, which seems to include both animals actually surrendered by their owners and stray animals found by people, on the day the veterinarian comes in. Sadly, the shelter kills many of these animals on that very day. In fact, that is exactly what happened to Daphne and Rocko. Despite requesting veterinary records under OPRA, the shelter provided me no such records other than those for emergency care performed by an outside veterinarian (most of these animals were euthanized). In other words, Elizabeth’s part-time veterinarian appears to receive around $450 to come in on each Thursday to kill animals.

Videos Reveal Poor Animal Sheltering Practices

In a recent video, Darcy Del Castillo and another ACO were not conducting behavioral evaluations according to the ASPCA’s guidance. Specifically, the ASPCA guidance states:

  1. The room should be quiet: no phones, intercoms, pagers, barking dogs, people talking, and animals housed here
  2. No distractions during the test such as phones, multi-tasking assessors, side conversations and smells that can capture the dog’s interest.
  3. Tester should hold leash with slack

During the video, the Elizabeth Animal Shelter’s evaluator uses a room filled with distractions, talks with another person, and tethers the dog on a tight leash to a kennel. Additionally, another staff member yells at the dog.

Furthermore, the shelter still conducts food guarding tests despite the ASPCA recommending that shelters stop using these inaccurate tests and instead provide all adopters information on how to manage food aggression. Many shelters classify and kill dogs for being food aggressive that don’t display food guarding in a home. Additionally, many dogs who pass food aggression tests in a shelter display the trait in a home setting. Thus, the shelter’s continued use of food aggression tests puts both animals and people at risk.

Another video shows an ACO using a chokepole on a friendly dog abandoned in a home. Given chokepoles can strangle a struggling dog, ACOs should only use these devices as a last resort. Frankly, this video speaks volumes about how some of Elizabeth Animal Shelter’s ACOs feel about animals.

Elizabeth Tries to Dupe the Public Into Believing the Shelter Saved Lots of Animals During the Holidays

In late December, a local news story raved about the job Elizabeth Animal Shelter is doing. The article, which appeared like it was hastily written by the Elizabeth Health Department, stated the shelter saved all of its animals prior to Christmas. Additionally, the news story mentioned positive changes began in the Fall of 2013 (actually it was in 2014) after the facility started evaluating animals and allowing people to post the shelter’s animals on social media. Furthermore, the article touted the city’s pet limit law and policy requiring adopters to alter their animals or face fines. Finally, the article praised Darcy Del Castillo’s sharing of animals on her Shelter Helpers Facebook page and also made a quick reference to the Friends of Elizabeth Animal Shelter Facebook page.

Elizabeth Animal Shelter killed many animals during the month of December. As the tables below show, Elizabeth Animal Shelter killed 44% and 20% of all non-reclaimed cats and dogs. In fact, the shelter’s kill rate in December was higher than the average for the year despite very low animal intake relative to most months. While the shelter labeled some of these animals as “sick” and “medical euthanasia”, the city provided me no actual veterinary documentation that these animals were in fact hopelessly suffering. Furthermore, the high kill rate makes it highly unlikely that most of these animals were in a permanent state of severe physical distress. Thus, Elizabeth failed to tell the public about its entire performance during the holiday season.Elizabeth Animal Shelter 2015 Statistics (20)

Elizabeth Animal Shelter 2015 Statistics (28)

The Elizabeth Animal Shelter also violated the 7 day hold period during December 2015. The shelter illegally killed 7 dogs and cats prior the end of the 7 day hold period during December 2015. In fact, the facility illegally killed two owner surrendered cats on December 31 just before the New Years Day holiday. Furthermore, Elizabeth Animal Shelter adopted out/sent to rescue 3 stray dogs during their 7 day hold period in December 2015. Thus, Elizabeth Animal Shelter patted itself on the back while it operated in an illegal manner.

Elizabeth’s touting of its more stringent animal control laws reveals a city putting into place policies that will take rather than save lives. First and foremost, the shelter’s hypocritical requirement that Elizabeth residents alter adopted dogs when the city shelter refuses to do so discourages adoptions. How many companies sell you a product with the threat of heavy fines if you don’t do what they say? Its like Toyota selling you an automobile without seat belts and fining you if you don’t put them in yourself. Frankly, that type of policy scares adopters away. Second, pet limit laws reduce the number of homes for animals and lead to increased shelter intake and killing. The ASPCA, HSUS, Best Friends and the No Kill Advocacy Center all oppose these laws as these statutes waste scarce resources that cities can use to save animals and lead to increased shelter killing. Furthermore, cities can enforce animal cruelty statutes without having pet limit laws. Thus, Elizabeth brags about animal control policies that exacerbate rather than reduce shelter killing.

The glowing Elizabeth Animal Shelter story failed to recognize many of the other people responsible for emptying the shelter out before last Christmas. Specifically, the press release failed to recognize Jennifer Arteta, who runs the Friends of Elizabeth Animal Shelter Facebook page mentioned in the story. Ms. Arteta was the owner of the two dogs, Daphne and Rocko, who Elizabeth Animal Shelter illegally killed in June 2014 and who led the effort to reform the shelter. In addition, the story failed to mention the Union County Lost Pets Facebook group which actively promotes and finds placement for Elizabeth Animal Shelter’s animals. The person running the Union County Lost Pets group also worked to reform Elizabeth Animal Shelter after the Daphne and Rocko incident. As a result, the article failed to mention that the very people fighting against the city to reform the shelter played a key role in emptying out the Elizabeth Animal Shelter.

Elizabeth Animal Shelter Still Needs Reform

The Elizabeth Animal Shelter has improved in some respects since it illegally killed Daphne and Rocko in June of 2014. Certainly, the shelter decreased its dog kill rate and Darcy Del Castillo deserves some credit. However, the shelter’s cat kill rate increased since Ms. Del Castillo’s arrival at the shelter. That being said, Elizabeth Animal Shelter is a far safer place for animals than the atrocious Associated Humane Societies-Newark shelter located a few miles away.

However, Elizabeth Animal Shelter’s improvement with dogs is primarily due to the rescue community and not the city or its shelter. After following Facebook pages, such as Union County Lost Pets and Friends of the Elizabeth Animal Shelter, and reviewing the shelter’s records, I can clearly see how hard local rescues, animal advocates and Elizabeth residents work to save animals from the shelter. The shelter basically throws out a terrible photo and tells the rescue community to save the animal or the dog or cat will die. Even the few animals the shelter adopts out are due to local animal advocates promoting the pets rather than the shelter itself. Other than Ms. Del Castillo, no one at the shelter appears to do anything proactive to save the animals. Even worse, the near 100% reliance on rescues likely results in little to no net increase in lifesaving in the region due to rescues pulling from Elizabeth Animal Shelter rather than other local kill shelters.

The Elizabeth Animal Shelter fails to even do basic animal sheltering. The shelter typically provides no veterinary care other than killing. The city does not spay/neuter or even vaccinate its animals. Furthermore, the shelter willfully violates New Jersey’s shelter laws relating to public operating hours and the 7 day hold period. In other words, the shelter still regularly does the very thing that sparked reform efforts at the Elizabeth Animal Shelter. Additionally, the shelter may be violating state shelter laws in the areas of humane euthanasia as well as record keeping.

The Elizabeth Animal Shelter also violates many of the standards of care advocated by the ASPCA. The ASPCA is a traditional shelter advocacy group and it typically recommends far lower standards than what no kill groups do. However, the Elizabeth Animal Shelter violates even these lower standards. Specifically, the Elizabeth Animal Shelter fails to do the following things:

  1. Have minimum standards for facilities, sanitation, medical protocols, and enrichment/socialization
  2. Shelters should never use the expiration of applicable holding periods or owner relinquishment as license to immediately euthanize animals simply because, at least legally, their “time is up”
  3. Shelters must provide clear notice to the public concerning shelter locations, hours, fees and the return-to-owner process
  4. Shelters should be accessible during reasonable hours to owners seeking to reclaim their pet. These hours should include some reasonable additional period of time beyond the typical workday (e.g. 9am to 5pm Monday through Friday) so that pet owners who may not have flexible work schedules have the best opportunity to reclaim their pets.
  5. Shelters should make written descriptions of key processes and information easily and readily available for public inspection.

Despite the increase in the facility’s dog live release rate, too many animals still lose their lives at the Elizabeth Animal Shelter. 1 out of 3 pit bull like dogs and cats requiring new homes lose their lives at the shelter. In this day and age where animal control shelters in large cities, such as Jacksonville, Florida, Baltimore, Maryland, Salt Lake City, Utah, Portland, Oregon Austin, Texas, Atlanta, Georgia, Kansas City, Missouri, and Washington DC achieved or are close to reaching no kill status (90% or higher live release rate), we should expect far more from the Elizabeth Animal Shelter.

Elizabeth needs to operate its shelter using the no kill equation in an enthusiastic manner. The key programs are as follows:

NKE

For far too long, the city’s leaders have chosen to operate the Elizabeth Animal Shelter as cheaply as possible. The city’s shelter is literally located in a public works area hidden from public view.Elizabeth Dog Warden - Google Maps

City officials never expanded the facility, despite plenty of land being available, and allowed it to remain undersized. Furthermore, city officials compensated by violating its own residents’ rights by killing and transferring animals illegally during the 7 day hold period. Simply put, Elizabeth’s political leaders view homeless animals as trash and only allow rescuers to pick that trash up before its taken to the garbage dump.

Elizabeth residents should demand far more than an old school pound that expects rescues to save the day and completely pay the bills. Clearly, the city of Elizabeth’s residents have spoken up and taken actions that prove they desperately want a no kill city shelter. Just imagine what animal advocates could achieve if they had a city and a shelter determined to do its part in saving lives. Instead of desperately trying to take animals off of death row, these volunteers could urgently work with the shelter to treat, rehabilitate and quickly get homeless animals into permanent homes. In return, hundreds of people would come to the city to adopt, volunteer, donate funds to the shelter and spend money at local businesses.

If the city chooses to not operate the shelter according to state law as well as its residents’ desires, Elizabeth should issue an RFP to allow one or more of the rescues to take the facility over. Clearly, the city of Elizabeth is failing its animals and its pet owning residents. If elected officials won’t act, then its time for Elizabeth voters to replace these politicians with folks who will do the right thing for Elizabeth’s animals and citizens.

Associated Humane Societies Kills Massive Numbers of Newark’s Homeless Animals

Associated Humane Societies often publishes emotional stories about the organization heroically rescuing animals from terrible situations in Newark. Typically, these stories are found on the AHS web site and/or their Humane News publication. These fundraising efforts are lucrative as AHS brought in an impressive $3.6 million in donations and grants for the fiscal year ended June 30, 2014. The 2003 New Jersey Commission of Investigation report on AHS stated the organization’s fundraising campaigns did not fairly represent the care typically provided to animals:

The substandard conditions and treatment of the animals, which existed on a large scale until recently, betrayed AHS’s massive fundraising campaign through the years and contradicted AHS’s persona as a “humane” organization. Bernstein capitalized on the plight of animals to garner millions of dollars in contributions, but failed to apply any portion of those millions to establish a satisfactory level of care and treatment.

Are these fundraising stories representative of the care most Newark animals receive at AHS-Newark now? Has AHS-Newark improved enough since the 2003 New Jersey Commission of Investigation report was issued?

Additional Animal Control Contracts and Summary Statistics Raise Serious Concerns

In 2014, AHS-Newark added a number of municipalities, such as South Orange and Maplewood (both towns no longer contract with AHS-Newark) and the cities and towns formerly contracting with Linden Animal Control. Despite already killing large numbers of animals, AHS-Newark decided to contract with all these additional municipalities and receive substantial fees in return. In February 2015, AHS-Newark Assistant Executive Director, Scott Crawford, stated his organization could handle the additional animals.

The shelter’s annual summary statistics showed it impounded and killed more animals in 2014 verses 2013. Animal intake increased from 5,019 dogs and cats in 2013 to 6,194 dogs and cats in 2014. AHS-Newark reported the number of dogs and cats that were killed, died or went missing increased from 1,962 in 2013 to 2,356 in 2014. As a result, AHS-Newark literally earned more revenue by impounding and killing significantly more animals in 2014 verses 2013.

Detailed Analysis Conducted 

To get a better understanding of AHS-Newark’s handling of animals, I submitted an OPRA request to the City of Newark’s Animal Control Department seeking intake and disposition records of animals the city’s Animal Control Department impounded in 2014. The City of Newark picks up animals during normal working hours and delivers most animals to the AHS-Newark shelter. At other times, AHS-Newark ACOs perform these duties. The records do not include direct owner surrenders to the shelter from Newark residents (except for a few that were included), but do include people surrendering their animals to animal control who then take the animals to AHS-Newark. After much follow-up over a period of several months, I received AHS-Newark’s underlying intake and disposition records for the animals originating from animal control in Newark.

In total, I obtained around 3,000 pages of records and it took me several months to review and summarize this information. Many of these records were for wildlife, animals leaving before animal control officers arrived, and animals that were dead by the time the animal control officer got to the location. Overall, I reviewed the intake and disposition records of 966 cats and 649 dogs that AHS-Newark impounded in 2014. These records constituted 23% of the dogs and 28% of the cats AHS-Newark reported taking in during 2014.

I reviewed each record and summarized my findings. My summary included the animal’s ID number, species, breed, origin (stray, owner surrender, confiscated by authorities), intake date, outcome date, length of stay, outcome, reasons for killing, miscellaneous information, and any comments I had. I only counted the two primary reasons for killing, but generally mentioned other reasons listed in my notes.

AHS Newark’s Underlying Records Reveal Horrors

Honestly, when I received the information I thought the City of Newark forgot to provide me the records for animals making it out of the facility alive. However, the records included some animals who were adopted out and rescued. The records I obtained listed 229 additional animals I did not receive information for. Even if all these other animals made it out of AHS-Newark alive, the dog and cat kill rate based on intake would only drop nine percentage points. My records indicated AHS-Newark impounded 5.8 dogs and cats per 1,000 residents (6.6 dogs and cats per 1,000 people if I include the 229 missing animal records) that came from animal control in Newark. As a comparison, AHS-Newark impounded 4.3 dogs and cats per 1,000 residents from animal control in Irvington per a summary spreadsheet that AHS prepared. If I assume 43% of AHS-Newark’s animals from the City of Newark came from other sources (i.e. owner surrenders, people finding animals on street, etc), which is the percentage from nearby Irvington, then AHS-Newark would take in 10.2 dogs and cats per 1,000 residents (11.6 dogs and cats per 1,000 people if I include the 229 missing animals) from all sources in Newark. This figure is around the same as, if not a bit higher than, other demographically similar cities in the area. Additionally, I submitted another OPRA request for any missing animals to the City of Newark and was told no other records existed. While I can’t say for sure if my data set contains the overwhelming number of animals AHS-Newark obtained from animal control in Newark, I think it represents a very large percentage.

The sheer number and percentage of animals losing their lives at AHS-Newark is staggering. Overall, AHS-Newark killed 79% of the cats, 63% of the dogs, and 74% of the pit bull like dogs in this data set. Furthermore, if I add animals who died at AHS-Newark and only count known outcomes, 93% of cats, 70% of dogs, and 81% of pit bull like dogs in this data set lost their lives at AHS-Newark. To put it another way, 855 out of 919 cats, 424 out of 608 dogs, and 329 out of 408 pit bull like dogs lost their lives per these records. As a result, these records indicate AHS-Newark operated more like a death camp than an animal shelter for the dogs and cats coming to the facility from animal control in the City of Newark.

2014 City of Newark Outcomes

Even if the death rate for animals from Newark Animal Control was actually lower due to the City of Newark not providing me additional records, my analysis still shows AHS-Newark killed vast numbers of healthy and treatable animals.

Results Raise Question About AHS-Newark’s Reported 2014 Statistics

These results show AHS-Newark disclosed erroneous statistics to the New Jersey Department of Health. In AHS-Newark’s 2014 Shelter/Pound Annual Report, the organization stated 12 dogs and 92 cats died or went missing. However, my data set, which only includes 23% of the dogs and 28% of the cats AHS-Newark impounded during the year, had both more dogs (13) and cats (96) dying in the shelter in 2014 than AHS-Newark reported for all of its dogs and cats. If I add the animals where a “Not Available” outcome is listed, the number of animals dying or going missing rises to 15 dogs and 101 cats. Furthermore, my data set accounted for 50% and 53% of the number of dogs and cats AHS-Newark reported to kill despite only making up 23% and 28% of the number of dogs and cats AHS-Newark reported it impounded in 2014. While AHS-Newark may kill dogs and cats from the City of Newark at a higher rate than animals coming in from other jurisdictions, I find it hard to believe the kill rate is that much higher for Newark animals, particularly cats. In addition, AHS-Newark reported it impounded the exact same number of dogs (2,794) and cats (3,400) that had outcomes for the year. Frankly, I find that pretty hard to believe given AHS-Newark stated it held over 200 dogs and 200 cats at the shelter during the beginning and end of the year. Thus, this data raises concerns that more animals are losing their lives at AHS-Newark than the shelter is reporting.

AHS-Newark Quickly Kills Animals

In February 2015, AHS-Newark Assistant Executive Director, Scott Crawford, bragged about his shelter’s capacity and the extra time the facility had to place animals compared to some other local alternatives. Based on my review of the above records, AHS killed cats and dogs arriving from Newark Animal Control in January 2014 within 30 days and 27 days on average:

AHS-NEwark Jan 2014 LOS for Newark

After AHS-Newark took over the cities and towns formerly contracting with Linden Animal Control in November 2014, AHS-Newark killed cats and dogs impounded from Newark Animal Control in this data set much more quickly. Despite Mr. Crawford’s assertion in early February 2015, AHS-Newark rapidly killed cats and dogs impounded from Newark Animal Control in this data set two months before he made this outlandish claim. Based on my review of these records, AHS-Newark killed cats and dogs impounded from Newark Animal Control in December 2014 within 13 days and 11 days on average:

AHS-NEwark Dec 2014 LOS for Newark

As a result, AHS-Newark’s assertion that it keeps many animals alive a long time is not consistent with the data I examined for dogs and cats arriving from Newark Animal Control.

Absurd Justifications for Killing

AHS-Newark used many poor excuses to kill animals. The top four reasons AHS-Newark used to kill cats were as follows:

  1. Sick
  2. Aggressive, unfriendly and feral
  3. No reason listed
  4. Ringworm

AHS-Newark’s cats were often sick due to an Upper Respiratory Infection (“URI”) or the common cold. Countless records stated AHS-Newark killed the cat due to the animal “not responding to treatment.” With so many animals getting sick and not getting better, one has to wonder what kind of disease control program AHS-Newark has?

Several examples illustrate AHS-Newark’s inability to medically treat cats with colds. Toots was surrendered to AHS-Newark due to her owner no longer being able to care for her. Despite being a young cat less than 3 years old, AHS-Newark stated they had to kill her within 10 days of arriving at the shelter. While the intake and disposition record states Toots was not responding to treatment for her URI, the veterinary log on this record only mentions the standard vaccinations, deworming and Frontline flea and tick medication received on the day she arrived at AHS-Newark. The veterinary log then mentions she was poisoned to death with Fatal Plus 10 days later. Call me crazy, but I don’t see any documentation of any additional veterinary treatment for her URI on this record.

ID 128745 Killed for URI

Brooklyn was an 11 month old cat described as “very sweet” by AHS-Newark. Yet, within 11 days of arriving at the shelter, AHS-Newark killed her due to a “very bad URI” that did not get better. However, once again the veterinary log on this record did not describe any specific treatment for her cold after her vaccinations on the day she arrived.

ID 129234 Killed for URI

Moonlight was a 15 month old stray cat and described by AHS-Newark as “very beautiful, sweet and trusting” and “wants love and attention.” Yet, AHS-Newark killed her 16 days after her arrival at the shelter due to her having a “URI” and being “weak and lethargic.” Other than two rounds of the standard shelter vaccinations and deworming, AHS-Newark once again provided no other treatment specifically for the URI per the veterinary log in this record.

ID129667 URI Cat

The records did not indicate AHS-Newark sent any of these cats to an isolation area for treatment, reached out to any rescues or tried to place the animals in foster homes to recover from their illness. Thus, AHS-Newark failed all three cats, as well as many others, who were highly adoptable.

AHS-Newark labeled many cats feral and/or unadoptable for dubious reasons. Notably, the shelter provided inadequate amounts of time to socialize fearful cats who were justifiably scared in this high kill shelter. Furthermore, I saw no efforts to socialize virtually all of these cats on their records. In fact, AHS-Newark often classified owner-surrendered cats, who presumably lived in or around homes, as feral or otherwise unsuitable for people to adopt. For example, Baby Girl was a 3 and half year old cat surrendered due to her owner moving. AHS-Newark labeled this cat a “wild” and killed her within just 8 days of arriving at the shelter. In addition, AHS-Newark did not vaccinate her upon intake and therefore increased the risk of disease among the shelter’s cat population.

ID 129063 OS Cat Killed for Feral

Me Me was surrendered by her owner due to the owner not having room for the cat. Once again AHS-Newark labeled the cat as “wild”, did not vaccinate her, and killed her within 9 days:

ID 1208046 OS Cat Killed Feral

Lucky, who was nearly 9 years old, was surrendered due to her owner not being able to care for her any longer. Despite this cat most likely having lived in or around a home for many years, AHS-Newark labeled her as “wild”, did not vaccinate her, and killed her after just 7 days.

ID 128791 Feral Cat Killed

Thus, AHS-Newark’s labeling of cats as feral, aggressive and otherwise unadoptable is highly suspect.

AHS-Newark used a “throw everything but the kitchen sink” approach to justify the mass killing of dogs. Often times the shelter listed multiple boilerplate reasons, like aggression (including “cage crazy”/”not kenneling well”), dog aggression, sick, etc. The top five reasons AHS used to kill dogs were:

  1. Aggression related issues
  2. Sick
  3. Dog aggression
  4. No reason listed
  5. Overcrowded

While certainly some dogs likely were truly aggressive, many dogs labeled as such did not seem that way. Sadie was a nearly 4 year old pit bull mix with a very good behavioral evaluation. The evaluation stated Sadie was “playful, loving and affectionate once she gets to warm up.” The evaluation also stated Sadie “allows you to handle her from head to tail without complaint” and “she is easy taking treats and likes to share her toys.” Yet, just over one month later, “SC”, who I presume is AHS Assistant Executive Director, Scott Crawford, approved her killing for “becoming temperamental.” The record provided no elaboration on what her exact problems were nor did the record document any efforts to rehabilitate her.

ID 125906 Dog Killed Aggression

Sadie2

Billy was a 2 year old Plott Hound-Boxer Mix. The dog’s evaluation stated he did not behave well inside his kennel, but “all you have to do is take him outside and he is a totally different dog.” Billy’s evaluation went on to say “he is fine with being handled all over” was “gentle with treats”, had “a great food test” and “seemed fine with the other dogs outside.” Despite this very good evaluation, AHS-Newark decided to kill him exactly 3 weeks later for being “extreme cage crazy”, “becoming hard to handle”, “doesn’t show well” and “no dogs.” AHS-Newark couldn’t even take the time to write a proper sentence to justify killing this young dog. The record provided no documentation that AHS-Newark tried to alleviate his kennel stress or perform any other efforts to rehabilitate him. Simply put, the record indicates AHS-Newark killed Billy for convenience as he didn’t “show well” and was “hard to handle.”

ID 122530 Dog Killed

Billy 2

Danny was a nearly 3 year old American Bulldog. He had a good evaluation stating he was “playful”, “good with other dogs”, “knows sit”, and “needs manners.” In other words, Danny was a big playful puppy. In addition, his record states he was a “photo shoot dog.” Just over two months after Danny’s evaluation, AHS-Newark killed Danny and justified it by stating “no dogs” and “insane in kennels.” Once again the record mentions no actions to provide any enrichment to Danny. It doesn’t take a rocket scientist to determine that a high energy dog needs stimulation and exercise. Also, the record provides no details on Danny’s alleged dog aggression which is contradicted by his behavioral evaluation. Even more disturbing, AHS-Newark killed one of the few dogs in this data set with an evaluation (less than 10% of dogs and virtually no cats had an evaluation) and included in a photo shoot. If AHS-Newark kills dogs in the spotlight, what chance do the vast majority of animals that are never seen or heard have?

ID 125726 Part 1

ID 125726 Part 2

AHS-Newark’s practice of killing massive numbers of dogs for aggression related issues clearly needs to stop. While some dogs coming into a shelter are a serious threat to people and their problems will not satisfactorily respond to rehabilitation efforts, well-run animal control shelters typically find 5% or fewer of dogs fall into this category. In this data set, AHS-Newark killed 26% of their dogs for aggression related issues plus a number of others for dog aggression. As a result, AHS-Newark is unfairly labeling dogs as aggressive.

AHS-Newark also killed dogs due to lack of space. Qunn’s intake and disposition record described him as “very excitable, but nice” and “kind of wild, but very, very friendly.” Despite this, AHS-Newark killed Quinn for not being able to place him with another dog in a kennel and him being “hyper” and “hard to handle.” The record provides no evidence that AHS gave Quinn any exercise let alone enrichment. Furthermore, AHS-Newark killed Quinn during December which is typically one of the lowest intake months for shelters. Even worse, AHS-Newark killed Quinn for lack of space less than two months before Scott Crawford bragged about his shelter’s large capacity.

ID127690 Killed Pt 1

ID127690 Killed (2)

Red was a 16 month old dog surrendered to Newark Animal Control by his owner. After just 8 days, AHS-Newark killed him for having a cold and the isolation area being full and for allegedly not being able to house him with other dogs. The intake and disposition record provides no evidence AHS-Newark gave any specific treatment for his URI other than a canine flu vaccine upon intake. AHS-Newark killed Red due to a lack of space just two and half months before Scott Crawford boasted about his shelter’s ability to house lots of animals.

ID130711

Rambo was a “friendly stray dog” who was killed due to overcrowding. AHS-Newark identified the owner and apparently talked with her. For whatever reason, the owner did not reclaim the animal. AHS-Newark killed Rambo in December, one of the lowest intake months for most shelters, due to “no dogs”, “no response” to the letter to his owner and the main kennel being full. Once again Scott Crawford decided to kill a “friendly” dog due to lack of space just two months prior to him bragging about the large amount of animals his shelter could hold.

ID129821

AHS-Newark also killed many dogs for no documented reason. Pamtera was apparently abandoned in an apartment. AHS-Newark often publicizes these types of cases in fundraising appeals. After 11 days, AHS-Newark killed Pamtera for no reason other than it being “ok to pts per kp.”

ID130032

Dog ID# 130078, like most of the animals I reviewed records for, had no name. She was a 6 year old and 5 month old small terrier mix. After just 8 days, AHS-Newark killed her once again for no reason other than being “ok to pts per kp.” Even worse, this record did not state how AHS-Newark killed Dog ID# 130078.

ID 130078

Durango’s evaluation described him as “sweet and affectionate”, “very focused and loving towards all people, but he doesn’t like other dogs”, “genuinely loved to give and get attention” and “a handsome boy with knockout gorgeous eyes.” Furthermore, his intake and disposition record states in bold and in caps “Humane News – February”, “Petfinder”, “Facebook”, “Do Not PTS.” In other words Durango was a fantastic dog and was one of the few dogs AHS-Newark intended to promote. Despite all of these great things going for him, AHS-Newark killed Durango for no reason according to this record.

ID130867

ID 130867

AHS Hands Animals Over to a Rescue Subsequently Convicted for Animal Cruelty

AHS-Newark has a difficult adoption process in my experience. Typically, AHS-Newark makes people visit the shelter multiple times to adopt an animal. Often, this process can take a number of days. As a result of these policies, animals stay too long at the facility and this increases the chance the shelter will kill animals due to lack of space.

Gabriel Ganter (formerly Gabriel Palacios) was recently convicted of animal cruelty. Ms. Ganter ran Pit Bull Kisses rescue out of Newark until she moved to Dumont. On May 13, 2015, the Bergen County SPCA raided her Dumont home and found dead dogs in garbage bags, a live dog and starved cat on chains without proper shelter (warning: the photos in this link are deeply disturbing). Furthermore, one official stated the conditions insider her house were “horrid.” Ultimately, Gabriel Ganter pleaded guilty to not providing necessary care to animals this month.

Gabriel Ganter’s Pit Bull Kisses Rescue rescued the most animals of any organization in this data set. Pit Bull Kisses rescued 16 of the 35 dogs and cats rescued in the records I reviewed. In all fairness, many people in the animal welfare community were duped by Gabriel Ganter. However, Ms. Ganter began acting erratically in the summer of 2014 and AHS-Newark should have known this. Sadly, AHS-Newark still allowed Pit Bull Kisses to rescue the following dog and cat after this point:

PBKR D1

PBKR D2

PBKR C

We can only hope this unnamed dog and cat went to other foster homes rather than Gabriel Ganter’s house of horrors.

AHS Fails Newark’s Stray Animals

The sheer amount of killing is mind boggling. Nearly 1,300 dogs and cats just from the City of Newark lost their lives after arriving at AHS-Newark in 2014. Furthermore, that number most likely would be higher if I obtained the records of the over 200 missing animals not provided to me. To put it another way, around 4 dogs and cats just from the City of Newark lose their lives at AHS-Newark on average each day of the entire year. 84% of the dogs and cats in this data set who came into AHS-Newark in 2014 and had outcomes lost their lives. For these animals, AHS-Newark is a slaughterhouse rather than a shelter.

The underlying records I examined reveal no substantial effort to end this pet extermination project. Massive numbers of animals get sick with treatable illnesses and AHS-Newark still kills them. The records I reviewed did not indicate the shelter often seeks foster homes or even places many sick animals in isolation areas. Even worse, not only do animals typically not receive behavioral rehabilitation, but AHS-Newark seems to actively classify animals as aggressive to justify killing those creatures. Worst of all, AHS-Newark placed such a low value on the lives of these animals that shelter staff couldn’t even write complete sentences or even spell correctly on many of these records. When you can’t take the time to properly document the animal’s information on its record, what hope do we have that you will invest the time and energy into saving that dog or cat? Now, perhaps these records are inaccurate, but that raises even more questions? If your records are inaccurate, why should we believe anything you claim?

Clearly, AHS-Newark should never have contracted with additional municipalities when it already killed far too many animals. Frankly, AHS-Newark should have sought ways to reduce intake rather than deliberately bring in more animals in exchange for more animal control and sheltering contract fees. While all three AHS facilities have more than enough space to save its dogs and cats, AHS fails to enthusiastically implement proven programs and policies to perform at these levels. As such, AHS-Newark should have terminated rather than have added animal control and sheltering contracts.

Donors Must Hold AHS Accountable

Donors should demand AHS-Newark comprehensively adopt the no kill equation as countless other animal control shelters successfully have. Animal control shelters in Kansas City, Missouri, Austin, Texas, and Salt Lake City, Utah achieved no kill status and even save around 90% of their pit bull like dogs. Other animal control shelters in poor urban areas, such as in Washington, DC and Baltimore, Maryland, are close to achieving no kill. All of these animal control shelters take in more animals in total and on a per capita basis than AHS-Newark. Additionally, most of these shelters receive less revenue per animal than AHS. Thus, AHS-Newark should do great things.

At the end of the day, donors must wake up and demand AHS change its ways. Apparently, AHS thinks it can dupe its donors into thinking most of the animals it impounds from Newark are heroically rescued and sent to loving homes. Based on the records I reviewed, this absolutely is not the case. AHS must remove its entire senior leadership team, including Roseann Trezza, and replace them with people dedicated to comprehensively implementing the no kill equation. The good people donating to AHS clearly expect the organization to save its animals. It is time donors require AHS to use their hard earned money to save animals and not kill them for convenience and cost savings.

Perth Amboy Animal Shelter’s Amazing Turnaround Story

Several years ago the Perth Amboy Animal Shelter was in a crisis. Under the control of future Helmetta Regional Animal Shelter Director and Assistant Director, Michal Cielesz and Richard Cielesz, the shelter lacked community support. In 2010, which was the Cieselzs’ last full year at the shelter, the facility killed 25% of its dogs and 58% of its cats. Furthermore, the Perth Amboy Animal Shelter only adopted out 2 dogs and 10 cats for the entire year in 2010. During 2011, the Cieselzs’ left Perth Amboy Animal Shelter, but the facility still killed 14% of its dogs, 42% of its cats and 49% of its other animals. (i.e. rabbits, guinea pigs, hamsters, etc). As a result, the Perth Amboy Animal Shelter was a high kill shelter with a poor reputation.

City Hires New Animal Control Officers To Transform the Perth Amboy Animal Shelter

The city government oversees and has ultimate authority over the animal shelter. As is typical with municipal animal shelters, a department of city government, the Police Department in the case of Perth Amboy, controls the animal shelter. The city hires animal control officers to run the animal shelter and make day to day decisions. However, the Police Department has to approve new policies. Additionally, the Perth Amboy City Council may also have to approve significant new initiatives at the animal shelter. As a result, a successful animal shelter in Perth Amboy requires a supportive Police Department and City Council.

During the middle of 2012, Perth Amboy hired current Head Animal Control Officer, Christie Minigiello, to work at the animal shelter. The city hired Christie based on a recommendation from her Kean University Animal Control Officer Training program professor. Other than a very short stint at another animal control agency, Christie was new to animal sheltering. Prior to this, Christie worked in the dental field, operated a crafts business and was a passionate animal advocate. For example, several years ago Christie sent a dog, who we considered adopting before choosing another long-stay dog, to a reputable sanctuary after the shelter decided to euthanize the dog for alleged aggression. Thus, Perth Amboy decided to hire a competent person with a passion for saving animals.

Perth Amboy subsequently hired two additional compassionate animal control officers. In 2013, the city hired Joe Lipari to work at the animal shelter. Previously, Joe volunteered at the Woodbridge Animal Shelter. Joe is known as the “Pit Bull Whisperer” among Perth Amboy Animal Shelter’s staff based on his ability to train and understand large dogs. Perth Amboy hired Jackie Rivera in 2014. Jackie volunteered at the Perth Amboy Animal Shelter prior to becoming an ACO at the facility. Thus, the city hired compassionate ACOs to run the animal shelter.

Perth Amboy Animal Shelter is not an easy place to save lives. 24% of Perth Amboy’s population lives below poverty level compared to New Jersey’s average of just 10%. Perth Amboy’s poverty rate exceeds the levels found in Jersey City, Elizabeth and East Orange. In 2013, the city only spent $281 per dog and cat on animal control and sheltering compared to the high kill and dreadful East Orange Animal Shelter’s budget of $345 per dog and cat. While Perth Amboy Animal Shelter’s budget thankfully increased in 2014 and 2015, the budgeted amount per animal is still significantly lower than the amounts of many high kill shelters. Furthermore, few dogs coming into the shelter have microchips or licenses, which is likely due to the relatively low socioeconomic status of many of the city’s residents. Based on the facility’s small capacity and the number of dogs impounded and returned to owners in 2013 and 2014, I estimate the shelter only had 24-32 days in 2013 and 35-45 days in 2014 to get dogs out of the facility before no room was left to house these animals. Thus, Perth Amboy is not an easy city to achieve no kill.

Christie, Joe and Jackie dramatically improved the shelter. In 2012, when Christie was only at the shelter for half the year, the euthanasia rate decreased from 14% to 7% for dogs and from 42% to 25% for cats. Undoubtedly, the euthanasia rate was much lower in the latter half of the year after Christie started working at the shelter. In 2013, the Perth Amboy Animal Shelter saved 97% of its dogs and 93% of its cats. In other words, only 3% of dogs and 7% of cats were euthanized or died at the shelter. Based on the facility exceeding a 90% live release rate, the shelter achieved no kill status in 2013 and was recognized by Saving90.org as being a role model shelter.

Detailed Data Shows Perth Amboy Runs a Highly Successful Shelter

In order to better analyze the shelter, I obtained detailed animal intake and disposition records for 2014 (except for one month for dogs and two months for cats) and the first six months of 2015. These records included the date the animal arrived at the shelter, species, breed, outcome (i.e. adoption, returned to owner, rescued, euthanasia, etc.) and outcome date. I tabulated this data to calculate the live release rate, average length of stay and other metrics to analyze the shelter’s performance. One slight methodological difference in my calculations verses the figures above is I counted outcomes occurring in a subsequent year as happening in the year the animal came to the shelter. For example, an animal arriving at the shelter in December 2014 and adopted out or euthanized in January 2015 will count towards the 2014 live release rate and average length of stay figures.

In 2014, the shelter continued to do an incredible job saving its dogs. The outcome statistics and average length of stay figures for dogs arriving at the Perth Amboy Animal Shelter in 2014 are detailed in the table below. 95% of the 135 dogs coming into the shelter were saved. In addition, rescues only pulled 4% of the dogs indicating Perth Amboy Animal Shelter was able to save almost all of these dogs on their own. Furthermore, dogs only stayed 26 days on average at the shelter and only took 31 days to get adopted. Thus, Perth Amboy Animal Shelter saved almost all of its dogs on its own and those dogs did not spend a long time at the shelter.

All Dogs Perth Amboy 2014

Perth Amboy Animal Shelter also did an excellent job with its pit bull like dogs. While Perth Amboy Animal Shelter does take in a large number of small dogs, which are easier to adopt out, 27% of the shelter’s dog intake were pit bulls and pit bull mixes. The outcome statistics and average length of stay figures for pit bull like dogs arriving at the Perth Amboy Animal Shelter in 2014 are detailed in the table below. The shelter saved 86% of pit bulls in 2014. Perth Amboy Animal Shelter’s 2014 pit bull live release rate was the same as two of the nation’s best no kill animal control shelters, Kansas City’s KC Pet Project (2013) and Austin Animal Center (2014). Additionally, the shelter’s pit bull like dogs only stayed at the facility for 66 days and were adopted out on average in 82 days. Furthermore, rescues only pulled a small percentage of these dogs. Thus, Perth Amboy Animal Shelter saved a very high percentage of its pit bulls in 2014 and got these dogs out of the shelter in a reasonably short time period.

Perth Amboy 2014 Pit Bull Data

The shelter performed even better with dogs in 2015. Through the first 6 months of 2015, Perth Amboy Animal Shelter saved 98% of dogs who had outcomes. In fact, the shelter only euthanized one dog who had a broken back and leg and was hopelessly suffering. Additionally, dogs stayed at the facility one day less in 2015 verses 2014 despite the uptick in the live release rate. Even more impressive, the shelter saved 100% of its pit bulls through the first half of 2015. Additionally, pit bulls stayed at the facility on average 18 days less in 2015 verses 2014 and adopted pit bulls’ average length of stay decreased by 30 days in 2015. In fact, Perth Amboy Animal Shelter adopted out its pit bulls in roughly the same amount of time as the benchmark animal shelter, Tompkins County SPCA, I use to grade New Jersey animal shelters. Thus, Perth Amboy Animal Shelter has done a fantastic job with all of its dogs.

Perth Amboy 2015 Dogs

Pit Bulls 2015 Revised

Perth Amboy Animal Shelter’s dog performance for the combined period (2014 and the first half of 2015) was excellent. 96% of all dogs and 90% of pit bull like dogs made it out of the shelter alive. In other words, Perth Amboy Animal Shelter achieved no kill for all dogs, including pit bulls. Additionally, the average length of stay for all dogs was just 26 days and a respectable 60 days for pit bulls. Thus, Perth Amboy Animal Shelter achieved no kill for its dogs and was able to place those dogs relatively quickly.

All Dogs PA Revised

All Pit Bull PA Revised

While Perth Amboy Animal Shelter’s cat live release rate slipped a little in 2014 and 2015, the shelter still does a pretty good job with cats. Based on the facility’s 2014 Shelter/Pound Annual Report submitted to the New Jersey Department of Heath, the shelter only euthanized 9% of the cats who had outcomes during the year. However, the live release rate drops to 82% if we count cats who died at the shelter during the year. Sadly, cats do die even at very good animal control shelters. For example, KC Pet Project had a cat live release rate of 83.5% in 2013. Similarly, the Lynchburg Humane Society only had cat live release rates of 74% and 83% in 2013 and 2014. Both KC Pet Project and Lynchburg Humane Society were considered among the nation’s best shelters during this time period, but these organizations’ older facilities made it more difficult to eliminate disease despite diligent cleaning. Thus, Perth Amboy Animal Shelter’s cat live release rate in 2014 was still pretty good taking into account these other factors.

Perth Amboy Animal Shelter also did a reasonably good job getting cats out of the shelter quickly. In order to do a proper analysis with enough data, I combined 2014 and 2015 cat intake and disposition statistics in the table below. Over this period, the shelter had an 81% cat live release rate. As with dogs, Perth Amboy Animal Shelter did much of the work based on cat adoptions exceeding the number of cats sent to rescues by an 8 to 1 margin. While I target a lower average length of stay for cats in my recent analysis of the state’s shelters, an average length of stay of 61 days for cats (75 days for cats who are adopted out) proves the shelter does not have to hoard cats to save a large percentage of them.

All Cats

Finally, the Perth Amboy Animal Shelter saved 100% of all the other animals coming into the facility during 2013, 2014 and 2015. These animals include rabbits, guinea pigs, ferrets, etc.

Perth Amboy Creates a Welcoming Looking Shelter

Recently, I visited the Perth Amboy Animal Shelter and toured the facility. Immediately, you can see the ACOs created a very welcoming atmosphere with flowers and friendly decorations on the shelter’s front door:

IMG_456521834 Flowers

IMG_456522023

Additionally, during Easter the shelter added holiday festivities to the area near the entrance to create a positive and welcoming atmosphere:

Easter Decorations 3

Inside the shelter, the ACOs and volunteers took the depressing looking shelter and made it look happy. They repainted the dog and cat areas with inviting colors and added cute pictures of animals enjoying themselves:

Before runs

Volunteers Giving Shelter Make Over

Runs

Doggie ISOCat ISo 1

At the beginning of the kennel area, visitors are greeted by a pretty hanging basket of treats. This encourages adopters to interact with the dogs and increases the chance of dogs and adopters connecting with each other. Also, I really liked the positive vibe they created in the meet and greet room for adopters:

Meet & Greet Room

Even the bathroom, which is a very scary place in most shelters, got a complete makeover and looked beautiful:

Restroom

Thus, the ACOs created an inviting shelter where adopters can have a positive experience adding a new member to their families.

In addition, the shelter was extremely clean despite being full due to a large number of dogs coming in just before my visit. The ACOs regularly checked the shelter and cleaned up throughout the day. As a result, the shelter did not have that typical animal shelter smell which helps make it a welcoming place for adopters.

Strong Leadership Creates a Successful Animal Shelter

In order to run a highly effective shelter with a relatively small budget, the ACOs use a number of local high school students to clean the shelter and socialize animals during the week when many adult volunteers work. The students help out at the shelter as part of their required volunteer service to graduate from high school. Not only does this program help run the shelter at a lower cost, but it also helps the community connect with the shelter. For example, families of the students or friends of those families may choose to adopt animals or donate to the shelter. In fact, on the day of my visit a group of grade school students helped plant flowers outside the building:

Student FlowersStudent Flowers 2Student Flowers 3

The ACOs also implemented key programs that help dogs, particularly pit bulls, safely get out of the shelter more quickly. While the facility is small, the shelter has a fenced in yard where dogs can go out and run. Additionally, social dogs can play with other dogs. Playgroups are essential to keeping high energy dogs happy and healthy at shelters and are a common denominator among the nation’s best shelters for pit bull like dogs. Additionally, the ACOs started a foster program for all types of animals that allows animals to leave the shelter sooner. If I calculate the average length of stay based on when dogs left the shelter to go to foster homes rather than their final adoption date (i.e. after going to a foster home), the average length of stay for all dogs and pit bulls would decrease by 3 days and 7 days since the foster program began. Thus, Perth Amboy Animal Shelter created some very positive programs for pit bull like dogs.

Christie clearly demonstrated a passion for what she does and an initiative to improve. During my visit, Christie shared innovative ideas on how she could add space to a pretty small facility. In addition, she told me that the shelter wants to help neuter and release feral cats to assist local TNR advocates in the future. Finally, Christie talked to me about a planned program to allow children to read to shelter animals. Reading programs reduce stress in animals and may help kids gain confidence to speak in front of groups of people.

While I do have some different opinions on tactical strategies to saving lives, the ACOs have an unwavering passion to do the same. In addition to being the Head ACO, Christie runs the shelter’s Facebook page. On her day off recently, she helped catch a dog that was lost for 9 months. Also, Christie, Jackie and Joe often come to volunteer at the shelter on their days off. Most striking was how appalled Christie and Jackie were when I told them how other shelters used frequent killing as a method of population control. Thus, the ACOs clearly have a passion for saving animals and will do what it takes to make sure that happens.

Additionally, the City of Perth Amboy deserves a lot of credit. The Police Department, which oversees the shelter, has been very supportive of the ACOs and their efforts. Similarly, the local government also has stood behind the ACOs as well. The city keeps the facility open more hours than other similarly sized shelters, 10 am – 4 pm weekdays (shifting these hours a little later, say from 1 pm – 7 pm, would make the facility more convenient for adopters who work) and 10 am to 3 pm on weekends. Also, the location is near a commercial area with lots of foot traffic. Thus, the combination of supportive government officials, and competent and passionate ACOs helped turn the shelter around and make the city a role model for others.

Many other people noticed the positive change at the shelter as well:

Perth Amboy Turn Around 2

Perth Amboy Turn Around

Perth Amboy Turn Around 3

People Should Volunteer to Make the Shelter Even Better

While the Perth Amboy Animal Shelter is doing wonderful things, more volunteers can take the shelter to the next level. For example, additional fosters can help get cats out of the shelter more quickly to reduce the number of cats dying and raise the cat live release rate back over 90%. Similarly, volunteers can create a nonprofit to help fund some higher cost care, such as expensive veterinary procedures requiring specialists or a behaviorist for certain dogs needing extensive rehabilitation. Thus, more volunteers can help the shelter raise its live release rate even further.

Volunteers can also help Perth Amboy Animal Shelter save the lives of animals in other communities. To the extent Perth Amboy Animal Shelter can reduce its average length of stay, the facility can contract with additional communities currently served by high kill shelters. For example, if Perth Amboy Animal Shelter’s average length of stay decreased by 50%, the shelter would have the space to handle twice as many animals. Volunteers can help get animals adopted more quickly by taking excellent photos, with a professional photographer being ideal, or creative videos. Similarly, volunteers can help with off-site adoption events or better yet, a satellite adoption center in a Petsmart, Petco or PetValu store. Additionally, volunteers can foster more animals to create more space for the shelter to take in more animals. Also, volunteers can train dogs that stay longer at the shelter to reduce their length of stay. Thus, more volunteers can help the shelter save more animals in many ways.

Volunteers should donate their valuable time to organizations where their contributions will be valued. Clearly, Perth Amboy Animal Shelter is run by passionate and highly skilled animal advocates. In my opinion, this is the type of shelter where volunteers can do more good. Sadly, volunteers at other shelters often have to fight management to save lives. Luckily, central New Jersey has an excellent shelter and people should volunteer at this facility to make a real difference.

Animal Control Shelter Adopts Out Every Single One of Its Pit Bulls

Majority Project

Recently, I heard the claim pit bulls are dying in New Jersey animal shelters due to “overpopulation” and the “average family” not wanting them. These reactions followed my previous blog setting adoption and euthanasia goals for New Jersey animal shelters. While I personally like some of the people making these assertions and agree with them on other issues, I believe this is a dangerous myth that has deadly consequences for pit bulls everywhere. Many shelters have already achieved no kill for their pit bulls despite taking in large numbers of these dogs. In this blog, I’ll explore the notion that the average family (presumably white and middle class) doesn’t want pit bulls so we shouldn’t even bother trying to save them.

Colorado Animal Control Shelter Proactively Works to Save Its Pit Bull Type Dogs

Ark Valley Humane Society serves Chaffee County, Colorado. Chaffee County’s population is 91% white and its poverty rate is below the national average.  Families make up a similar percentage of households as your typical New Jersey suburb. Thus, Chaffee County, Colorado is similar to many New Jersey communities.

Ark Valley Humane Society radically increased its pit bull live release rate in one year. In 2012, 40% of the shelter’s pit bulls were killed. Instead of complaining about “pit bull overpopulation” and “the average family not wanting pit bulls”, Ark Valley Humane Society set a strategic goal to turn their pit bull performance around. The shelter’s strategy focused on a longer term objective of reducing pit bull intake via offering free spay/neuter for pit bulls and a shorter term goal to quickly adopt out pit bulls into loving homes. Ark Valley Humane Society engaged the public, instituted multi-dog playgroups, and trained pit bulls to obey basic commands and become good canine citizens. As a result of these efforts, Ark Valley Humane Society adopted out all 27 pit bulls they took in during 2013.

Ark Valley Humane Society’s description of their efforts is as follows:

We are especially proud of our 2013 Pit-Bull Initiative. Pit-bulls and bully breeds have suffered a negative public perception. Faced with increasing numbers of pit-bulls, AVHS decided to take action to improve this breed’s ability to find forever homes. AVHS began offering free spay/neuter for owned pit-bulls and the pit-bull mixes living in Chaffee County. We have increased emphasis on public education, instituted multi-dog play groups for behavior modification, and formed shelter dog training classes for basic commands and good citizenship. Our efforts have resulted in the adoption of all 27 pit-bull intakes for 2013. No pit-bulls were lost due to ill health or unmanageable aggression issues.

While 27 pit bulls does not sound like a lot of dogs, this is large number for this community. Chaffee County is a sparsely populated area and only has 17,809 residents. The surrounding counties also have a low population density making it unlikely many people from elsewhere would visit this shelter to adopt dogs. This equates to a pit bull intake and adoption rate of 1.52 pit bulls per 1,000 people. As a comparison, I estimate New Jersey animal shelters collectively only take in approximately 1.15 pit bulls per 1,000 people and would only need to adopt out 0.70 pit bulls per 1,000 people to achieve no kill for our state’s pit bulls. Additionally, Ark Valley Humane Society took in 35% more pit bulls during the year they saved all of these dogs compared to the prior year when the shelter killed 40% of its pit bulls. Thus, Ark Valley Humane Society adopted out all if its pit bulls despite taking in significantly more pit bulls per capita than New Jersey animal shelters do as a whole.

Ark Valley Humane Society likely quickly adopted out its pit bulls. While the shelter did not disclose the time it took pit bulls to get adopted, we can come up with a reasonable estimate. Pit bulls made up 6% of all dogs taken in and the shelter’s average length of stay for dogs was 11.8 days. Typically, pit bulls stay 2-4 times longer than other dogs at high performing no kill animal control shelters. Using these numbers and some simple algebra, we can estimate pit bulls took 22.3 days, 31.6 days, and 40 days to get adopted assuming the pit bull average length of stay was 2 times, 3 times, and 4 times longer than other dogs. Even if pit bulls stayed at the shelter 5 times longer than other breeds, pit bulls would only take 47.6 days to get adopted. Furthermore, the fact that all pit bulls impounded in 2013 were adopted out during the year also supports the notion pit bulls left the shelter quickly. As a result, claims that pit bulls take “forever’ to get adopted are simply untrue.

Local Shelters Need to Stop Making Excuses and Work on Saving Our State’s Pit Bulls

Many other shelters are saving their pit bulls. For example, Longmont Humane Society, which serves a similar demographic in a more suburban area of Colorado, saves 96% of its pit bulls and takes in roughly 3 times as many pit bulls per capita than the average New Jersey animal shelter. Kansas City, Missouri’s animal control shelter, KC Pet Project, takes in nearly 3 times as many pit bulls per capita than the typical New Jersey animal shelter and has a pit bull save rate close to 90%. Thus, many shelters across the nation are saving their pit bulls.

Several New Jersey shelters are doing a good job adopting out their pit bulls. Perth Amboy Animal Shelter, which serves an area with a high poverty rate, is likely saving over 90% of their pit bulls based on their overall dog live release rate of 97% and pit bulls probably comprising a substantial percentage of the dogs taken in. For example, if this shelter saved 99% of non-pit bulls, pit bulls would only need to make up 22% or more of the dog intake for the pit bull live release rate to equal or exceed 90%. Not surprisingly, I estimate Perth Amboy Animal Shelter adopted out roughly 40% more pit bulls per capita in 2013 based on the assumptions from my prior blog than the average New Jersey animal shelter needs to do to achieve no kill for pit bulls. Similarly, I estimate Trenton Animal Shelter is adopting approximately 30% more pit bulls per capita than the average New Jersey animal shelter should despite severe space constraints (i.e. which limits adoption potential). Thus, there is no reason other New Jersey animal shelters cannot adopt out more pit bulls.

People truly want pit bull type dogs. Based on recent data, pit bulls are among the three most popular breeds in New Jersey. Given people keep obtaining these dogs, which is often not from shelters, demand clearly exists for pit bulls. Additionally, all sorts of families and people adopt pit bull type dogs. Furthermore, even if the myth that suburban families won’t adopt pit bull type dogs were true, shelters can still adopt out these dogs off-site in nearby urban areas. Thus, New Jersey residents want pit bull like dogs and local shelters need to meet that demand.

Adopting out many sterilized pit bulls to the public will decrease pit bull breeding. Many pit bulls are surrendered to shelters due to owners lacking resources to fix solvable problems. If we can help these people, fewer pit bulls will come into shelters, and people will be more likely to get sterilized pit bulls from shelters in the future. Significantly increasing the number of sterilized pit bulls in the state will decrease the number of pit bulls coming into shelters. Thus, we can save the pit bulls currently in shelters and reduce the number of pit bulls arriving at shelters in the future.

Local animal shelters need to abandon the excuses and help save our pit bulls. Animal Farm Foundation has tons of resources for shelters to use and offers internships to shelter personnel to improve their pit bull adoption rates. Shelters can also contact Executive Directors from successful shelters and seek their advice. Additionally, shelters can bring in Amy Sadler to properly implement multi-dog playgroups. Similarly, organizations can engage no kill consultants, such as Humane Network and No Kill Learning, to provide detailed advice as well. Thus, shelters need to take proactive steps to improve their pit bull adoption rates.

It is time we stopped making excuses and do what is possible. Like Ark Valley Humane Society showed, where these is a will there is way. It is time all shelters do the same.

New Jersey Animal Shelters’ Report Cards for Dogs

report-card

In my last blog, I disclosed New Jersey’s depressing animal shelter statistics. This blog explains why so many dogs are losing their lives in the state’s animal shelters and whether these facilities can end the killing.

Successful organizations set measurable goals and regularly monitor their performance. Examples include financial budgets, customer and employee satisfaction surveys, and product reliability metrics. Unfortunately, many animal shelters for far too long have failed to set lifesaving goals and standards. Municipalities, donors and volunteers need to know where their resources will be best utilized. Time and money are scarce resources and people should allocate these assets to organizations who will best utilize them. As a result, animal shelters need to set goals and hold their leadership and staff accountable for achieving these objectives.

Model Assesses New Jersey Animal Shelters’ Life Saving Performance

In order to assess how good of a job New Jersey animal shelters are doing, I’ve developed an analysis I call the “Life Saving Model.” While shelter performance is dependent on many variables, such as finances, facility design, local laws, etc., the most critical factor impacting potential life saving is physical space. Without having enough physical space, a shelter might not have enough time to find loving homes for its animals. Shelters can overcome financial limitations through creative fundraising or recruiting more volunteers. Similarly, organizations can save their dogs despite having run down facilities if these groups enthusiastically implement policies to get animals into loving homes quickly. As a result, my analysis focuses on making the best use of space to save the maximum number of New Jersey dogs.

The Life Saving Model measures the number of local animals a shelter should adopt out, rescue from other facilities, send to rescues or other shelters, and euthanize. The targeted outcomes take into account each facility’s physical capacity and the number and types of dogs the organization receives from its community (i.e. strays, owner surrenders, cruelty/bite cases). I assume a target euthanasia rate, take the number of dogs actually returned to owners and then estimate how many community dogs a shelter should adopt out. To the extent space runs out, I then calculate how many dogs must be sent to rescue. If the shelter has excess space after properly serving its local community, the facility uses that room to rescue and adopt out dogs from nearby areas. The targeted results calculated from this model are compared to the actual or estimated actual results from each shelter below.

To read specific details and assumptions used in the model, please see the Appendix at the end of this blog.

New Jersey Animal Shelters Contain Enough Space to Save All of New Jersey’s Dogs and Many More from Other States

New Jersey’s animals shelter system has enough space to save all of the state’s healthy and treatable dogs. The table below details the targeted numbers of dog outcomes the New Jersey animal shelter system should achieve. Out of the 27,929 New Jersey dogs coming into the state’s animal shelters in 2013, 13,714 and 3,317 dogs should have been adopted out and sent to other shelters/rescues by the facilities originally taking the dogs in. However, other New Jersey animal shelters had more than enough capacity to rescue the 3,317 dogs from space constrained facilities. Thus, New Jersey animal shelters should be able to able to adopt out every single healthy and treatable dog taken in from the state and not require any support from rescue organizations without physical facilities.

New Jersey animal shelters have enough excess space to save many dogs from out of state as well. Specifically, New Jersey animal shelters had enough physical capacity to rescue and adopt out 12,352 dogs from out of state after achieving a 95% live release rate for New Jersey dogs. To put this number into perspective, New Jersey animal shelters could make both New York City and Philadelphia no kill cities for dogs and increase those cities’ dog live release rates to 95% as follows:

  • New York City – 1,771 additional dogs need saving
  • Philadelphia – 2,937 additional dogs need saving

Additionally, New Jersey animal shelters could save another 7,644 dogs from other locations outside of the state. Of course, some New Jersey animal shelters do pull some dogs from New York City and Philadelphia animal control shelters. However, most of these dogs are likely easy to adopt and therefore have short lengths of stay. As a result, the additional number of dogs New Jersey animal shelters could save from New York City, Philadelphia and elsewhere is probably not much lower than the figure above. Thus, New Jersey animal shelters could make New Jersey a no kill state for dogs as well as many other places.

These adoption goals are quite achievable when comparing the performance of well-run animal control shelters across the country. New Jersey animal shelters would only need to adopt out 3.30 dogs per 1,000 people in the state (1.91 dogs if no dogs rescued from out of state). As a comparison, recent per capita dog adoption numbers from several high performing no kill open admission shelters are as follows:

  • Nevada Humane Society (Reno, Nevada area) – 8.5 dogs per 1,000 people
  • Charlottesville-Albemarle SPCA (Charlottesville, Virginia area) – 9.0 dogs per 1,000 people
  • Longmont Humane Society (Longmont, Colorado area) – 9.1 dogs per 1,000 people

Thus, many communities are already adopting out nearly three times as many dogs as the goal set for New Jersey animal shelters.

Some naysayers may claim New Jersey would have a more difficult time due to the state’s shelters taking in many pit bulls. However, this is a myth. My model estimates New Jersey animal shelters would need to adopt out roughly 0.70 pit bulls per 1,000 people to save 95% of New Jersey’s dogs. Our shelters would only need to adopt out 1.81 pit bulls per 1,000 people if New Jersey shelters also rescued and adopted out the targeted number of pit bulls from other states. As a comparison, I estimate Longmont Humane Society adopts out 2.14 pit bulls per 1,000 people based on its per capita pit bull intake and the percentage dog adoptions are of total outcomes at the shelter. Furthermore, the pit bull adoption targets are even more reasonable given the model assumes there are roughly 2/3 less dogs to compete with in the adoption market in New Jersey than these other locations.

NJ Shelter Model 2013 (Local Targets 2)

Animal Deaths Vary Widely at New Jersey Animal Shelters

The goal of any properly managed animal shelter is to save all of its healthy and treatable animals. In some cases, such as selective admission rescue oriented shelters, it is pretty easy to not kill animals. In addition, other animal shelters with easy to service animal control contracts (i.e. few animals impounded, most strays quickly returned to owners) can avoid unnecessary killing due to having lots of extra space. As a result, some shelters may have an easier time than others in preventing killing at their shelters.

The table below compares the targeted number of community dogs (strays, owner surrenders, cruelty/bite cases) euthanized and the estimated actual local dogs euthanized/killed, and who died or went missing. Consistent with the Life Saving Model’s assumptions, the estimated actual dogs euthanized/killed/died/missing figure assumes these dogs came from the local community. All dogs missing are assumed “dead” based on the assumption they died or went to a very bad place. Shelters having less and more than the targeted amount of dog deaths are highlighted in green and red in the table below.

Surprisingly, several rescue oriented shelters’ death totals exceeded the targeted numbers. While this number may be higher if some rescued dogs are euthanized/killed (i.e. targeted number assumes no rescued dogs are), this may possibly point to overly strict temperament testing at these facilities. In the case of St. Huberts – Madison, which has a total dog death rate of 4% (i.e. percentage of all dogs taken in and not just community dogs), the total death rate may be artificially depressed by easy to adopt transported dogs. For Humane Society of Atlantic County, which has no animal control contracts, the total dog death rate of 24% is shockingly high for a rescue oriented shelter and raises serious questions about how life and death decisions are made by this organization. Other rescue oriented shelters, such as Ramapo-Bergen Animal Refuge and Common Sense for Animals, have significantly fewer deaths than targeted. The aforementioned shelters take a similar percentage of their dog intake from other shelters:

  • Ramapo-Bergen Animal Refuge – 67%
  • Common Sense for Animals – 63%
  • Humane Society of Atlantic County – 67%
  • St. Huberts – Madison – 69%

Thus, I find it difficult to believe St. Huberts – Madison’s and Humane Society of Atlantic County’s larger than expected number of dogs dying or gone missing is due to them rescuing a large percentage of their dogs from other shelters.

The largest number of dogs unnecessarily dying occurred at a relatively small number of shelters. Specifically, 12 out of 98 or 12% of the shelters accounted for 83% of the 3,603 unnecessary dog deaths. Shelters with the greatest number unnecessary dog deaths are as follows:

  • Associated Humane Societies – Newark (553)
  • Camden County Animal Shelter (386)
  • Cumberland County SPCA (346)
  • Gloucester County Animal Shelter (310)
  • Paterson Animal Control (276)
  • Trenton Animal Shelter (220)

Furthermore, if additional unaccounted for dogs discussed in my previous blog are counted in the death totals, the number of unnecessary dogs deaths rises from 3,603 to 4,731 statewide. Associated Humane Societies – Newark’s number of unnecessary deaths jumps from 553 to 805 dogs assuming these additional unaccounted for dogs died.

NJ Shelter Model 2013 for Blog (kill)

NJ Shelter Model 2013 for Blog (kill) (2)

NJ Shelter Model 2013 for Blog (kill) (3)

Space Constrained Facilities Not Receiving Enough Support from Rescues and Other Animal Shelters

Some animal shelters will require more support from rescues and animal shelters with excess space than others. If a shelter has relatively high intake, very limited space, and few stray dogs returned to owners, it will need more help than other shelters. The table below compares the number of dogs a shelter should transfer to other organizations per the model and the number of dogs actually sent to other animal welfare groups. Shelters marked in green are receiving less than the expected rescue support while facilities marked in red are receiving too much rescue help.

Overall, New Jersey shelters are not receiving enough help from other animal welfare organizations. While the overall number of dogs rescued was only about 11%-12% lower than needed, the actual number was higher since many dogs were rescued from facilities who did not need any rescue assistance. Only 16 out of the 102 facilities require any rescue support. In other words, 86 of the 102 animal shelters in the state should not need rescues or other shelters to pull any dogs. As a result, 1,756 dogs were not rescued from shelters who truly need that support and instead were pulled from shelters not requiring this help.

Shelters hogging up the most rescue resources were as follows:

  • Associated Humane Societies – Newark – 276 more dogs transferred than necessary
  • Burlington County Animal Shelter – 112 more dogs transferred than necessary
  • Humane Society of Atlantic County – 112 more dogs transferred than necessary
  • Cumberland County SPCA – 111 more dogs transferred than necessary

On the other hand, many space constrained shelters received far less rescue help than needed. Facilities who received the lowest amount of rescue support in relation to their needs were as follows:

  • Liberty Humane Society – 377 fewer dogs transferred than necessary
  • Trenton Animal Shelter – 252 fewer dogs transferred than necessary
  • Camden County Animal Shelter – 220 fewer dogs transferred than necessary
  • Elizabeth Animal Shelter – 209 fewer dogs transferred than necessary
  • Paterson Animal Control – 194 fewer dogs transferred than necessary

Unsurprisingly, these shelters had some of the highest dog death rates during the year.

Rescue groups and shelters with extra space should pull dogs from kill shelters with the highest rescue “target” numbers and deficits in the table below. If shelters not needing rescue support get that extra help, these shelters will not take the steps necessary to properly run their facilities. As a result of enabling poorly performing shelters and not pulling dogs from truly space constrained facilities, rescuing dogs from shelters with enough space leads to less lifesaving.

Shelters receiving less than needed rescue support should also examine their own policies and performance. Are the shelter’s operating processes allowing too many animals to get sick and therefore discouraging organizations to rescue their animals due to subsequent medical costs? Does the shelter actively reach out to rescues/other shelters and treat them with respect? Does the shelter make it convenient for other organizations to pull their animals?

Given killing animals for space is intolerable, the space-constrained shelters need to expand their effective dog capacity. These facilities could use extra space in their buildings to house dogs on a short-term basis. These shelters can enter into arrangements with local veterinarians to house and adopt out some dogs. Furthermore, shelters can create or expand foster programs to increase the number of dogs cared for. Additionally, creating a pet owner surrender prevention program and making serious efforts to return lost dogs to owners could free up space in these shelters. Finally, space-constrained shelters with multiple animal control contracts should terminate some of these arrangements to bring their capacity for care in line with the number of dogs they take in. As a result, space constrained shelters still need to take active steps to reduce killing rather than simply solely relying on rescue support.

NJ Shelter Model 2013 for Blog (killed)

NJ Shelter Model 2013 for Blog (killed) (2)

NJ Shelter Model 2013 for Blog (killed) (3)

Most New Jersey Animal Shelters Fail to Come Close to Reaching Their Local Dog Adoption Potential

We can assess each shelter’s contribution to making New Jersey and nearby areas no kill. While a shelter may be able to avoid killing healthy and treatable animals, it still may not live up to its potential for adopting out local dogs. On the other hand, a space constrained shelter may kill healthy and treatable dogs, but still do a good job adopting animals out.

The table below compares the number of dogs from New Jersey and nearby states each animal shelter should adopt out with the estimated number of local dogs actually adopted out.

Shelters with very limited space and high kill rates as well as rescue oriented organizations may look better than they actually are. For example, the model assumes the mix of dogs facilities are adopting out are the same as the types of dogs these groups take in. However, if these shelters only adopt out a very small number of dogs due to limited physical capacity, the dogs adopted out may be highly adoptable ones with much shorter lengths of stay compared to the majority of dogs these facilities impound. Similarly, many rescue oriented shelters likely pull much easier to adopt dogs than the bulk of dogs needing to get rescued from local facilities. Thus, the results from shelters with very limited capacity and rescue oriented organizations may look better than they actually are.

Few organizations reached or exceeded their adoption targets. Specifically, only 7 out of 102 shelters met the adoptions goals computed by the Life Saving Model. 2 of the 7 facilities reaching the adoption targets (Denville Township Animal Shelter and Warren Animal Hospital) had very few animals to place. Thus, the overwhelming number of New Jersey animal shelters need to step up their adoption efforts.

Several shelters exceeded their adoption targets. Old Bridge Animal Shelter had the most impressive results by far. This facility adopted out nearly 4 times the number of dogs targeted by the Life Saving Model and only euthanized 1% of all their dogs who had outcomes. Surprisingly, Livingston Animal Shelter adopted out the targeted number of dogs despite having a run down facility with limited adoption hours. The facility may have accomplished this by having a caring animal control officer who could place a relatively small number of dogs. Beacon Animal Rescue also exceeded its adoption target. While this organization is a rescue oriented group, the shelter appears to help more than easy to adopt dogs as pit bull type dogs currently make up about half of their dogs up for adoption. Perth Amboy Animal Shelter also deserves credit for nearly reaching its adoption target while only 3% of its dogs were euthanized. Only a few years before, 25% of Perth Amboy Animal Shelter’s dogs were killed by the prior shelter management.

Liberty Humane Society and Trenton Animal Shelter also exceeded their targeted number of local dog adoptions. These two facilities are space constrained shelters with high kill rates and the dogs they adopted out potentially may have been more adoptable than the bulk of their dogs. In the case of Liberty Humane Society, I’ve anecdotally observed them adopting out a large percentage of pit bulls and believe they are doing a good job on dog adoptions. Either way, both Liberty Humane Society and Trenton Animal Shelter are performing better than many other similar facilities and rescues/other shelters should support these organizations by pulling more dogs from Liberty Humane Society and Trenton Animal Shelter.

Many shelters with the ability to help other local shelters fail to do so. New Jersey animal shelters have the potential to rescue and adopt out nearly 5 times as many dogs as the number of dogs unnecessarily dying in the state’s animal shelters. Approximately 40% of the adoption shortfall is due to shelters not using their existing capacity to adopt out their own dogs or rescue dogs from space constrained nearby facilities. The other 60% of the adoption shortfall is due to shelters not adopting out animals as quickly as these organizations should. Thus, New Jersey animal shelters fail to even come close to their adoption potential.

Associated Humane Societies performance is particularly disappointing. Specifically, Associated Humane Societies has the physical capacity to end the killing of all healthy and treatable dogs in New Jersey. Associated Humane Societies adoption shortfall of 5,453 dogs significantly exceeds the 3,603 dogs unnecessarily losing their lives in New Jersey animal shelters. Even if all three Associated Humane Societies’ shelters used just 50% of their reported dog capacity, the organization could reduce the number of dogs unnecessarily dying in New Jersey animal shelters by nearly half per my model. Furthermore, Associated Humane Societies may put an additional strain on New Jersey’s animal welfare system by sending dogs to other facilities and rescues in the state when Associated Humane Societies has more than enough capacity to handle its dogs. Associated Humane Societies has the funding to reach these adoption targets as the organization took in nearly $9 million of revenue last year. This works out to over $450 of revenue per dog and cat I project the shelter should take in per my Life Saving Model. As a comparison, Nevada Humane Society, KC Pet Project, and Upper Peninsula Animal Welfare Society, which are no kill open admission shelters, took in only $225-$415 of revenue per dog and cat. Activists wanting to increase life saving in New Jersey should focus on changing Associated Humane Societies’ policies given the lifesaving potential of this organization.

Shelters transporting dogs from out of state also significantly failed to achieve their adoption targets for New Jersey dogs. In fact, shelters rescuing dogs from out of state facilities have a New Jersey dog adoption shortfall exceeding the number of New Jersey dogs unnecessarily dying in our state’s shelters. Not surprisingly many of these facilities’ total adoptions including transported dogs exceeded the local dog adoption targets as most transported dogs are easier to adopt. These transporting shelters’ local adoption performance is even worse considering most of these organizations likely take in much more adoptable local dogs than my model targets. In addition, the revenues these transporting shelters bring in from adoption fees and dramatic fundraising stories likely divert funding from New Jersey animal control shelters. Thus, it is quite clear most transporting shelters are not doing their part in helping New Jersey’s homeless dogs.

NJ Shelter Model 2013 for Blog (Loc adop)

NJ Shelter Model 2013 for Blog (Loc adop) (2)

NJ Shelter Model 2013 for Blog (Loc adop) (3)

Shelters Fail to Use Excess Space to Save Local Dogs

To further examine New Jersey animal shelters’ performance in saving the state’s homeless dogs, I compared the targeted number of dogs each shelter should pull from nearby shelters and compared it to the number actually rescued from local facilities. I assume all reported out of state rescued dogs came from southern or other far away states. While some of the out of state rescued dogs may have comes from nearby areas, I believe this is a small number and does not significantly impact the results.

Virtually all New Jersey animal shelters are failing to rescue the number of local dogs they should. 89 of the 102 shelters should rescue some dogs from other local shelters. In fact, 55 of the 89 shelters with targeted excess capacity failed to rescue even a single dog from a New Jersey animal shelter. Of the 89 shelters with the space to rescue dogs from nearby shelters, only Beacon Animal Rescue met or exceeded its local dog rescue target. While Animal Alliance and Ramapo-Bergen Animal Refuge appear to come close to their targeted local rescues, this is most likely due to these organizations pulling relatively few pit bulls. 80% of the targeted rescues are pit bulls while Animal Alliance and Ramapo-Bergen Animal Refuge only appear to have pit bulls representing around 20% of their dogs currently up for adoption. Thus, nearly all New Jersey animal shelters with targeted excess capacity are failing to do their share in ending the killing of local healthy and treatable dogs.

Shelters can overcome challenges in rescuing dogs from outside their service area. In some cases, municipalities may frown on government run shelters using taxpayer funds to rescue dogs from elsewhere. However, shelter directors at these facilities can encourage individuals to form a non-profit or raise money on their own to pay for these rescued dogs. Additionally, shelters with limited capacity or even some of the well-off private shelters could contribute funding for each dog rescued. For example, Maddie’s Fund paid an approximate $160 subsidy to rescues pulling dogs from New York Animal Care & Control. Similarly, private shelters with excess space, but limited financial resources, could expand their fundraising efforts to save more local dogs. Thus, perceived obstacles to rescuing local dogs can and should be overcome.

NJ Shelter Model 2013 for Blog (Rescued)

NJ Shelter Model 2013 for Blog (Rescued) (2)

NJ Shelter Model 2013 for Blog (Rescued) (3)

New Jersey Animal Shelters Need to Form Life-Saving Coalitions

The improper allocation of space within the state’s animal shelter system requires organizations to form coalitions. While putting a competent and compassionate director in every shelter would likely be even more effective, that will likely take time to do. No kill coalitions between animal control facilities and selective admission shelters have been used in places, such as Portland, Oregon, Reno, Nevada, Jacksonville, Florida and Austin, Texas to radically increase life saving. Maddie’s Fund, which has supported using coalitions for over a decade, has many resources for organizations seeking to collaborate with each other. Thus, New Jersey animal shelters need to formally work together, develop quantifiable and measurable goals (such as the targeted outcomes in this blog), and hold each organization accountable for meeting these goals.

Sobering Results Require Shelter Leaders to Critically Examine Themselves

New Jersey animal shelters’ dismal performance is even worse considering I used conservative assumptions. Organizations were not expected to return additional lost dogs to owners despite room for significant improvement. The targeted adoption lengths of stay ranged from 34-40 days for dogs taken in from the local community and 44 days for dogs rescued from other local shelters. However, some no kill open admission shelters adopt dogs out much more quickly. For example, I estimate dogs only take about 15 days to get adopted at Williamson County Animal Shelter in Texas based on their operating data and total average length of stay. Similarly, some no kill open admission shelters, such as Greenhill Humane Society and KC Pet Project, adopt out their pit bulls in much less time than the benchmark shelters used in this analysis. 50 days was used in my model, but Greenhill Humane Society’s and KC Pet Project’s (estimated) corresponding figures are around 40 days and 19 days. Additionally, creating successful pet retention and targeted spay/neuter programs could reduce local intake and allow shelters to rescue more dogs from elsewhere. Thus, New Jersey animal shelters could save significantly more animals than the targeted numbers I computed.

Shelters should examine the reasons why their adoption numbers fall far short of these benchmarks. In some cases, shelters, such as Woodbridge Animal Shelter, need to expand the hours they are open for adoptions. Many shelters should switch from an overly judgmental adoption process based on black and white rules to a conversational one focused on educating the adopter. Organizations will need to radically increase their off-site events and do same day adoptions. Similarly, many shelters must reduce adoption fees and run frequent promotions. Executive Directors should monitor the latest life-saving programs on Maddie’s Fund’s, ASPCA Pro’s, and the Best Friends National Conference’s web sites and put some of these policies into place. Shelter management teams will need to ensure their facilities are clean and customers are treated with respect (this can be measured by encouraging the public to complete surveys). Thus, poorly performing shelters need to stop making excuses and do what it takes to reach their adoption potential.

Shelters truly wishing to save lives should be ecstatic with the results from this analysis. The organizations have the potential to save far more lives than they ever thought were possible. Will the leaders of these facilities take the initiative to improve their performance as anyone with a job outside of animal sheltering would do? Thousands of lives depend on the answer to this question.

We should support shelters financially and with our precious free time who answer this question correctly. Ralph Marston said:

Don’t lower your expectations to meet your performance. Raise your performance to meet your expectations. Expect the best of yourself, and then do what is necessary to make it a reality.

We can turn New Jersey, New York City and Philadelphia into no kill communities. It is time we give our money and volunteer efforts to organizations who raise their performance to help us reach that goal. To do otherwise, would betray all the animals whose lives are on the line.

Appendix – Life Saving Model Assumptions

The Life Saving Model utilizes the following basic animal shelter population equations to calculate the targeted dog outcomes for each facility:

Daily capacity or population = Daily animal intake x average length of stay

Average length of stay = Daily capacity or population/daily intake

Each shelter’s community dog intake (i.e. owner surrenders, strays, cruelty bite cases), number of dogs returned to owners, and maximum dog capacity were taken from its 2013 “Shelter/Pound Annual Report” submitted to the Office of Animal Welfare. Unfortunately, 2014 data will not be available until Fall 2015.

This data was then used as follows:

  • Community dog intake and dogs returned to owners were initially estimated for each month by dividing the annual figures by 12. In order to take into account the extra space in low intake months and reduced space in high intake months, we multiply that number by each month’s percentage of the average month. For example, assume 240 dogs were taken in during the year and the average month equals 20 dogs (240/12). In July, the dog intake is 120% higher than the average month and we therefore multiply 20 dogs by 1.2 to equal 24 dogs. If 120 dogs were returned to owners during the year, the estimated number of dogs returned to owners in July would equal 12 dogs (120/12 = 10; 10*1.2). The monthly intake percentages were based off 2013 dog intake data on the New York Animal Care & Control web site.
  • The estimated number of community dogs returned to owners each month are then assumed to stay 5 days on average at shelters based on data from other shelters across the country. If anything, this estimate is conservative (i.e. average length of stay for dogs returned to owners may be less than 5 days and therefore frees up more shelter space for adoptions) based on some shelters returning the bulk of their dogs to owners within 3 days.
  • The number of community dogs euthanized (including animals who died or are missing) is set to equal 5% of intake. 5% is a reasonable standard euthanasia rate for shelters in New Jersey to meet given few vulnerable stray puppies (i.e. who could die or require euthanasia) arrive in the state’s animal shelters. The average length of stay for euthanized dogs is assumed to equal 14.5 days. Half of dogs are assumed euthanized for untreatable aggression towards people and 21 days is the time estimated to make that determination. The other half of dogs are assumed euthanized for severe and untreatable health issues and I estimate these dogs are euthanized after 8 days (subsequent to the end of the stray and owner surrender hold periods).
  • Adopted dogs are assumed to stay at shelters for varying lengths of time. Adoption length of stay was based on data from a study in the Journal of Applied Animal Welfare and the figures used are located in a prior blog on pit bull adoption. The data primarily comes from Tompkins County SPCA during a time it saved over 90% of its dogs. This was a fairly conservative data set to use as other no kill open admission shelters’ average length of stay are substantially shorter. Specifically, the following assumptions were made:
    1. 80% and 20% of each communities dogs (including pit bulls) were adults 1 year and older and under 1 year.
    2. Pit bulls were assumed to comprise 50%, 35% and 25% of community dog intake at poor, middle/upper middle class, and wealthy area animal control shelters. While some shelters may have pit bulls comprising more than 50% of their shelter dog population at a given time, this is due to pit bulls longer average length of stay. For example, a shelter with pit bulls making up 50% of their dog intake and pit bulls having an average length of stay three times longer than other dogs will have pit bulls constituting 75% of the dog population. Shelters without animal control contracts were assumed to only have pit bulls make up 10% of their community dogs (i.e. strays and owner surrenders) based on most of these shelters’ highly selective admission practices.
    3. Pit bull length of stay was taken directly from the Journal of Applied Animal Welfare study. The average lengths of stay for other breeds from this study were averaged and used for dogs other than pit bulls in the analysis
  • Dogs transferred to rescue or other facilities are assumed to stay at shelters 8 days on average based on the assumption strays can’t be released until the 7 day hold period elapses.
  • Community dogs not returned to owners or euthanized are initially assumed as adopted for each month. However, if the calculated length of stay exceeds the shelter’s required length of stay, dogs are moved from adoption (i.e. with a longer length of stay) to rescue (i.e. shorter length of stay) until the calculated length of stay each month approximately equals the required length of stay.
  • Required length of stay = Shelter’s reported capacity/adjusted daily intake for the month. Adjusted daily intake for month = Adjusted monthly intake per first bullet above/the number of days in the month.
  • Shelters with excess capacity are assumed to use the extra space to rescue and adopt out dogs from other New Jersey animal shelters. To the extent all healthy and treatable New Jersey animal shelter dogs are saved, I assume additional dogs are pulled from nearby states with similar types of dogs. I assume all rescued dogs will not be killed since the transferring and receiving shelters should evaluate these dogs’ behavior. Based on pit bull type dogs having longer lengths of stay at shelters, I assume 80% of dogs rescued from local animal shelters are pit bulls and 20% are non-pit bulls. 80% and 20% of pit bull and non-pit bull type dogs are considered 1 year and older and under 1 year. The average length of stay for rescued pit bulls and other dogs are the same as above.
  • Each month’s targeted outcomes are added to determine how many local dogs New Jersey animal shelters should adopt out, send to rescue, rescue from other nearby animal shelters and euthanize.

Role Model Shelter Saves Its Pit Bulls

DSC_0109

Earlier this year, I wrote a blog on how many progressive open admission animal shelters are saving all of their pit bull type dogs. One of these progressive facilities was Colorado’s Longmont Humane Society. Longmont Humane Society’s Executive Director, Elizabeth Smokowski, was kind enough to share some data with me showing how impressive this facility is.

Longmont Humane Society places all of its savable pit bulls in a very short period of time. Based on raw data provided to me, Longmont Humane Society saved 96% of its pit bull type dogs impounded in 2014 (through November 21). Additionally, pit bulls on average only stay at the shelter for 33 days. As a comparison, Longmont Humane Society saves 98% of its non-pit bull type dogs and non-pit bull type dogs stay on average around 9.5 days at the shelter. Both pit bull type dogs and other kinds of dogs are saved at rates far exceeding the typical 90% threshold required for no kill status. Thus, Longmont Humane Society does an amazing job for all of its dogs.

Longmont Humane Society impounds far more pit bull type dogs than New Jersey animal shelters. Through November 21, Longmont Humane Society impounded around 430 pit bull type dogs this year (483 annualized). This equates to 3.59 pit bull type dogs per 1,000 people in Longmont Humane Society’s service area. As a comparison, Associated Humane Societies – Newark, which many people believe impounds extraordinary numbers of pit bulls, only takes in 2.06 pit bull type dogs per 1,000 people in its service area assuming 50% of impounded dogs are pit bull type dogs. Thus, Longmont Humane Society impounds far more pit bull type dogs than New Jersey’s urban shelters “filled with pit bulls.”

Longmont Humane Society Performance with Pit Bull Type Dogs Dispels Many Excuses Shelters Use for Killing or Refusing to Rescue Pit Bull Type Dogs

Pit bull type dogs are adopted quickly at Longmont Humane Society. Assuming a similar percentage of pit bull type dogs and all dogs are returned to owners (i.e. 35.6% of all dogs with outcomes) and those dogs are returned to owners in 5 days on average (i.e. Longmont’s hold period policy), we can estimate pit bull type dogs take 48.5 days to get adopted. However, pit bull type dogs likely take less time to get adopted than 48.5 days due to fewer pit bull type dogs probably getting returned to owners. Restrictive landlord policies often force owners to surrender their pit bull type dogs to shelters and such dogs typically aren’t returned to owners. Furthermore, breed-specific legislation in nearby communities may also result in more owners surrendering their pit bulls. With such a high save rate, many dogs likely require physical and/or behavioral rehabilitation and Longmont Humane Society still successfully adopts its pit bull type dogs out quickly. Thus, Longmont Humane Society has a high pit bull live release rate and quickly adopts out its pit bull type dogs.

Longmont Humane Society has a high pit bull live release rate and quickly adopts its dogs out despite the shelter having lots of pit bulls. Many shelters argue they have to kill or can’t rescue pit bulls due to having too many pit bulls. Longmont Humane Society’s pit bulls and other breeds short lengths of stay prove this is a meritless claim. For example, we can estimate the percentage of pit bull type dogs in Longmont Humane Society’s shelter and foster care dog population by using pit bull and non-pit bull lengths of stay and standard shelter population equations. Based on this data, 45% of Longmont Humane Society’s dog population at the shelter and in foster care should be pit bull type dogs. Furthermore, the large number of pit bulls do not negatively impact adoptions of other breeds given the non-pit bulls length of stay only averages 9.5 days. Unlike many shelters who complain about too many pit bull type dogs coming in and being forced to kill or warehouse scores of them, Longmont Humane Society rolls up its sleeves and saves these dogs.

Winning Strategies Save at Risk Dogs

Longmont Humane Society actively tries to return lost dogs to their owners. Returning lost dogs to owners is often the quickest way to get stray dogs safely out of the shelter. While Longmont Humane Society does not disclose its return to owner rate (i.e. dogs returned to owners/stay dogs taken in), it likely has a high return to owner rate given 35.6% of all dogs received (i.e. strays and owner surrenders) are returned to owners. The shelter’s web site lists lost pets both at the shelter and found by private individuals in the community. The animals can be sorted by type of animal and/or sex to allow someone to quickly find their lost family member. Additionally, people can report lost pets electronically on the shelter’s web site which can help the shelter quickly match lost dogs with their families. Thus, Longmont Humane Society takes active measures to help families find their lost pets.

Longmont Humane Society makes huge efforts at rehabilitating dogs at the shelter and in the community. Amy Sadler instituted her Playing for Life program at Longmont Humane Society several years ago. This program uses playgroups to give shelter dogs much needed exercise, which reduces stress, and increases adoptability. Furthermore, the shelter has a world class behavioral rehabilitation program helping dogs overcome treatable issues and trains other shelters in these methods. All dogs adopted from Longmont Humane Society come with lifetime behavioral support from the people running this program. Even more impressive, Longmont Humane Society provides reasonably priced classes to the public to help their dogs become model canine citizens. For example, Longmont Humane Society only charges $10 for one hour supervised playgroups designed to socialize dogs. Additionally, the shelter also offers a free new adopter workshop for Longmont Humane Society adopters (adopters from other shelters only pay $10). Thus, Longmont Humane Society makes great efforts to help dogs become emotionally healthy and build strong community support.

The shelter put into place many other innovative programs to adopt animals into loving homes. Longmont Humane Society uses foster families to help animals become more healthy, both physically and mentally, and therefore adoptable. In 2013, 656 animals or around 19% of all animals taken in spent time in foster homes. Longmont Humane Society rightly adheres to breed-neutral policies at the shelter focusing on individual behavior rather than breed labels. Also, Longmont Humane Society walks dogs outside the shelter with “Adopt Me” vests and gives interested people information about adopting. The adoption section of Longmont Humane Society’s web site is very user-friendly and allows people to quickly sort dogs who are good with other dogs or cats. Finally, the shelter has 850 active volunteers who logged over 59,000 hours helping the shelter last year. Thus, Longmont Humane Society uses a variety of innovative programs to save lives of all types of dogs.

Longmont Humane Society is a goal oriented organization. The shelter has a strategic plan for 2012-2018 listed on their website laying out measurable goals with specific deadlines. For example, Longmont Humane Society is seeking to reduce its average length of stay for dogs from 18 days to 9 days and for cats from 28 days to 14 days while maintaining no kill level save rates by 2018. Frankly, most shelters would be ecstatic with the old lengths of stay and would sit on their laurels. However, Longmont Humane Society continues to improve and has made substantial progress towards achieving its goal by reducing its average length of stay for dogs from 18 days to 14 days and for cats from 28 days to 21 days in two years. Another goal, using a mobile outreach program to help adopt animals out to underserved communities by 2018, will likely significantly reduce average length of stay for pit bull type dogs even further. Longmont Humane Society also has a goal to maintain a 95% adopter satisfaction rating on surveys and another goal to measure customer satisfaction for other programs, such as training, by 2017. Finally, the shelter lays out specific goals for attracting the best employees and financial performance. This focus on excellence allowed the shelter to turn its financial performance around while it was in danger of bankruptcy and continue improving its service to the community. Thus, Longmont Humane Society’s success with pit bull type dogs is a function of a goal oriented organization focused on continuously improving.

Longmont Humane Society proves that focusing on excellence yields impressive achievements. For far too long, most shelters have not set standards or goals and unsurprisingly fail to save their animals. Longmont Humane Society saves its pit bull type dogs and places them quickly despite taking large numbers of these dogs in and facing a severe financial crisis. Shelters need to drop the excuses for killing pit bull type dogs and do the hard work necessary to save them. Ghandi once said “The true measure of any society can be found in how it treats its most vulnerable members.” Pit bulls are the most vulnerable dogs in shelters and we should judge shelters on how they treat these animals. We know these dogs can be saved. Will those with the power to save pit bull type dogs do so or will the killing and excuses continue to win out at most shelters?

Merritt Clifton Uses Manipulative Math to Try and Discredit Nathan Winograd and No Kill

Renowned no kill and pit bull hater, Merritt Clifton, recently wrote an article downplaying Nathan Winograd’s no kill success. Clifton uses manipulative math and logic to argue Nathan Winograd’s no kill equation leads to less lifesaving than spay and pray and other archaic shelter policies.

Analysis Focuses on Shelter Animal Deaths Per 1,000 People Rather than Save Rates

Clifton bases his entire argument on shelter animal deaths per 1,000 people rather than shelter save rates. Per capita shelter kill rates certainly are an important statistic as they provide a perspective to the amount of killing in a community. However, per capita rates of shelter killing tell us nothing about how shelters are doing. Per capita shelter killing may decrease due to spay/neuter rates in the community at large, which may be due to socioeconomic status of the population or access to affordable spay/neuter resources outside of the shelter, or other external forces having nothing to do with shelter performance. Additionally, per capita kill rates tell us nothing about an animal’s prospects once it lands in a shelter. In other words, a shelter can kill a large percentage of the animals coming though its doors, but still have a low per capita kill rate. People want their shelters to save most of the animals coming into their facility. Animals having little chance of making it out alive of shelters rightfully disturbs many people. Thus, any comparative analysis of shelter performance must include save rates.

Clifton’s Own Preferred Metrics Show Nathan Winograd’s and No Kill’s Superior Performance

Clifton’s entire argument using total change in per capita kill rates ignores basic logic of any intelligent analysis. In a stunning example of lazy or deliberately deceptive logic, Clifton takes gross changes in per capita kill rates to assert Nathan Winograd wasn’t very successful. Unfortunately, the per capita kill rates were much different in these analyses and they require percentage change analysis. Specifically, per capita kill rates were so much higher in Clifton’s counterexamples to Nathan Winograd’s work at the San Francisco SPCA and Tompkins County SPCA that these kill rates had far more room to decline. However, we clearly can see Nathan Winograd outperformed Clifton’s counterexamples on an apples and apples comparison using percentages.

Clifton’s first misleading example compares Nathan Winograd’s performance at the San Fransisco SPCA with shelters nationally during the same period. As you can see, shelters nationally were killing far more animals than San Fransisco and therefore could decrease shelter killing in total more. However, we see on a percentage basis Nathan Winograd outperformed these shelters by nearly a 3-1 margin.

Merritt Clifton Nathan Winograd Analysis SF SPCA V1

Clifton’s second example is even more misleading. In this example, Clifton compares Nathan Winograd’s improvement in total per capita kill rate in San Fransisco with the period after he left. Clifton not only fails to use percentages, but uses a longer period to show Nathan Winograd’s results were not impressive. Once again, we clearly see the flaw in Clifton’s analysis when we compare the results on a percentage improvement per year basis. Specifically, Nathan Winograd’s save rate was 33% better per year. Additionally, Clifton fails to mention the per capita kill rate decrease at San Fransisco SPCA after Nathan Winograd left largely reflected lower intake, which has been a nationwide trend, and the save rate (percentage of animals impounded leaving alive) has not improved since Nathan Winograd left nearly a decade and a half ago. Clifton also failed to point out San Francisco’s save rate stagnated despite save rates nationwide dropping significantly during that same period.

Merritt Clifton Nathan Winograd Analysis SF SPCA V2

Clifton uses a similar misleading example comparing Nathan Winograd’s performance at Tompkins County SPCA with the period before he arrived. Once again, Clifton uses total rather than percentage improvement in per capita shelter killing rates and periods of differing length. After we adjust for these analytical errors, we see Nathan Winograd reduced per capita shelter killing at a rate over 6 times greater per year:

Merritt Clifton Nathan Winograd Analysis Tompkins

Finally, Clifton posts the most egregious of all comparisons. He compares the era of regressive kill shelter legend, Phillis Wright, with the era of Nathan Winograd’s No Kill Advocacy Center. In addition to the analytical errors above, Clifton also mistakenly assumes all shelters today are following the no kill equation. Even with this assumption stacked against no kill, the per capita kill rate decreased twice as much per year since the No Kill Advocacy Center’s arrival:

Merritt Clifton Nathan Winograd Analysis PW

Nathan Winograd and No Kill Had More Challenging Obstacles to Overcome

Nathan Winograd had to use new techniques to decrease shelter killing. In the previous periods, such as during Phyllis Wright’s era, spay/neuter rates were quite low. All shelters needed to do was point people where to get spay/neuter done and that alone would significantly decrease kill rates. For example, spay/neuter rates were quite low in the early 1970s, but currently dog and cat spay/neuter rates are up to 83% and 91% per nationally per the ASPCA. Additionally, shelters in Phyllis Wright’s era could easily adopt more animals out as massive numbers of highly adoptable animals were killed then. As a result, Nathan Winograd needed to enact innovative programs to further decrease killing. These policies required far more work, and hence met more resistance, from regressive and lazy shelter directors. Thus, Nathan Winograd decreased the rate of killing in a much more challenging environment.

Clifton makes another egregious error by claiming Tompkins County SPCA was doing great before Nathan Winograd arrived and achieving no kill was basically a piece of cake. Specifically, Clifton states the shelter had a below average per capita kill rate during that time. Based on Clifton’s per capita kill rate of 1.8 and Nathan Winograd’s 93% save rate at Tompkins County SPCA, that equates to an intake of 25.7 dogs and cats per 1,000 people. Tompkins County SPCA’s per capita intake during Nathan Winograd’s time was nearly twice the national per capita intake rate of 14 dogs and cats per 1000 people today per Clifton’s former newspaper. Assuming the per capita intake rate was the same during the year before Nathan Winograd arrived at Tompkins County SPCA, the Tompkins County kill rate would have been approximately 30%. Based on Austin Pets Alive’s data, most of the improvement from reducing the kill rate from 30% to 7% would have been due to saving more challenging animals, such as underage puppies and kittens, critically ill or injured animals and animals with behavioral problems. Thus, Nathan Winograd faced a far more difficult challenge if Tompkins County SPCA was doing as great as Clifton claims.

Finally, Clifton fails to mention the animals amazingly short average length of stay at Tompkins County SPCA under Nathan Winograd’s leadership. Nathan Winograd’s animals stayed on average 8 days at Tompkins County SPCA despite the facility being old and rundown when Nathan Winograd arrived. Clearly, getting nearly all of the animals safely out of your facility in 8 days on average would yield no kill results at almost any shelter.

Clifton Makes a 180 Degree Turn on Nathan Winograd

Merritt Clifton praised Nathan Winograd quite a bit not too long ago. In 2008, Clifton concluded his review of Nathan Winograd’s book, “Redemption, The Myth of Pet Overpopulation and the No Kill Revolution in America” by saying:

The loose ends barely matter. Winograd’s arguments would be only strengthened by using better data–and as it stands,  Redemption is probably the most provocative and best-informed overview of animal sheltering ever written.

Similarly, Clifton stated the following when Nathan Winograd ran Tompkins County SPCA:

Animal People, an independent publication, rated the Tompkins County Society for the Prevention of Cruelty to Animals as having the lowest number of animals euthanized per capita in the nation for the past two years. While the national average is 15 animals killed per 1,000 people, Ithaca had 1.9 in 2002 and 1.8 in 2003, said Merritt Clifton, editor of Animal People.

“It’s impressive to see an agency performing 10 times better than the national average,” Clifton said. “Knowing that the local SPCA is doing all it can to save the lives of the dogs or cats raises the level of the community’s satisfaction in the care for its animals.”

Clifton’s about face is quite telling. While we don’t know what is inside Mr. Clifton’s head, clearly Clifton has become anti-no kill. Most likely no kill is at odds with Mr. Clifton’s goal of eradicating pit bull type dogs. After all, numerous open admission shelters achieved no kill for pit bull type dogs alone. At the same time, Clifton has long been an animal welfare “journalist” and supporting outright killing of all pit bulls conflicts with that aspect of his career. Clifton’s play then would be the backdoor eradication through his vocal calls for pit bull sterilization using the bogus claims its for the protection of pit bulls. Thus, advocating only for spay and pray policies is how Clifton can reconcile his pit bull eradication position and his reputation as an animal welfare “journalist.”

Merritt Clifton’s donors for his new web site fit nicely into this ideology. Not surprisingly, Colleen Lynn, who runs the anti-pit bull dogbites.org website, donated to Clifton’s endeavor. The most telling donor is Ruth Steinberger, who advocates spay/neuter as the primary solution to shelter killing. However, Steinberger also believes shelters should NOT adopt out pit bulls using PETA like logic that all of them will be adopted by dog fighters:

“There is no other breed where people go to the shelter to victimize the animal,” said Steinberger.

As such, you just need to follow the money to see where Clifton’s positions come from. Luckily, Clifton no longer is the primary animal shelter commentator in the digital age. Additionally, Clifton’s sloppy and misleading analyses have further brought him to irrelevance. Thankfully, people finally see Clifton for what he truly is.