Most New Jersey animal shelters voluntarily report detailed data to state authorities. Last September, I shared the 2014 summary statistics for New Jersey animal shelters on my Facebook page. Each year, the New Jersey Department of Health requests each licensed animal shelter in the state to submit animal shelter data for the previous year. Animal shelters voluntarily submit this data in the “Shelter/Pound Annual Report.” The New Jersey Department of Health takes these Shelter/Pound Annual Reports and compiles the number of dogs, cats and other animals impounded, redeemed, adopted and euthanized to prepare its Animal Intake and Disposition report. However, the Shelter/Pound Annual Reports include additional information on how animals were impounded (i.e. strays, owner surrenders, rescued from in-state facilities, rescued from out of state shelters, and cruelty/bite cases) and disposed of (i.e. returned to owner, adopted, sent to rescue/another shelter, and died/missing). Additionally, the Shelter/Pound Annual Reports include the number of animals in shelters at the beginning and end of the year as well as the maximum number of animals facilities can hold. Thus, the Shelter/Pound Annual Reports include very important data not found in the New Jersey Department of Health’s summary report.
I compiled the data from these reports and analyze the results in this blog. 2014 statistics for each New Jersey animal shelter are listed at this link.
Garbage Data Raises Serious Questions About New Jersey Animal Shelters’ Statistics
Several animal shelters, which reported statistics in prior years, failed to submit data in 2014. Specifically, Livingston Animal Shelter, Hunterdon Hills Animal Hospital, All Pets Veterinary Hospital and Warren Animal Hospital disclosed this data in 2013, but did not do so in 2014. These shelters failure to disclose data raises serious questions. For example, are they trying to hide embarrassing statistics from the public?
Most New Jersey animal shelters do not properly account for their animals. Simple math dictates the number of animals at a facility at the beginning of the year, plus all animals coming in during the year, less all animals leaving for the period, should equal the number of animals a shelter has at the end of the year. Stunningly, 67 out of 96 shelters reporting these dog statistics and 68 out of 95 facilities submitting this cat data failed to get this right. This raises serious questions about the accuracy of these shelters’ reported statistics. Even worse, 42 of the 67 shelters with flawed dog statistics and 43 of the 68 facilities with incorrect cat statistics should have had more animals at the end of the year then reported. While these errors could have been due to incorrect counts of the number of animals at facilities, the more likely answer is many outcomes, such as animals killed, dying, or gone missing, were not recorded. Given 63% of the errors were due to shelters having less rather than more animals on hand at the end of the year than they should have had lends credence to the theory that errors were mostly due to shelters failing to account for various outcomes. To put it another way, 2,699 cats and dogs should have had outcomes reported and did not. Thus, there is the potential that as many as 2,699 additional dogs and cats were killed, died or went missing from New Jersey animal shelters than were reported in the last year.
Shelters may have failed to classify animals adopted out and sent to rescue properly. Both Paterson Animal Control and Elizabeth Animal Shelter reported no animals were sent to rescues and all dogs and cats leaving their facilities alive were owner reclaims or adoptions. However, rescues I know who work closely with these two facilities told me both shelters rarely adopt animals directly to the public. This makes sense as neither shelter advertized animals for adoption (i.e. no adoption web site or social medial pages run by the two shelters) in 2014. One has to wonder how many other facilities failed to properly classify adoptions and rescues properly. This data is very important as it provides details on the burden rescues and other shelters are taking from these facilities.
We need better oversight of New Jersey animal shelters’ data reporting. Currently, these statistics are voluntarily reported and most shelters are not taking this seriously. For example, I noticed a large number of reports were submitted many months after the end of the year. This data should be easy to compile since facilities can utilize animal shelter software programs, some of which are free, to do this task. Furthermore, New Jersey animal shelter laws mandate facilities maintain much of the raw data found in the Shelter/Pound Annual Report. Unfortunately, New Jersey Department of Health inspections routinely find shelters do not properly keep records on animals. We need to make the Shelter/Pound Annual Report mandatory for animal shelters along with serious penalties for significant errors (especially if deliberate). In order for animal shelters to take data reporting seriously, we may also need to require audits of these reports. Thus, these results show we need stronger laws and the New Jersey Department of Health to play a greater role in ensuring reported animal shelter statistics are in fact accurate.
Despite the errors in these reports, the data provided still reveals important information.
More Animals Losing Their Lives in New Jersey Animal Shelters Than Disclosed in Summary Report
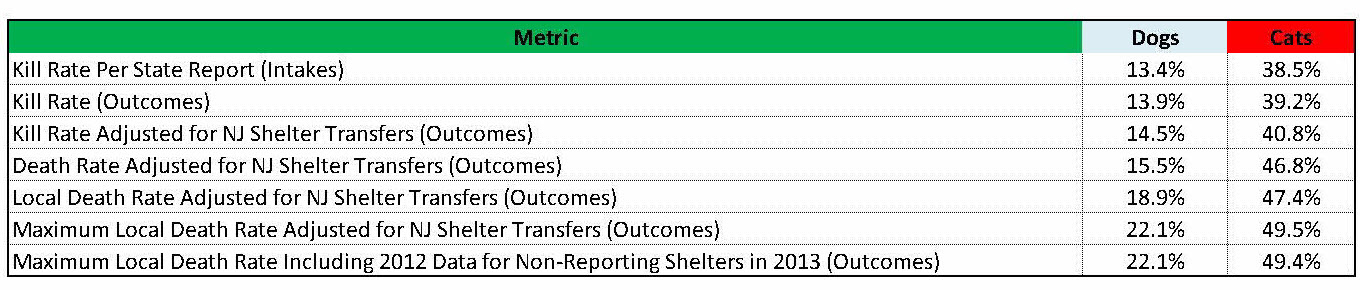
The more detailed data in the Shelter/Pound Annual Reports allows one to more critically examine the percentage of locally impounded animals dying in New Jersey’s animal shelters. The following table summarizes my analysis of the kill/death rate calculated from the New Jersey Department of Health’s summary report and the data reported in the Shelter/Pound Annual Reports.
 The Animal Intake and Disposition report prepared by the New Jersey Department of Health only allows one to calculate the number of animals killed as a percentage of total animals impounded or intake. I prefer calculating the kill rate as a percentage of outcomes rather than intake as this metric directly compares positive and negative outcomes. Using intake depresses the kill rate since shelters can simply hold animals for a long time to the point of overcrowding. Calculating kill rate based on outcomes rather than intake increases the cat kill rate from 34.6% to 35.2% and the dog kill rate remains the same.
To calculate the statewide kill rate, we must also back out transfers from one New Jersey animal shelter to another state facility to avoid counting animals still in the state’s shelter system or registering two outcomes for the same animal (i.e. one New Jersey animal shelter transfers a dog or cat to another state facility who then adopts out the animal). This adjustment increases the dog kill rate from 13.5% to 14.2% and the cat kill rate from 35.2% to 37.4%.
In addition, we should increase the kill rate for animals who died or went missing in shelters. I label this metric the death rate as these animals are likely dead or in a very bad situation. After making this adjustment, the dog death rate increases from 14.2% to 14.8% and the cat death rate rises from 37.4% to 43.4%.
Also, many shelters transport easy to adopt animals from out of state which artificially increases live release rates. To properly calculate the percentage of New Jersey animals losing their lives, we need to adjust for transports. Unfortunately, shelters don’t break out their save rates by local and out of state animals. However, most likely nearly all of the out of state animals (primarily puppies and easy to adopt dogs) make it out of shelters alive. Therefore, I back out the number of out of state transports to estimate the local death rate except for St. Hubert’s. Since St. Hubert’s subsequently transfers many of these animals to other shelters, I only subtract out the number of dogs St. Hubert’s rescues from out of state less the dogs it transfers to other shelters. This adjustment increases the New Jersey dog death rate from 14.8% to 17.7% and the state cat death rate from 43.4% to 43.8%.
Also, I estimate a maximum local death rate by including the number of unaccounted for animals described in the section above. Making this adjustment increases the maximum potential New Jersey dog death rate from 17.7% to 20.6% and the maximum potential state cat death rate from 43.8% to 47.3%.
Some animal shelters quickly return large percentages of their animals to owners. At these shelters, the populations served are typically well-off and animals are licensed and have microchips. To account for the animals facilities actually have to shelter, I calculated a death rate for non-reclaimed animals and a maximum potential death rate for non-reclaimed local animals. The non-reclaimed death rate and maximum potential death rate for dogs is 20.9% and 31.7%. Non-reclaimed cats had a 44.8% death rate and a 48.9% maximum potential death rate. Thus, the percentage of New Jersey animals losing their lives in our state’s animal shelters may be much higher than previously thought.
Overall, the statewide statistics showed little improvement from 2013. The dog death rate in 2014 only was three tenths of one percent lower than 2013. While the maximum potential dog death rate was 3.4 percentage points lower in 2014, we don’t know whether that is due to better record keeping or actually improved life saving. The cat death rate and maximum potential death rate decreased by 3.4% and 4.2%. The growing acceptance of TNR likely slightly decreased the percentage of cats losing their lives in New Jersey animal shelters this year. That being said, the improvements were very small and the percentage of dogs and cats losing their lives in the state’s animal shelters is still way too high.
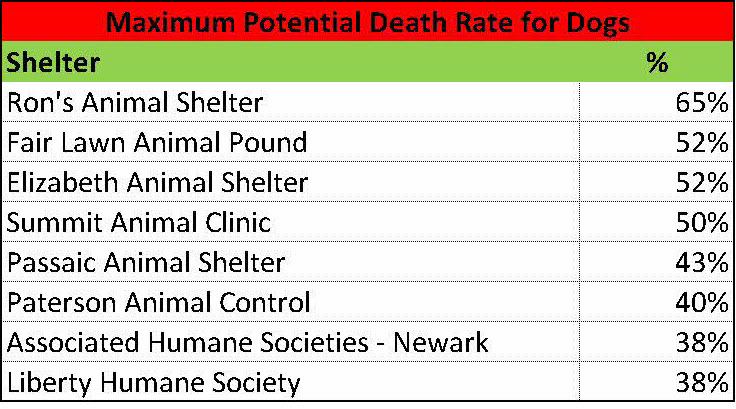
Death Rates Extremely High at a Number of New Jersey Animal Shelters
Dogs and cats are likely to lose their lives or go missing at a number of New Jersey animal shelters. Shelters with the highest death rates for dogs and cats (excluding very low intake facilities) are listed in the following tables:


Thus, both dogs and cats have a very good chance of leaving many New Jersey animal shelters dead rather than alive.
In terms of raw numbers, the following shelters had the most animals lose their lives or go missing:


Many shelters fail to account for large numbers of their animals. As discussed above, a shelter’s number of animals at the end of the year should be calculated as follows:
Beginning number of animals + animals impounded – animals leaving the shelter
Unfortunately, a large number of shelters take in far more animals than they can explain where they went. Shelters having the highest numbers of unaccounted for dogs and cats are listed in the following tables:


Dog and cat death rates at many shelters may be even higher if these unaccounted for animals are counted as dead or missing. If we only consider animal shelters which reported transporting few or no animals in 2014, facilities with the highest dog and cat death rates considering the unaccounted for animals described above are as follows:


Thus, the plight of dogs and cats may be far worse in New Jersey animal shelters when we consider the unaccounted for animals.
Shelters Turn Their Backs on New Jersey’s Animals
New Jersey animal shelters rescue far more animals from out of state than other New Jersey animal shelters. Specifically, 5,090 dogs were transferred from out of state animal shelters compared to only 1,692 dogs taken in from other New Jersey animal shelters. The number of out of state dogs transported into New Jersey decreased in 2014, but that is due to problems at Jersey Animal Coalition and Helmetta Regional Animal Shelter during the year. These problems likely resulted in fewer transported dogs. However, Jersey Animal Coalition, which is now closed, did not report any statistics for 2014. Furthermore, Helmetta Regional Animal Shelter erroneously reported it transported no dogs during 2014 as the facility imported many dogs from the south before the shelter’s problems received media attention in the summer of 2014. Thus, the decrease in transports is likely due to a combination of incorrect reporting and increased regulatory pressure on these two shelters that transported many dogs into New Jersey.
While perhaps some shelters, such as Animal Alliance in Lambertville, take animals from nearby New York or Pennsylvania animal control shelters, the overwhelming majority of these dogs most certainly came from down south. In fact, New Jersey animal shelters transported more dogs from out of state than dogs who were killed in, died in and went missing from New Jersey animal shelters. This number does not include additional dogs transported in from out of state by rescues operating without a physical facility. Shelters transporting the most dogs from out of state were as follows:

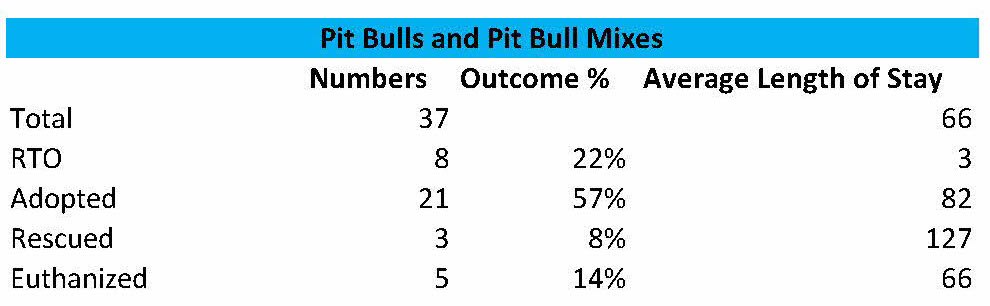
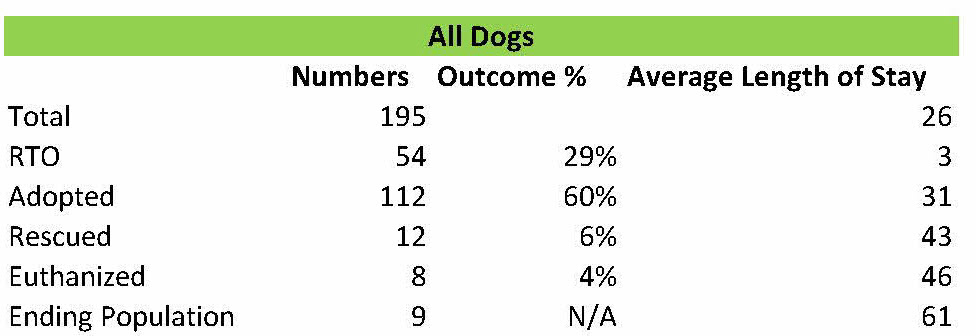
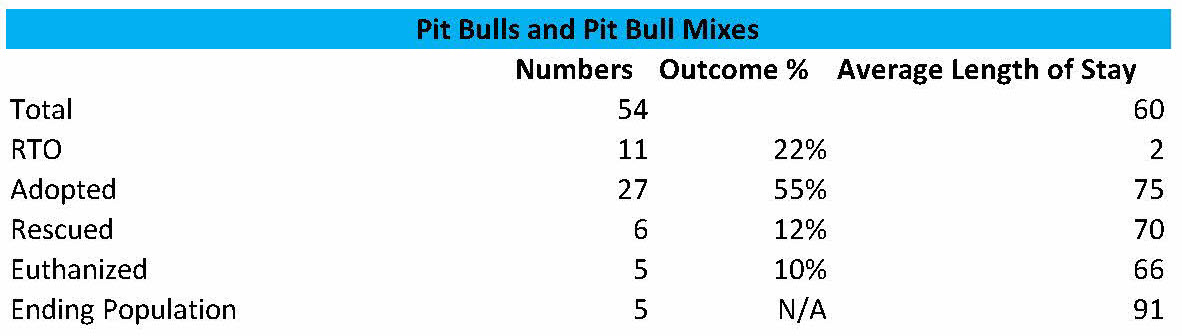
Return to Owner Rates Better Than Average at Most Shelters
Return to owners (“RTO”) rates are one of the positive results from this analysis. Overall, the dog and cat RTO rates of 55% and 5% are approximately twice the national average. As I noted in my blog on reuniting lost pets with owners, return to owner rates are highly correlated with socioeconomic status. Wealthier people likely have more resources/knowledge to license and microchip their dogs. Similarly, people with greater incomes are more likely to afford reclaim fees or ransom payments to animal shelters. New Jersey’s RTO rates for dogs clearly fit this pattern with shelters serving wealthy towns returning most stray dogs to owners while many urban shelters are only returning about around a quarter of lost dogs to owners. Clearly, we need to help people in urban areas get microchips and ID tags on their dogs. Additionally, we need to create pet help desks at shelters in these cities to help people pay the reclaim fees, which are often mandated by the cities themselves, when necessary. The statewide cat reclaim rate, like figures from across the nation, is still very low and suggests shelters need to figure out better ways to get lost cats back to their families. New Jersey should allow shelters to transfer stray cats to rescues during the mandatory 7 day hold period since few are returned to owners at shelters. This would open up space to save more cats and reduce the chance of disease (i.e. cats spending less time in shelters are not as likely to get sick).
To get a better idea how organizations are doing with animals they actually have to shelter, I also examined what percentage of non-reclaimed dogs lose their lives at each facility. Shelters with the highest non-reclaimed dogs death rates are as follows:

Shelters with the highest maximum non-reclaimed local dogs death rates are as follows (excluding facilities that reported transporting many dogs and taking very few animals in):

Shelters Leave Animal Enclosures Empty While Dogs and Cats Die
New Jersey animal shelters fail to use their space to save animals. Based on the average number of animals at all of New Jersey’s animal shelters at the beginning and the end of 2014, only 53% of dog and 65% of cat capacity was used. Given December is a low intake month, I also increased these populations to an average intake month. This adjustment only raised the dog and cat capacity utilization to 62% and 85%. These estimates likely overestimate the average capacity utilized as many facilities kill animals once they reach a certain population level. Many animal shelters with low kill rates failed to rescue animals with their excess space. Additionally, other shelters used little of their available space and still killed a large percentage of their animals. Some examples after increasing the population (and therefore capacity utilization) based on the adjustment discussed above are as follows:


Thus, many New Jersey animal shelters are killing dogs and cats despite having ample space to house these animals.
New Jersey’s animal shelters continue to fail the state’s animals. The state’s animal shelters only impound 9.0 dogs and cats per 1,000 New Jersey residents. If we just count animals originating from New Jersey, the state’s animal shelters only impound 7.9 dogs and cats per 1,000 people. As a comparison, the average community in the country impounds anywhere from 14-30 animals per 1,000 residents based on estimates from Animal People Newspaper and the Humane Society of the United States. Despite New Jersey shelters impounding a fraction of the animals other no kill communities take in on a per capita basis, the state’s animal control facilities continue to kill and allow animals to die under their care. Even worse, many of these shelters can’t even properly keep track of how many animals leave their facilities dead or alive. Our state’s animals deserve far better treatment than this. Contact your local city council members and mayor and demand better from the animal shelter serving your community. We can do so much better and it is time our shelters operate this way.