January 21, 2022 Update: Subsequent to the analysis I conducted below, St. Hubert’s-Madison submitted its statistics to the New Jersey Department of Health and the state health department revised its summary report on the state animals shelters‘ statistics. While I updated the state’s shelter statistics in the link below, the analysis in this blog was not revised.
In 2019, New Jersey animal shelter statistics improved modestly. This decrease in killing was driven by shelters taking fewer dogs and cats in.
2020 was the most unusual year in the history of animal sheltering. The COVID-19 pandemic caused many shelters to restrict animal intake and the public, who were home more, lost fewer pets and fostered more animals. As a result, shelters took significantly fewer animals in and had more open animal enclosures than in the past.
How did New Jersey animal shelters perform in 2020 compared to 2019? What caused these changes? What shelters had positive and negative impacts on the state’s kill rates in 2020?
Killing Decreased Significantly in 2020
The tables below summarize the statewide dog and cat statistics in 2020 and 2019. To see how I calculate the various metrics, please review the footnotes in this link and my blog analyzing the 2015 statistics. You can view the full 2020 statistics here and the statistics 2019 here.
Unfortunately, many shelters did not report 2020 data. In 2019, 92 and 90 shelters reported dog and cat statistics. However, only 66 and 65 shelters did so for dogs and cats in 2020. In fact, I’ve never seen nearly as many shelters fail to report data in the seven years I’ve been analyzing the state’s animal shelters. Furthermore, large shelters, such as St. Hubert’s, Burlington County Animal Shelter, Montclair Township Animal Shelter, Mt. Pleasant Animal Shelter, Clifton Animal Shelter and SAVE – Friends to Homeless Animals did not report numbers. As such, I compared the 2020 New Jersey animal shelter statistics to both the full 2019 statistics and the 2019 statistics with only the same shelters that shared data in 2020 in the state summary tables below. Also, the tables detailing the outcomes and individual shelters below only reflect shelters reporting data in both years.
The dog statistics improved in 2020 with the metrics improving at a much faster rate than in the prior year. Most dog kill rates decreased at two to three times the rate those kill rates decreased in 2019 verses 2018. However, the non-reclaimed kill rate decreased at four times the rate that metric decreased in 2019 verses 2018. On the other hand, the maximum kill rate metrics, which assume unaccounted for animals lost their lives, decreased at a far slower rate compared to the prior year.
When we only look at shelters that reported data in both years, the changes were a bit greater. Most dog kill rates decreased at three times the rate those kill rates decreased in 2019 verses 2018. However, the non-reclaimed kill rate decreased at 11 times the rate that metric decreased in 2019 verses 2018. On the other hand, the maximum non-reclaimed kill rate metric slightly increased in 2020 verses 2019.
The cat statistics improved in 2020 at even a faster rate than dogs compared to the prior year. Overall, the 2020 verses 2019 kill rates decreases were around four to eight times the decreases in 2019 verses 2018. If we just look at shelters that reported data in both years, the kill rates decreased at around 5-12 times as much as those rates did in the prior year.
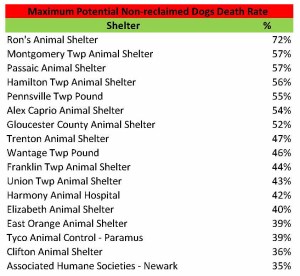
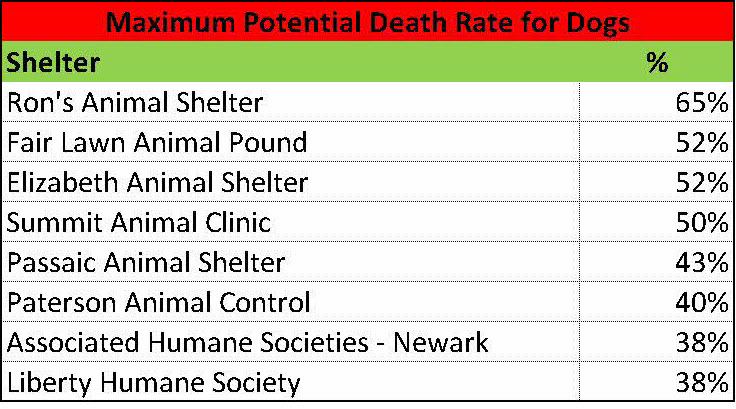
While the state’s kill rates suggest the state may be close to achieving no kill, many individual shelters have high kill rates and still kill healthy and treatable animals. My next blog will highlight those facilities.


Decreased Intake Results in Fewer Killed Dogs
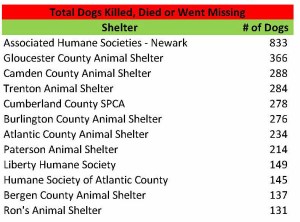
The statewide dog kill rate decreased due to New Jersey animal shelters taking fewer dogs in. New Jersey animal shelters reported killing 600 fewer dogs (710 dogs if we assume the animals in “Other” outcomes died). However, New Jersey shelters’ live outcomes all decreased. Interestingly, the number of dogs transferred to rescues and other shelters only decreased slightly. Given New Jersey animal shelters fell far short of my dog adoption targets I set for 2019, these results are deeply disappointing. Therefore, New Jersey animal shelters killed fewer dogs due to these facilities taking fewer dogs in rather than saving more dogs.

The following shelters contributed most to the decrease in the statewide dog kill rate.

The table below provides insight as to why these shelters decreased the statewide dog kill rate the most. As you can see, all the shelters except for Vorhees Animal Orphanage, which are relatively large, had kill rates much greater than the state average in 2019 and those kill rates decreased significantly in 2020. All the shelters except for Vorhees Animal Orphanage had fewer outcomes primarily due to decreased dog intake, but the decrease for most of these facilities was not much different than the statewide decrease in intake. On the other hand, Vorhees Animal Orphanage had a lower than average dog kill rate and increased the number of animal outcomes in 2020. Therefore, this shelter had a greater impact on the state’s dog kill rate in 2020.

The following table explains why these shelters’ kill rates decreased. Overall, the number of dogs transferred increased or only decreased slightly at a number of these shelters despite taking significantly fewer dogs in. In particular, Associated Humane Societies-Newark, Bergen County Animal Shelter and Southern Ocean County Animal Facility significantly increased the number of dogs transferred. Several shelters also had slight increases and slight decreases in owner reclaims despite significant decreases in dog intake, but this had a negligible effect on the state’s dog kill rate. Unfortunately, all the shelters except Vorhees Animal Orphanage and Passaic Animal Shelter, had adoptions decrease at a greater rate than the decrease in their dog intake. Overall, live outcomes went down in 2020 at these shelters, but the decrease was small enough relative to the decrease in total outcomes to reduce the statewide dog kill rate.

Other Shelters Increased the Statewide Dog Kill Rate
While the statewide dog kill rate dropped in 2020, several shelters partially offset this decrease. Specifically, the following shelters increased the dog kill rate, but this was more than offset by the facilities above.

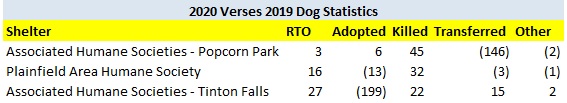
The following table provides more details on these shelters. All three shelters’ kill rates increased in 2020 from levels that were under 10% in 2019. However, in 2020 all three shelters had kill rates well above the state average. Since Associated Humane Societies-Newark transferred many dogs and its kill rate decreased, its possible its sister shelters, Associated Humane Societies-Popcorn Park and Associated Humane Societies-Tinton Falls, killed some of these dogs. Finally, Plainfield Area Humane Society had more outcomes in 2020 while the state as a whole had a significant decrease. Therefore, this shelter, which had an above average kill rate, had a greater impact on the state kill rate in 2020 than in 2019.

The table below explains why several of these shelters’ dog kill rates increased. Associated Humane Societies-Popcorn Park transferred significantly fewer dogs to rescues and other shelters. Plainfield Area Humane Society adopted out and transferred fewer dogs despite taking more dogs in. Finally, Associated Humane Societies-Tinton Falls adopted out significantly fewer dogs.
Cat Killing Drops Due to Lower Intake
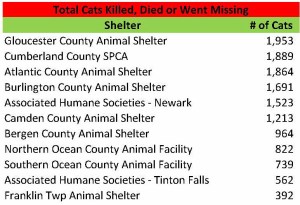
New Jersey animal shelters killed fewer cats in 2020 than in 2019 primarily due to taking fewer cats in. Total cat outcomes decreased by 9%, but cat adoptions and cats transferred only dropped by 0% and 2%. While the Shelter/Pound Annual Reports shelters fill out do not include a separate category for animals who died or went missing, shelters include these animals in the “Other” outcomes line. If we take out the cats from “Other” outcomes that certain shelters separately disclosed as TNR, “Other” outcomes (which should mostly represent cats who died or went missing) decreased by 248 cats. Thus, shelters killed fewer cats in 2020 primarily due to lower cat intake.

The following shelters decreased the statewide cat kill rate the most.

The following table provides insight as to why these shelters decreased the statewide cat kill rate the most. As you can see, all the shelters except for Homeward Bound Pet Adoption Center and Monmouth SPCA had high kill rates, which were 17% to 48%, in 2019, and all reported decreases in those kill rates during 2020. Most of the shelters also had fewer outcomes, which was greater on a percentage basis than the decrease statewide, primarily due to decreased cat intake. Therefore, these higher kill shelters made up a smaller portion of cat outcomes in the state and that partially decreased the statewide cat kill rate in 2020.
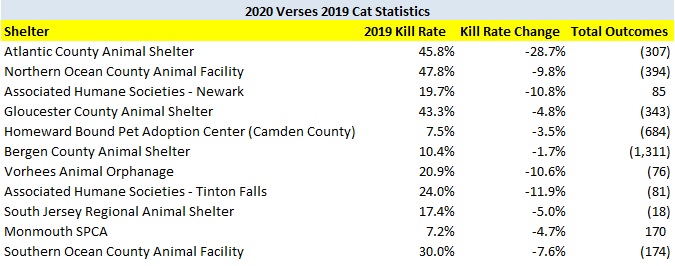
The table below explains why these shelters’ kill rates decreased. Overall, all the shelters either increased their live outcomes (i.e. Atlantic County Animal Shelter, Associated Humane Societies-Newark, South Jersey Regional Animal Shelter and Monmouth SPCA) or reported fewer live outcomes. The shelters with greater live outcomes had higher increases in transfers than adoptions. However, the shelters that had fewer live outcomes had their cats killed decrease at a greater rate. Therefore, these shelters’ kill rates decreased due to taking fewer cats in.

Other Shelters Increased the Statewide Cat Kill Rate
While the statewide cat kill rate decreased in 2019, several shelters partially offset this decrease. Specifically, the following facilities increased the cat kill rate, but this was more than offset by the shelters above.
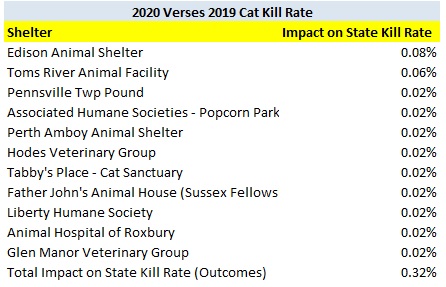
The following table provides more details on these shelters. All the shelters except Associated Humane Societies-Popcorn Park had higher cat kill rates in 2020 compared to 2019. In the case of Associated Humane Societies-Popcorn Park, it had significantly more outcomes in 2020 verses 2019 and made up a larger portion of the state’s cat kill rate in 2020 than in 2019.
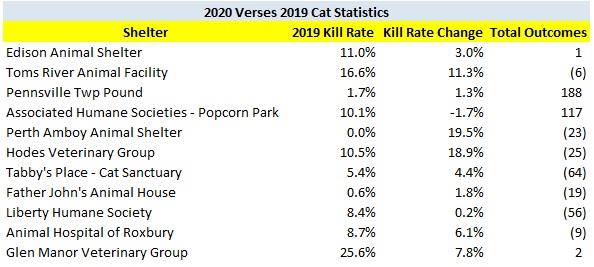
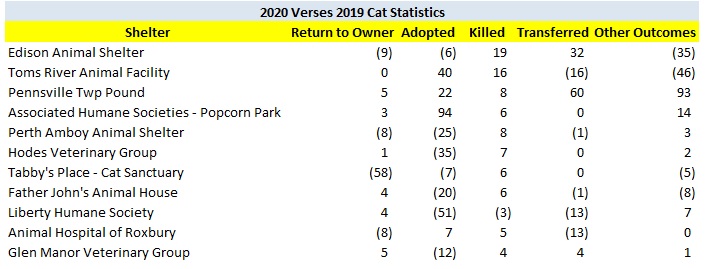
The table below explains why these shelters’ kill rates increased. Edison Animal Shelter’s and Toms River Animal Facility’s kill rates increased largely due due to a decrease in other outcomes, which could mean fewer cats died or were neutered and released. Pennsville Township Pound’s cat kill rate increased primarily due to live outcomes not increasing enough relative to the increase in total outcomes. Cat kill rates at Perth Amboy Animal Shelter Hodes Veterinary Group, Father John’s Animal House, Liberty Humane Society and Glen Manor Veterinary Group increased due to these shelters adopting out fewer cats. Tabby’s Place’s increased cat kill rate was due to fewer cats returned to owners. Animal Hospital of Roxbury’s cat kill rate increased due to it sending fewer cats to rescues and reduced owner reclaims.
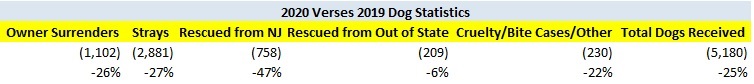
Shelters Impound Less Dogs and More Cats
The tables below detail the change in dog and cat intake at New Jersey shelters in 2020 verses 2019.
Overall, New Jersey animal shelters took in 5,180 less dogs during 2020 than in 2019. New Jersey animal shelters took in 2,881 and 1,102 fewer stray and owner surrendered dogs during 2020 than in 2019. The state’s shelters took 26% fewer dogs in as owner surrenders and 27% fewer stray dogs. While managed intake programs can decrease owner surrenders, they do not affect stray numbers. Therefore, the decrease in stray dog intake may be related to decreased animal control efforts, animal control officers returning dogs to owners in the field (not counted as shelter intake) or simply fewer stray dogs. If ACOs really are not impounding dogs that need help or ones that are a public safety threat, that does not help people or animals. Given the 26% and 27% decreases in owner surrendered and stray dogs was around the same as the 24% decrease among shelters nationally using PetPoint software, it does not seem if New Jersey animal shelters as a whole restricted intake more than shelters from elsewhere. However, we should monitor this number in the future and determine why stray dog intake is decreasing.
New Jersey animal shelters rescued far fewer dogs from New Jersey in 2020. Overall, the number of dogs rescued from other New Jersey animal shelters decreased by 758 dogs or 47%. On the other hand, dogs rescued from out of state only decreased by 209 dogs or 6%. While this decrease may be partially due to lower dog intake, the fact that some shelters still killed dogs (see my next blog) and the much greater percentage decrease in dogs rescued from New Jersey animal shelters compared to the decreases in total dog intake and dogs rescued from out of state suggests New Jersey animal shelters could have saved more local dogs.
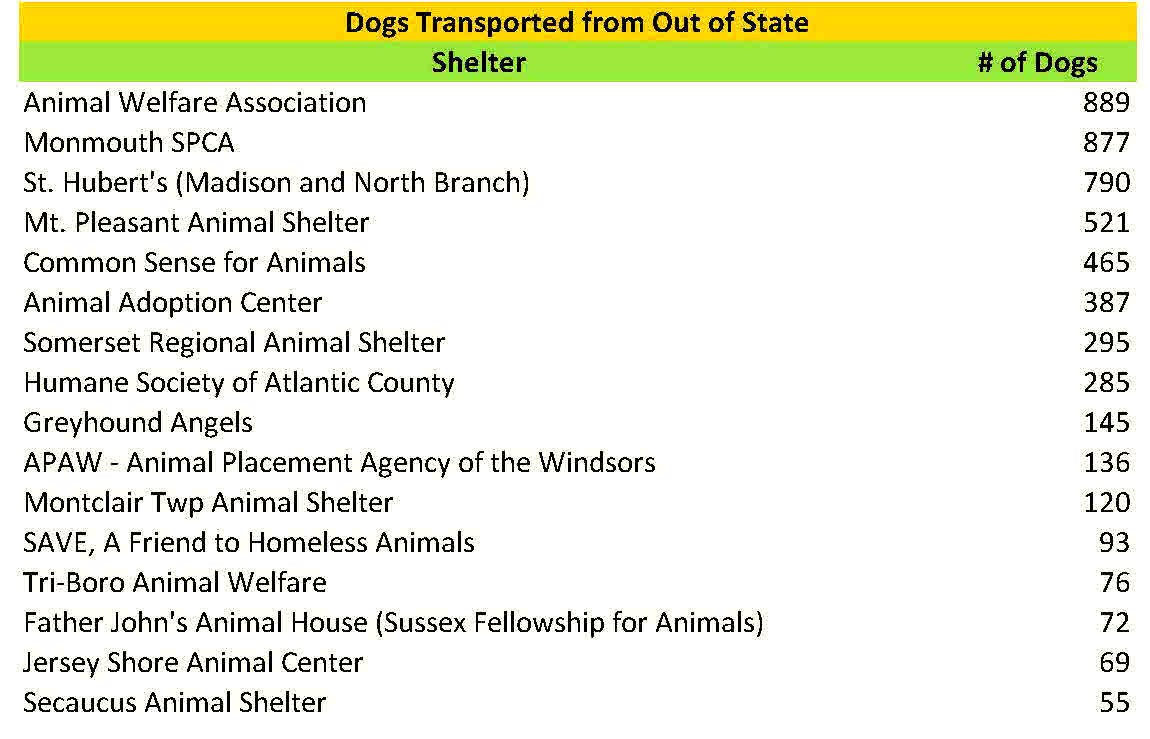
New Jersey animal shelters impounded fewer cats in 2020 than in 2019. The decrease in cat intake was driven by a 5,165 decrease in stray cat intake due to the pandemic. However, this 19% decrease in stray cat intake was similar to the 21% decrease in stray cat intake by shelters using PetPoint software. On the other hand, owner surrenders and cats rescued from New Jersey increased. However, the number of cats rescued from out of state skyrocketed and was not much lower than the number of cats rescued from New Jersey animal shelters.

Advocacy Works
Clearly, growing animal advocacy efforts are pressuring shelters to improve. Individuals contacting their elected representatives puts pressure on shelters to do better. Similarly, donors communicating their concerns to privately run facilities also makes it difficult for these organizations to not make positive changes. Most importantly, this pressure provides strong incentives to these shelters to work with boots on the ground animal advocates, such as TNR groups, rescues and shelter volunteers. Thus, the synergistic efforts of no kill advocates and people working directly with animals helped drive the state’s improved animal sheltering statistics.
That being said, the reduced positive outcomes for dogs and cats is a troubling sign. Shelters can’t permanently rely on fewer animals coming in and heavily rely on rescues to reduce killing. In fact, shelters may have had a false sense of security with the reduced animal intake as many shelters in New Jersey and elsewhere are complaining about having too many animals now as the nation opens up. Unfortunately, many New Jersey animal shelters used pandemic restrictions as an excuse to not be open to the public or limit their operating hours. Instead, these facilities must enact the 11 No Kill Equation programs to generate more live outcomes. Specifically, New Jersey animal shelters must invest in behavioral programs to treat dogs who need help and do a much better job adopting out dogs. Additionally, these shelters must enact better medical protocols for cats and implement large scale TNR and Return to Field programs. Otherwise, shelters will reach a plateau and not increase their live release rates anymore.


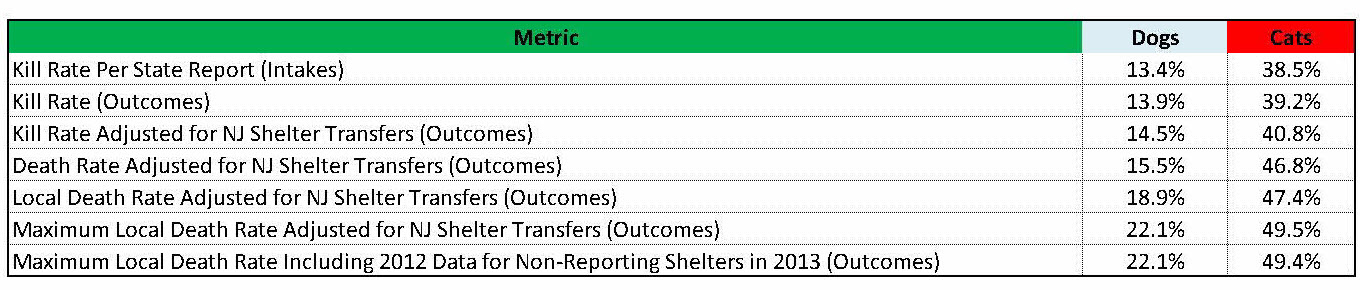
 The Animal Intake and Disposition report prepared by the New Jersey Department of Health only allows one to calculate the number of animals killed as a percentage of total animals impounded or intake. I prefer calculating the kill rate as a percentage of outcomes rather than intake as this metric directly compares positive and negative outcomes. Using intake may depress the kill rate since shelters can simply hold animals for a long time to the point of overcrowding. Calculating kill rate based on outcomes rather than intake increases the cat kill rate from 28.0% to 28.2% and the dog kill rate remains the same.


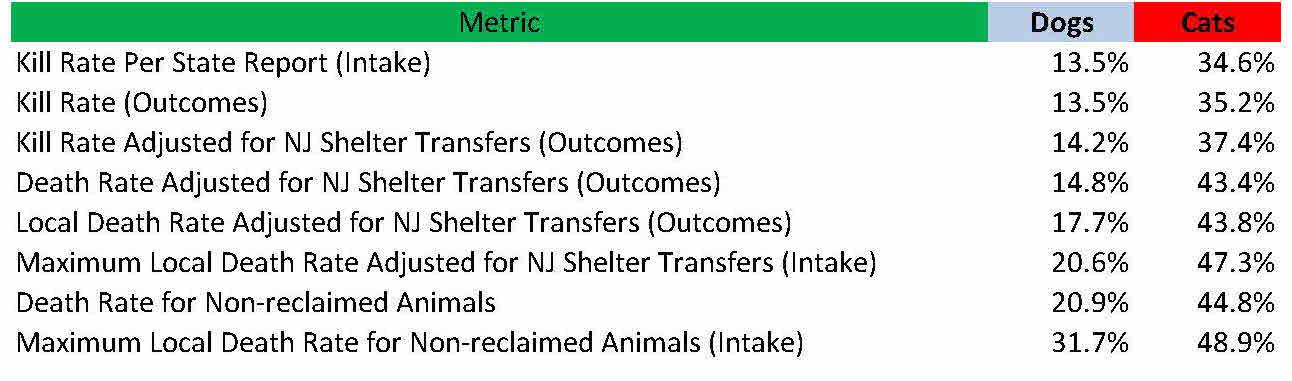 The Animal Intake and Disposition report prepared by the New Jersey Department of Health only allows one to calculate the number of animals killed as a percentage of total animals impounded or intake. I prefer calculating the kill rate as a percentage of outcomes rather than intake as this metric directly compares positive and negative outcomes. Using intake depresses the kill rate since shelters can simply hold animals for a long time to the point of overcrowding. Calculating kill rate based on outcomes rather than intake increases the cat kill rate from 34.6% to 35.2% and the dog kill rate remains the same.