January 21, 2022 Update: Subsequent to my original analysis, St. Hubert’s-Madison submitted its statistics to the New Jersey Department of Health and the state health department revised its summary report on the state animals shelters‘ statistics. As a result, I updated this blog for the St. Hubert’s-Madison data.
Recently, I wrote a blog discussing decreased killing at New Jersey animal shelters in 2020. This blog will explore the 2020 statistics in more detail and assess the current status of the state’s animal shelters.
Most New Jersey animal shelters voluntarily report detailed data to state authorities. Earlier this year, I shared the 2020 summary statistics for New Jersey animal shelters on my Facebook page. Each year, the New Jersey Department of Health requests each licensed animal shelter in the state to submit animal shelter data for the previous year. Animal shelters voluntarily submit this data in the “Shelter/Pound Annual Report.” The New Jersey Department of Health takes these Shelter/Pound Annual Reports and compiles the number of dogs, cats and other animals impounded, redeemed, adopted and euthanized to prepare its Animal Intake and Disposition report. However, the Shelter/Pound Annual Reports include additional information on how animals were impounded (i.e. strays, owner surrenders, rescued from in-state facilities, rescued from out of state shelters, and cruelty/bite cases/other) and disposed of (i.e. returned to owner, adopted, sent to rescue/another shelter, and died/missing/other outcome). Additionally, the Shelter/Pound Annual Reports include the number of animals in shelters at the beginning and end of the year as well as the maximum number of animals facilities can hold. Thus, the Shelter/Pound Annual Reports include very important data not found in the New Jersey Department of Health’s summary report.
I compiled the data from these reports and analyze the results in this blog. 2020 statistics for each New Jersey animal shelter are listed at this link. You can also view each “Shelter/Pound Annual Report” at this link.
Garbage Data Raises Serious Questions About New Jersey Animal Shelters’ Statistics
Most New Jersey animal shelters do not properly account for their animals. Simple math dictates the number of animals at a facility at the beginning of the year, plus all animals coming in during the year, less all animals leaving for the period, should equal the number of animals a shelter has at the end of the year. Stunningly, 36 out of 66 shelters reporting these dog statistics and 42 out of 65 facilities submitting this cat data failed to get this right. This raises serious questions about the accuracy of these shelters’ reported statistics. 24 of the 36 shelters with flawed dog statistics and 23 of the 42 facilities with incorrect cat statistics should have had more animals at the end of the year than reported. While these errors could have been due to incorrect counts of the number of animals at facilities, these shelters may have not recorded outcomes, such as animals who were killed, died, or went missing. To put it another way, 1,302 cats and dogs should have had outcomes reported and did not. Thus, there is the potential that as many as 1,302 additional dogs and cats were killed, died or went missing from New Jersey animal shelters than were reported in 2020.
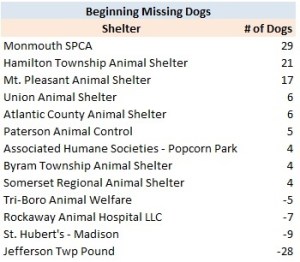
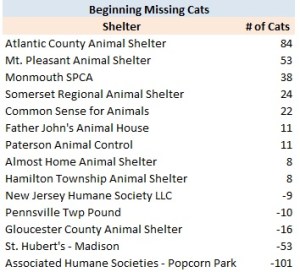
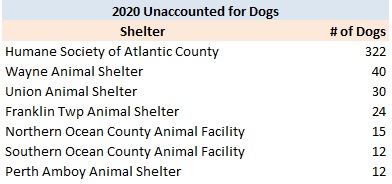
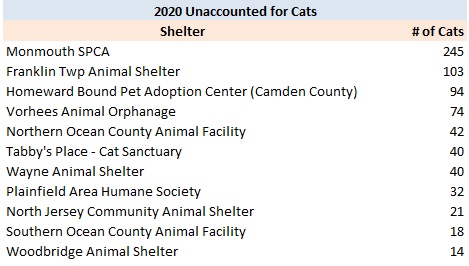
Even worse, a number of animal shelters reported having a different number of animals at the end of 2019 and at the beginning of 2020. Obviously, shelters should report the same number of animals at the end of the prior year and the start of the current year. However, 33 of 65 shelters reported different numbers of dogs at the end of 2019 and the beginning of 2020. Similarly, 29 of 63 shelters reported different numbers of cats at the end of 2019 and the beginning of 2020. The worst offenders are listed in the tables below:


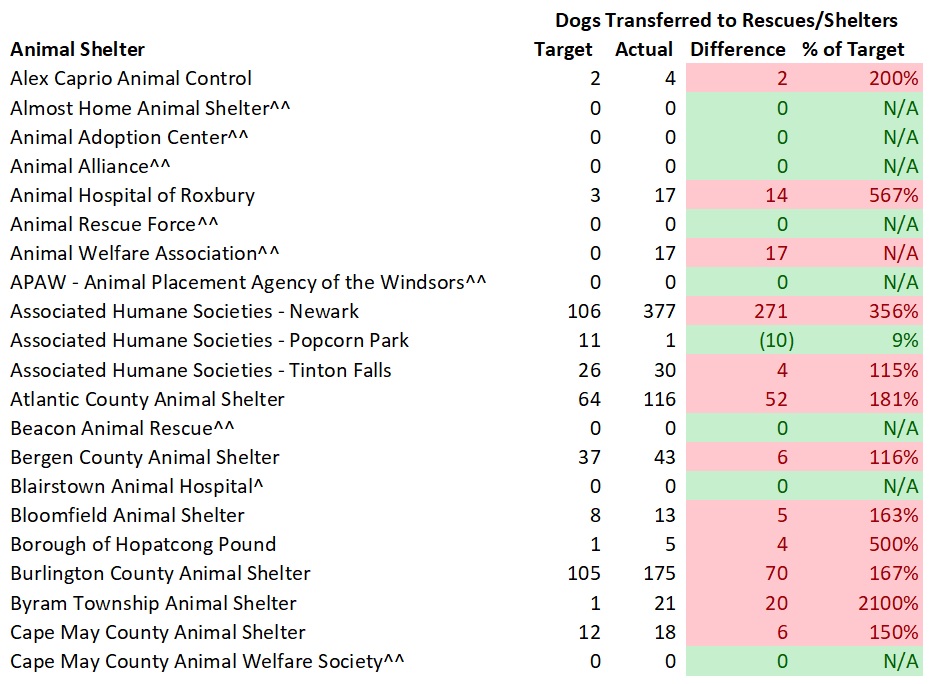
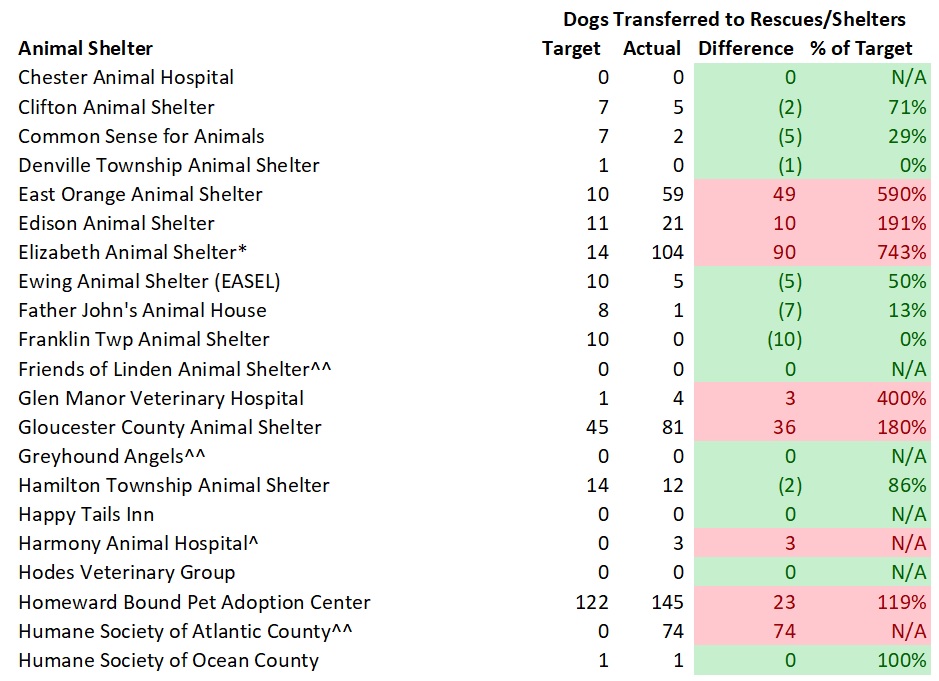
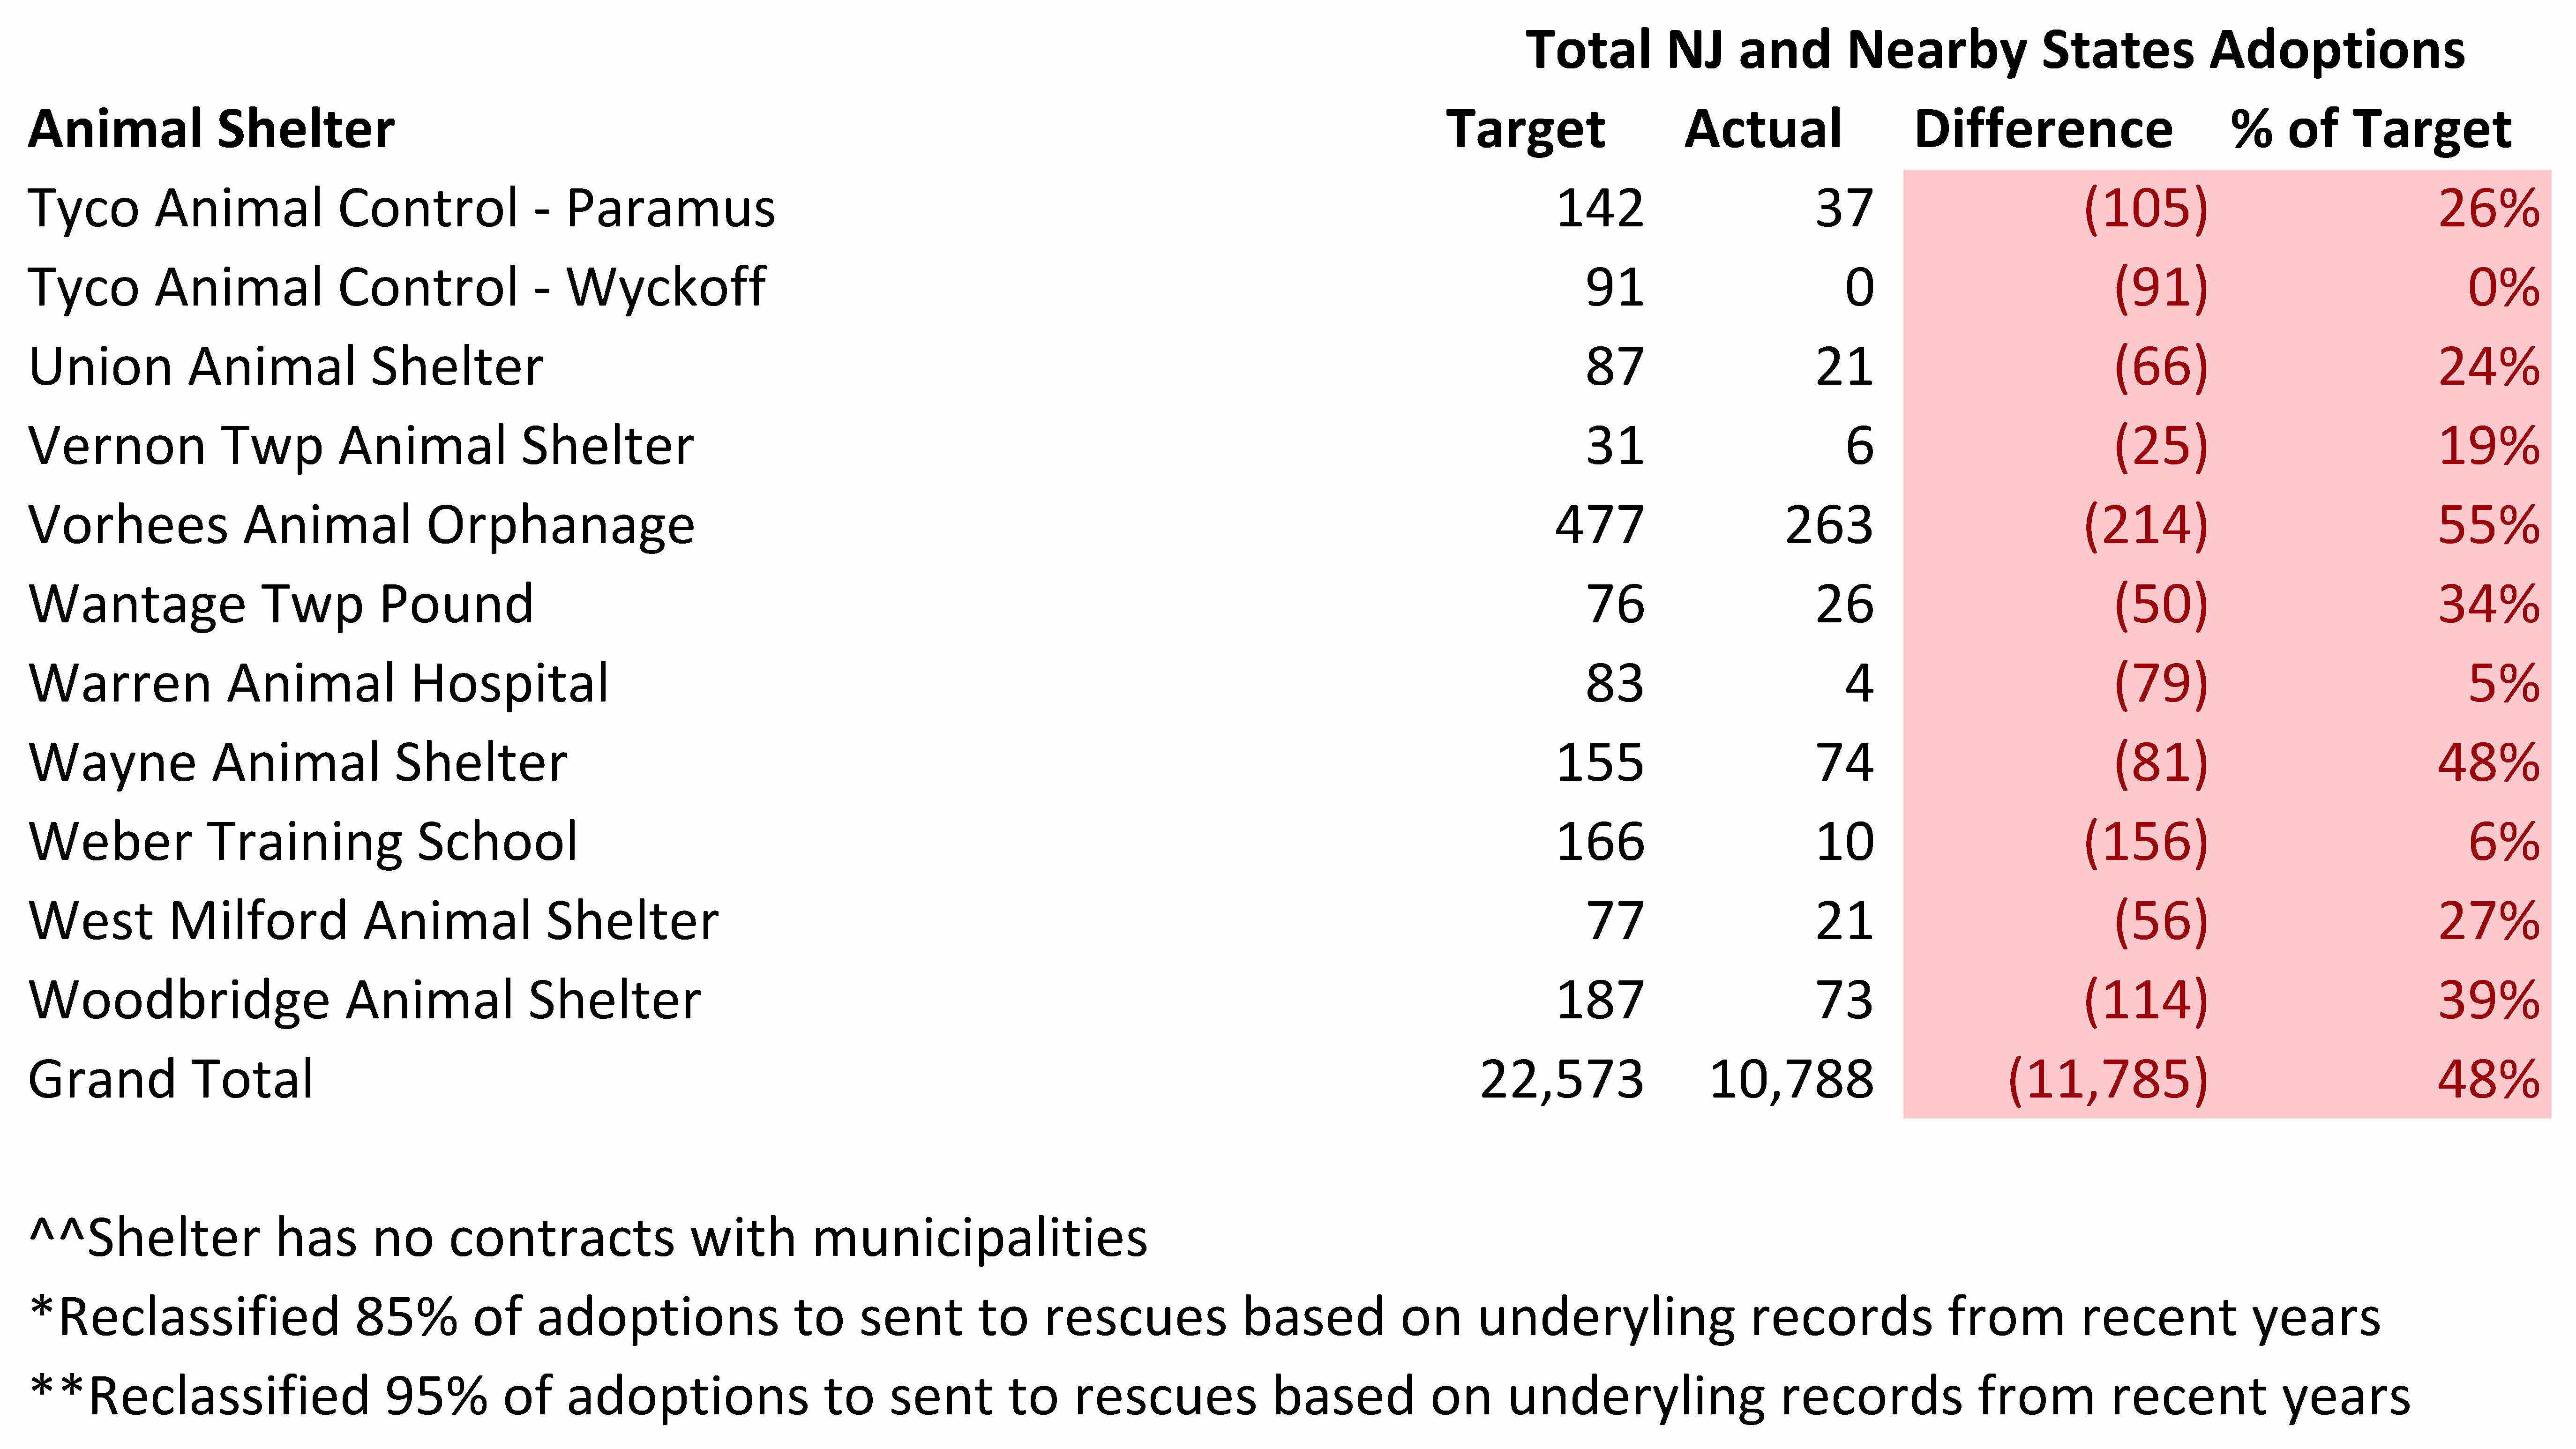
Shelters may have failed to classify animals adopted out and sent to rescues properly. Both Paterson Animal Control and Elizabeth Animal Shelter reported no animals were sent to rescues and all dogs and cats leaving their facilities alive were owner reclaims or adoptions. However, intake and disposition records I reviewed at both of these shelters in recent years revealed almost all “adopted” animals are actually rescued. One has to wonder how many other facilities failed to properly classify adoptions and rescues properly. This data is very important as it provides details on the burden rescues and other shelters are taking on from these facilities.
We need better oversight of New Jersey animal shelters’ data reporting. Currently, these statistics are voluntarily reported and most shelters are not taking this seriously. For example, I noticed a large number of reports were submitted many months after the end of the year. This data should be easy to compile since facilities can utilize animal shelter software programs, some of which are free, to do this task. Furthermore, New Jersey animal shelter laws mandate facilities maintain much of the raw data found in the Shelter/Pound Annual Report. Unfortunately, New Jersey Department of Health inspections routinely find shelters do not properly keep records on animals. We need to make the data reporting mandatory for animal shelters as the shelter reform bill, S636, does along with serious penalties for significant errors (especially if deliberate). In order for animal shelters to take data reporting seriously, we may also need to require audits of these reports. Thus, these results show we need stronger laws and the New Jersey Department of Health to play a greater role in ensuring reported animal shelter statistics are in fact accurate.
Despite the errors in these reports, the data provided still reveals important information.
More Animals Losing Their Lives in New Jersey Animal Shelters Than Disclosed in Summary Report
The more detailed data in the Shelter/Pound Annual Reports allows one to more critically examine the percentage of locally impounded animals dying in New Jersey’s animal shelters. The following table summarizes my analysis of the kill rates calculated from the New Jersey Department of Health’s summary report and the data reported in the Shelter/Pound Annual Reports.

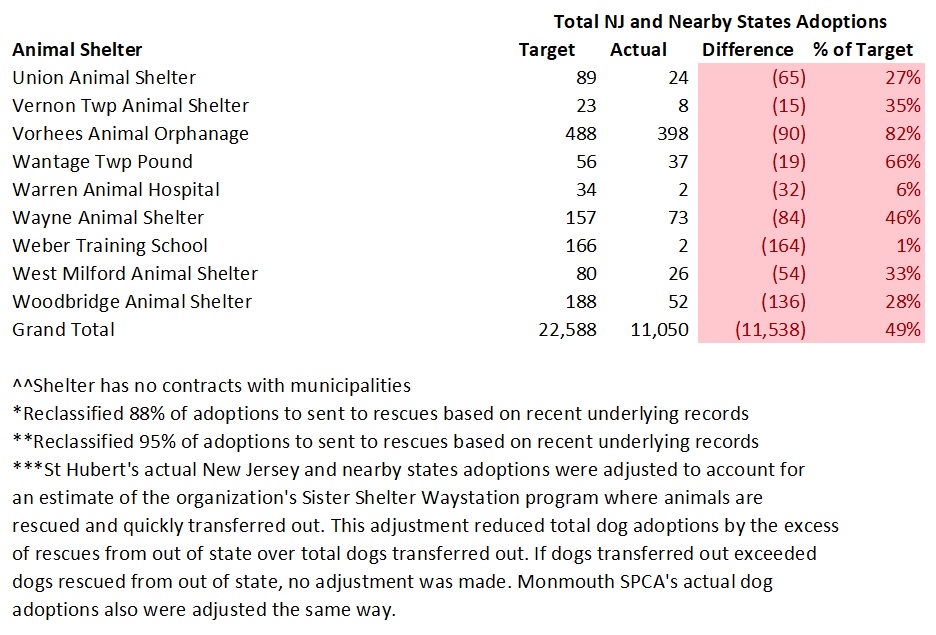
The statistics include an estimate to remove animals St. Hubert’s transfers in and quickly transfers out through its Sister Shelter WayStation program. Since St. Hubert’s is effectively acting as a middle man and not holding these animals very long, it makes sense to exclude these dogs and cats from the various kill rate statistics. If I did not exclude these animals, I would understate the dog and cat kill rates due to inflated intakes and outcomes numbers. Therefore, I removed all of St. Hubert’s dogs transferred out from the intake and outcomes figures in the metrics. Since St. Hubert’s primarily uses the Sister Shelter Waystation program to quickly transfer in cats and send them to out of state facilities, I only backed out the cats St. Hubert’s transferred to out of state organizations in the various kill rates. The dog kill rate (intake) increased from 3.6% to 4.1% and the cat kill rate (intake) remained at 9.8%.
The Animal Intake and Disposition report prepared by the New Jersey Department of Health only allows one to calculate the number of animals killed as a percentage of total animals impounded (i.e. intake). I prefer calculating the kill rate as a percentage of outcomes rather than intake as this metric directly compares positive and negative outcomes. Using intake may depress the kill rate since shelters can simply hold animals for a long time to the point of overcrowding. Calculating the kill rate based on outcomes rather than intake caused the dog kill rate to decrease from 4.1 to 4.0% and the cat kill rate to decrease from 9.8% to 9.7%. This decrease was due to outcomes exceeding intakes.
To calculate the statewide kill rate, we must also back out transfers from one New Jersey animal shelter to another state facility to avoid counting animals still in the state’s shelter system or registering two outcomes for the same animal (i.e. one New Jersey animal shelter transfers a dog or cat to another state facility which then adopts out the animal). This adjustment increased the dog kill rate from 4.0% to 4.3% and the cat kill rate from 9.7% to 10.7%.
In addition, we should increase the kill rate for animals who died or went missing in shelters. In the past, I’ve labeled this metric the death rate as these animals are likely dead or in a very bad situation. Unfortunately, the Shelter/Pound Annual Report includes animals who died or went missing in the “Other” outcome category. The “Other” category contains positive live releases, such as TNR for cats, at a few shelters. While including the “Other” category in the death rate for most shelters is appropriate (i.e. those facilities that don’t do TNR or don’t include cats released through TNR programs in “Other” outcomes), I’m no longer doing this due to an increasing number of shelters implementing TNR. Instead, I calculated the kill rate by subtracting out “Other” outcomes from total outcomes. If a shelter specifies the number of animals included in “Other” that left the shelter alive, I count this as “Other Live Release” and do not back these amounts out of total outcomes. After making this adjustment, the dog kill rate remained at 4.3% and the cat kill rate increased from 10.7% to 11.4%. For those interested in seeing the estimated death rates, you can find them in the supporting spreadsheet.
Also, many shelters transport easy to adopt animals from out of state which artificially increases live release rates. To properly calculate the percentage of New Jersey animals losing their lives, we need to adjust for transports. Unfortunately, shelters don’t break out their kill rates by local and out of state animals. However, most likely nearly all of the out of state animals (primarily puppies and easy to adopt dogs and cats) make it out of shelters alive. Therefore, I back out the number of out of state transports from total outcomes to estimate the local kill rate. This adjustment increases the New Jersey dog kill rate from 4.3% to 5.7% and the state’s cat kill rate from 11.4% to 11.6%.
Also, I estimate a maximum local kill rate by including the number of unaccounted for animals described in the section above. Making this adjustment increases the New Jersey dog kill rate from 5.7% to 10.3% and the state cat kill rate from 11.6% to 14.3%.
Some animal shelters quickly return large percentages of their animals to owners. At these shelters, the populations served are typically well-off and animals are licensed and have microchips. To account for the animals facilities actually have to shelter, I calculated a kill rate for non-reclaimed animals and a maximum potential kill rate for non-reclaimed local animals. The non-reclaimed kill rate and maximum potential kill rate for dogs is 6.2% and 18.0%. Non-reclaimed cats had a 12.2% kill rate and a 15.3% maximum potential kill rate. Thus, the percentage of New Jersey animals losing their lives in our state’s animal shelters may be much higher than the state summary report suggests.
Many Animals Killed Despite Low Statewide Death Rates
The goal of any properly managed animal shelter is to save all of its healthy and treatable animals. In some cases, such as selective admission rescue oriented shelters, it is pretty easy to not kill animals. In addition, other animal shelters with easy to service animal control contracts (i.e. few animals impounded, most strays quickly returned to owners) can avoid unnecessary killing due to having lots of extra space. As a result, some shelters may have an easier time than others in preventing killing at their shelters.
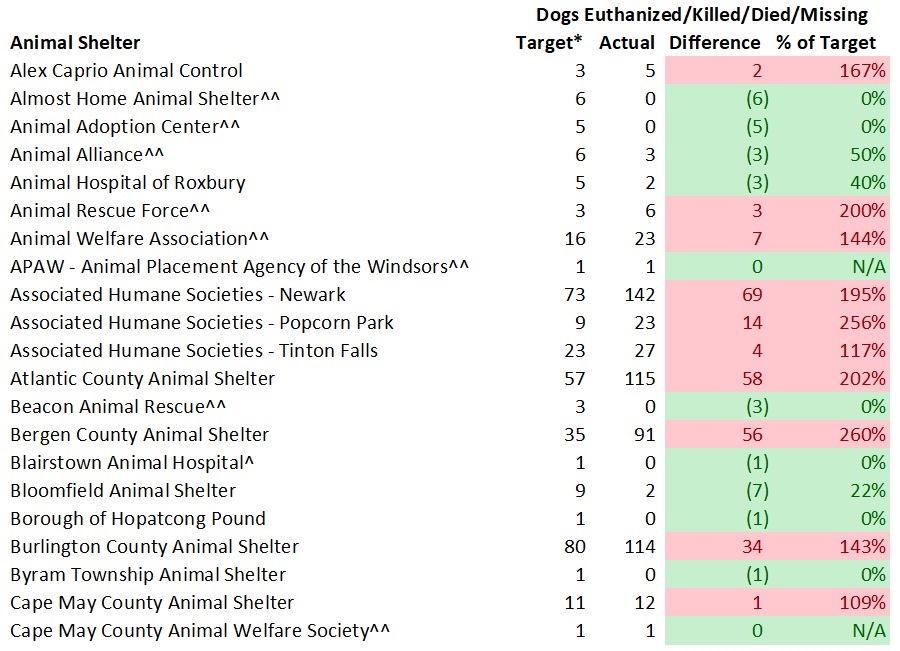
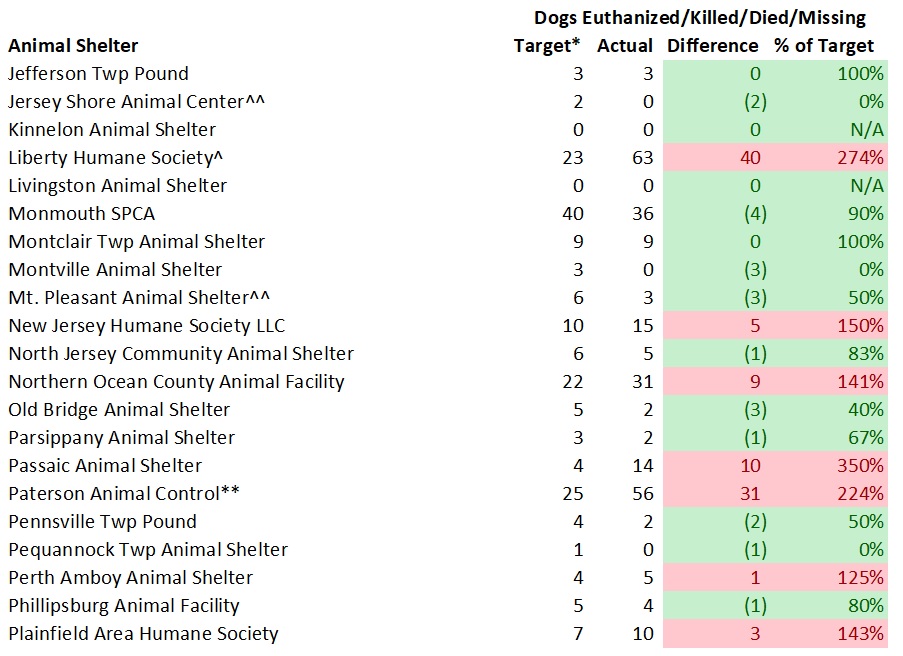
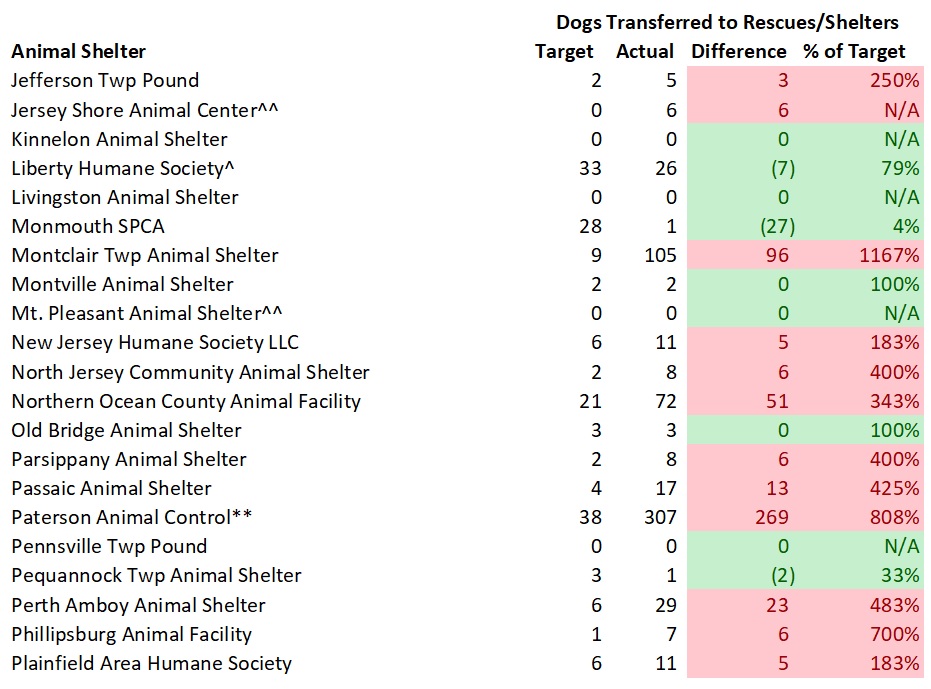
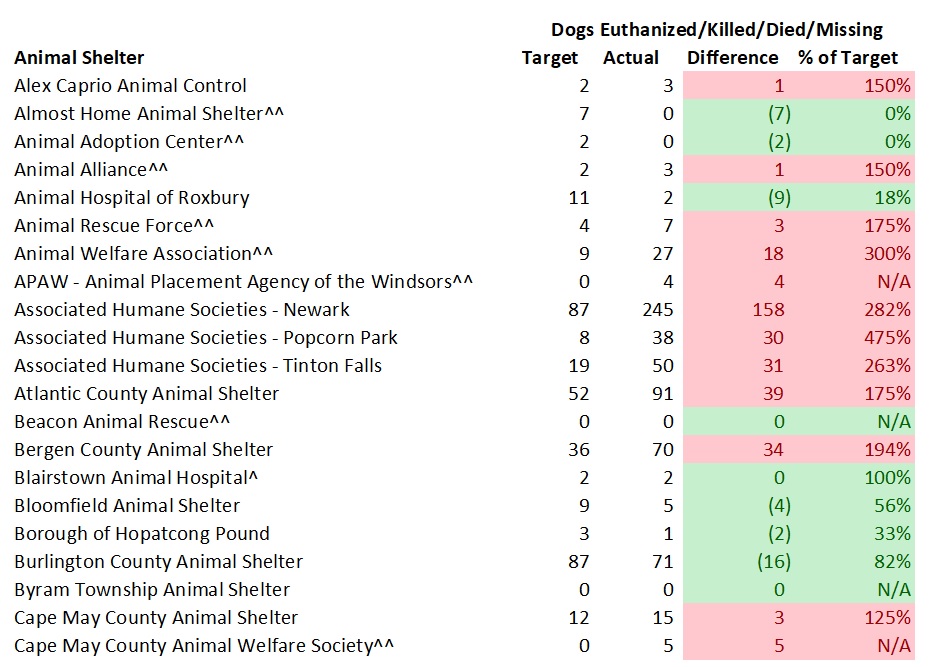
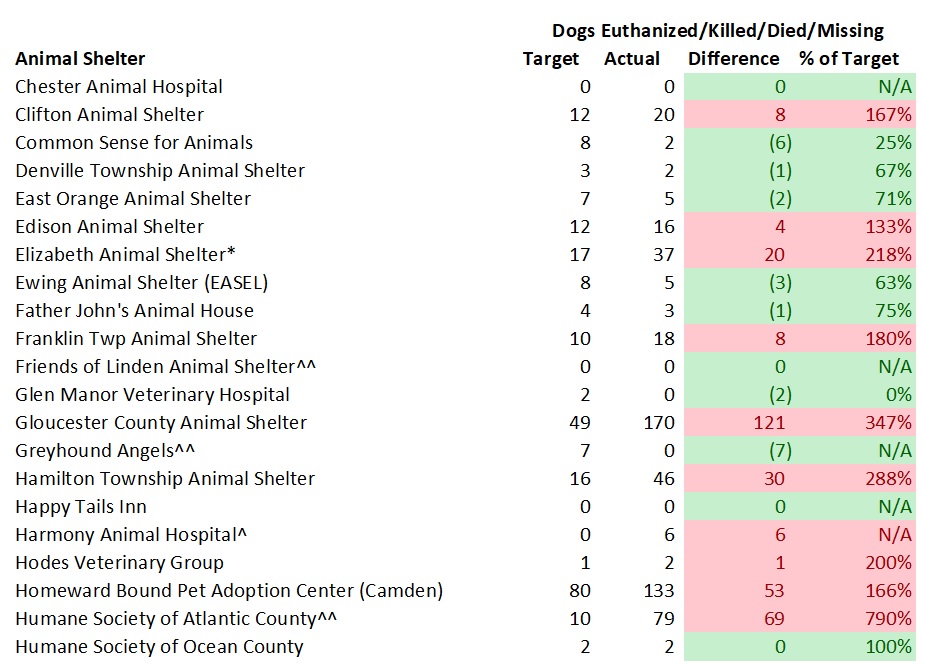
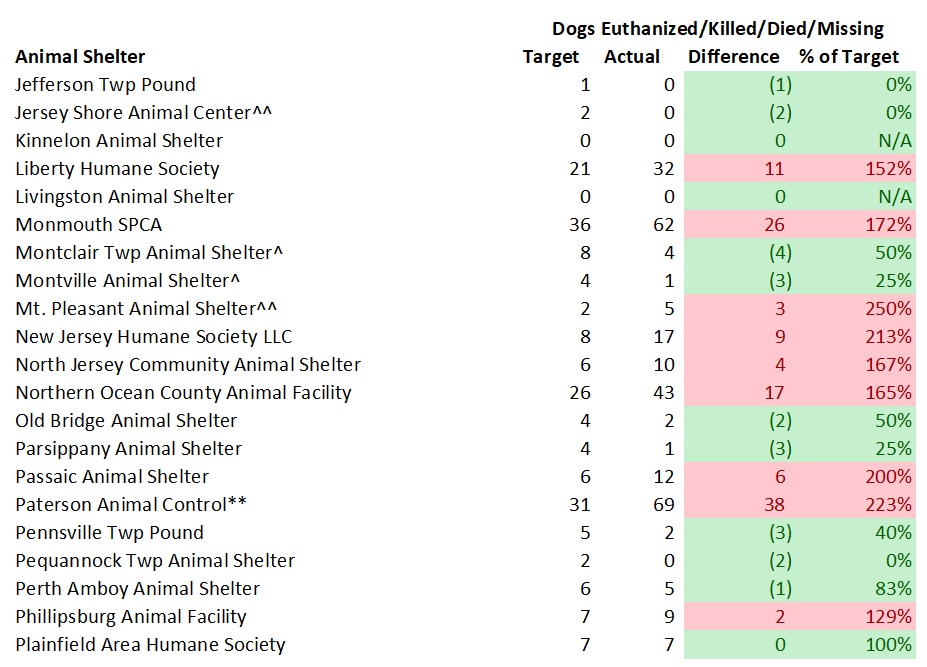
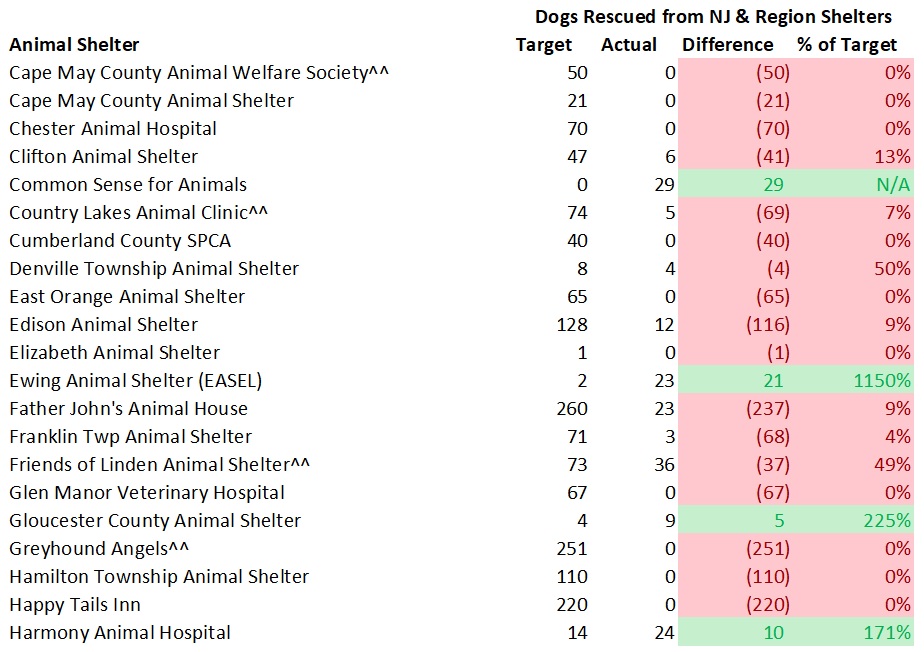
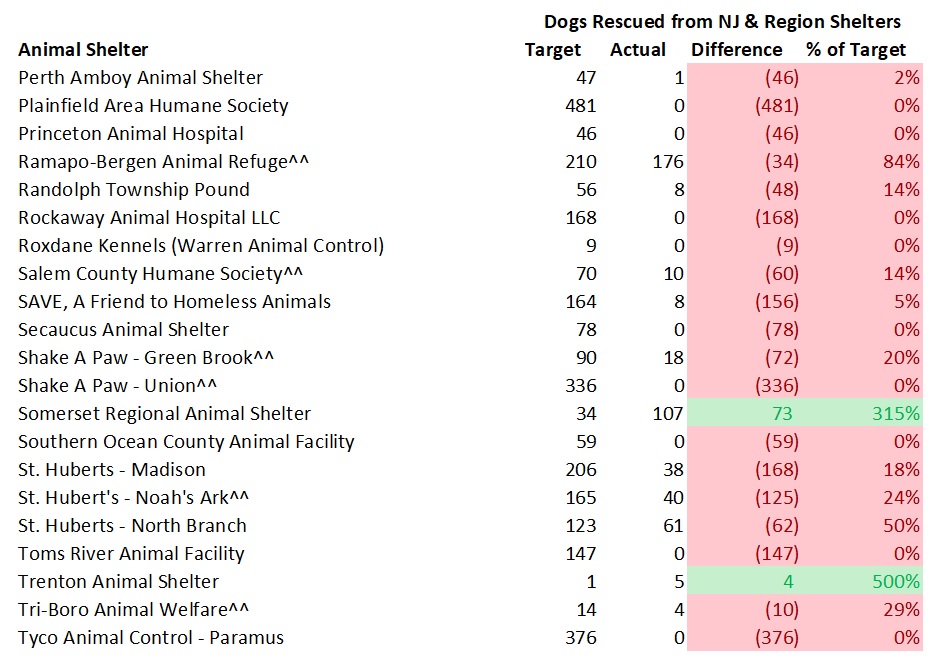
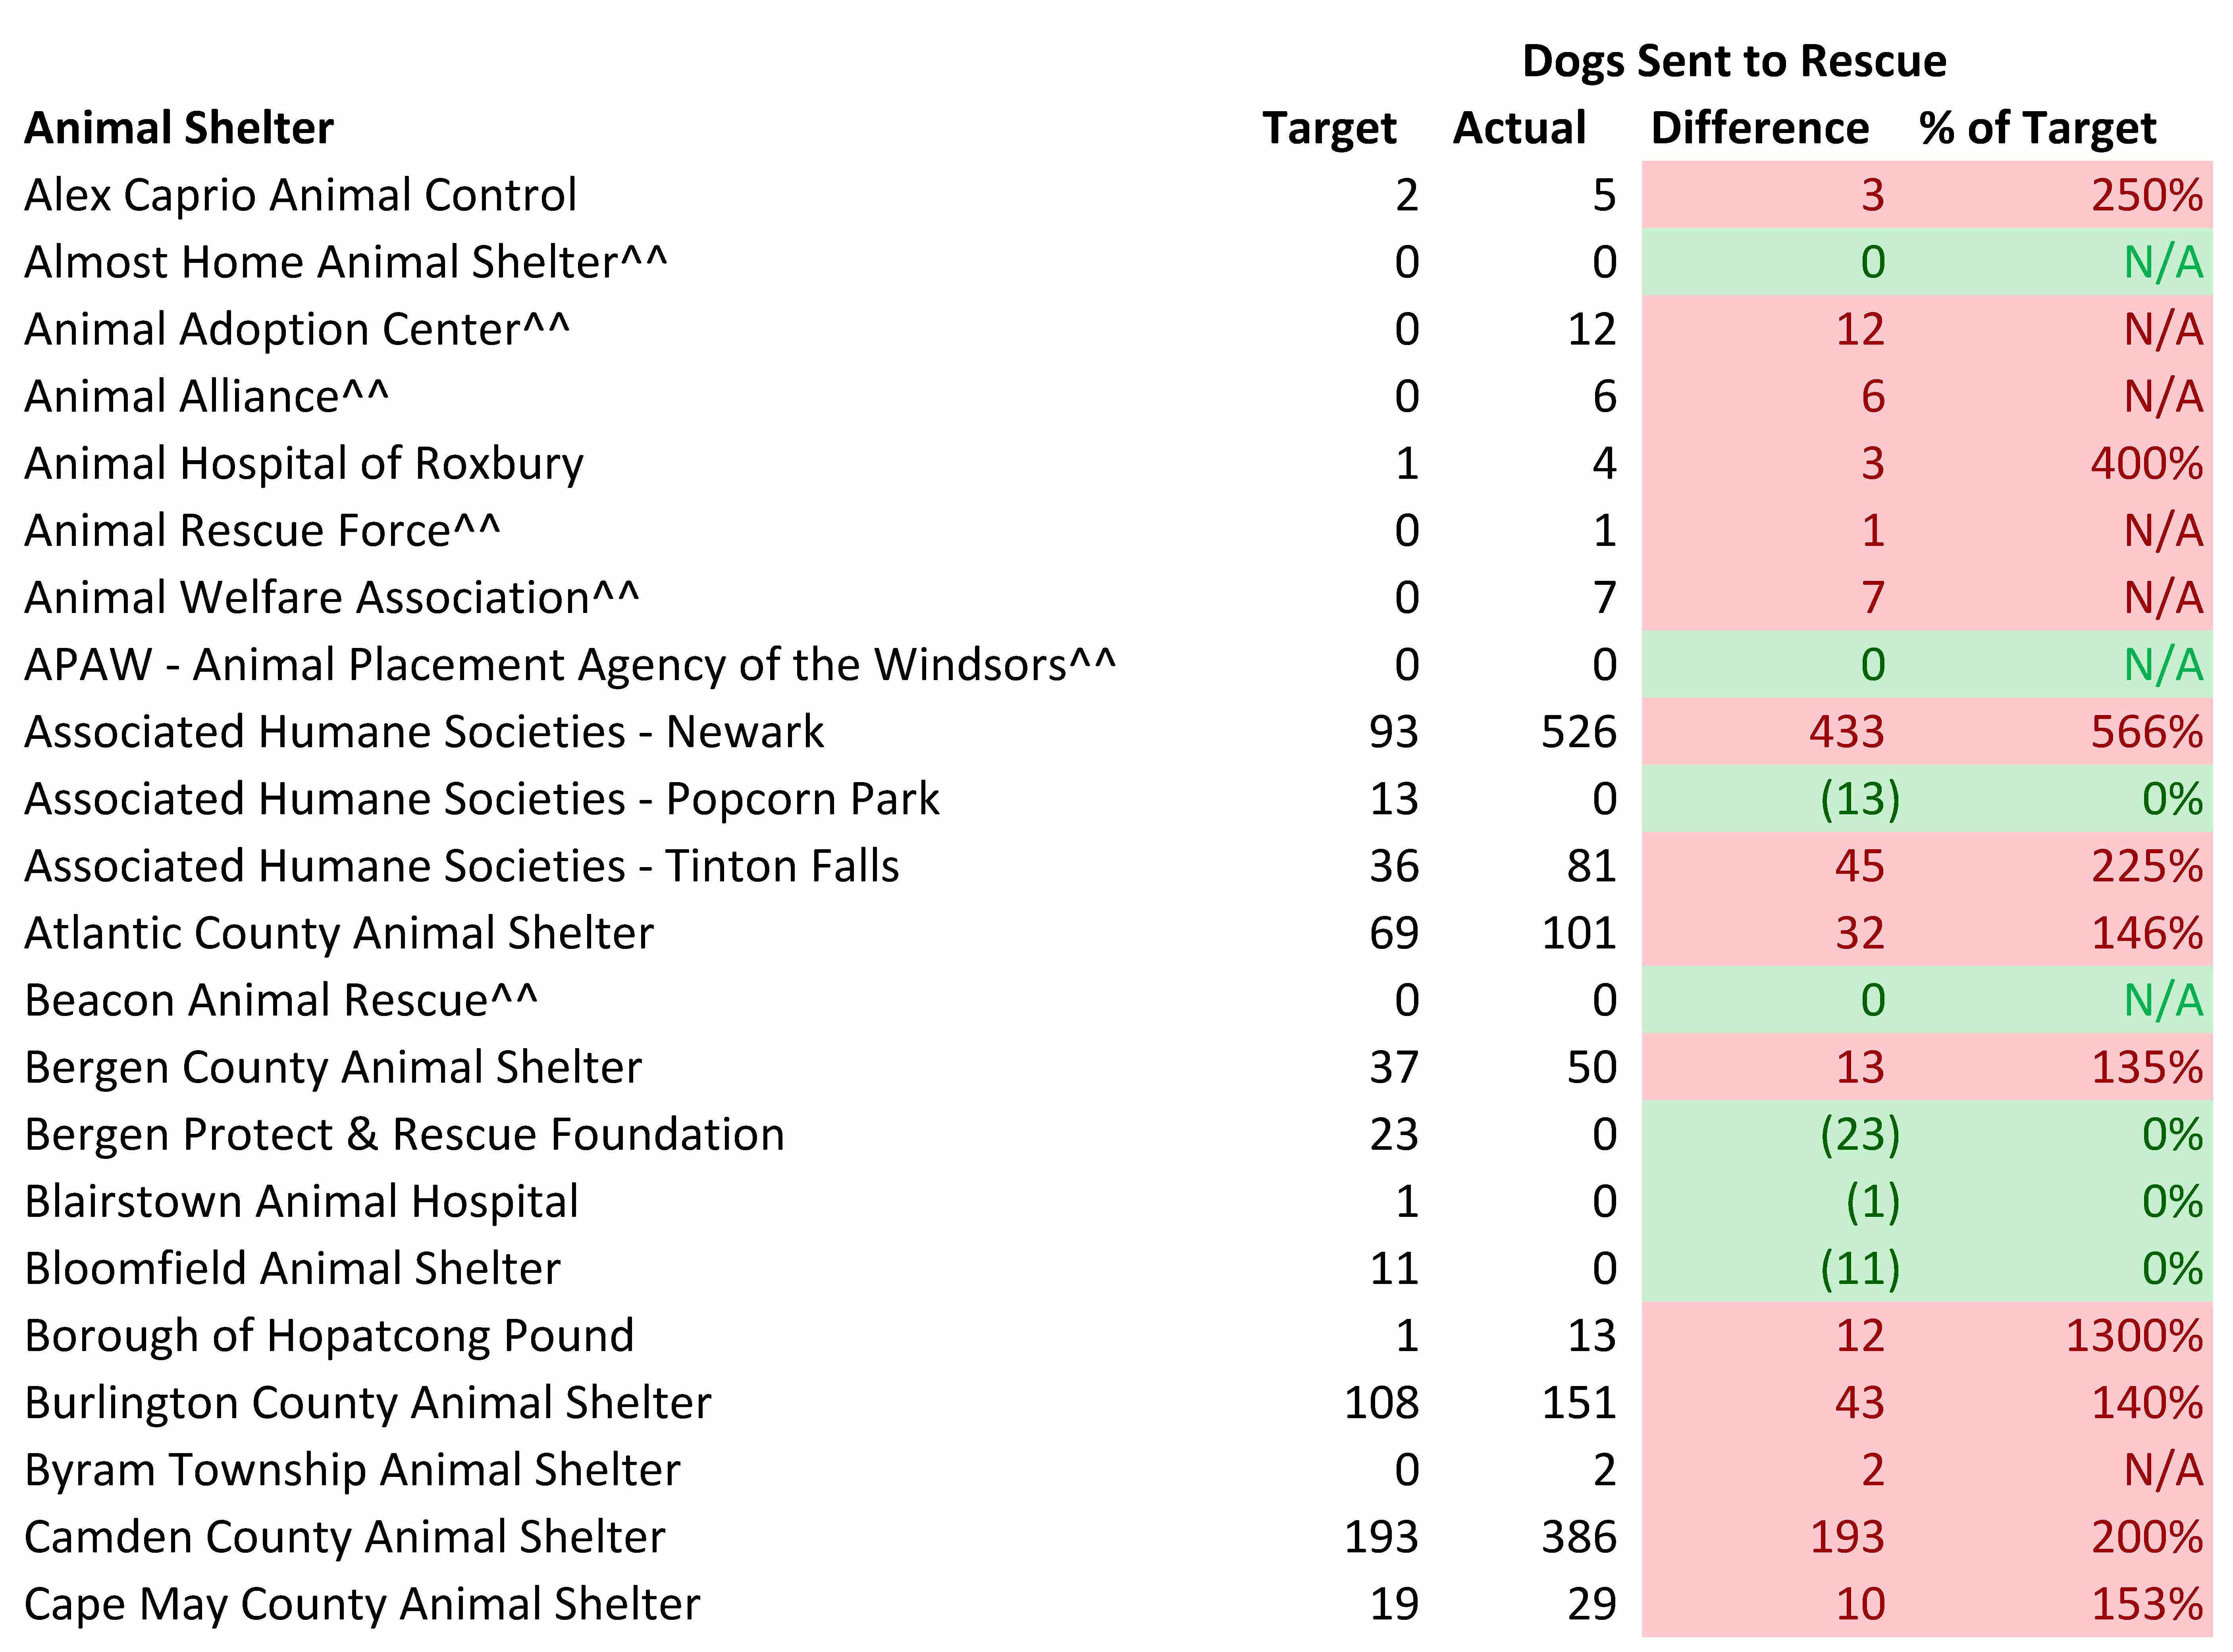
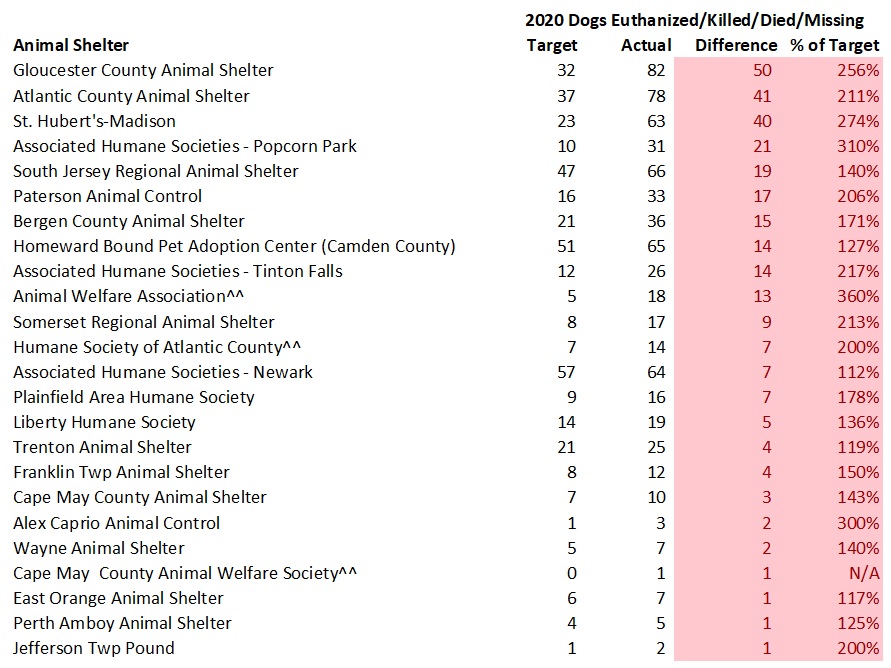
The tables below detail how many dogs should lose their lives at each state animal shelter per my model and the actual numbers of dogs that did. The model’s targets have shelters euthanizing 5% of community dogs (strays, owner surrenders, cruelty/bite cases, etc.) and 1% of dogs rescued from other shelters. All missing or lost dogs are assumed “dead” based on the assumption they died or went to a very bad place. Based on my review of a number of shelters’ underlying documents, virtually all of the dogs in the “Other” outcome category died or went missing. Shelters having the number of dogs losing their lives at or below my targets and above my targets are highlighted in green and red in the tables below.
The largest number of dogs unnecessarily dying occurred at a relatively small number of shelters. Overall, 301 dogs needlessly lost their lives at New Jersey animal shelters in 2020 (i.e. the sum of all shelters killing too many dogs). 10 out of 67 or 15% of the shelters accounted for 81% of the dogs unnecessarily losing their lives under the model’s assumptions. Thus, the bulk of the dogs unnecessarily dying at New Jersey animals shelters occurs at a small number of facilities.
If I use a stricter standard of shelters only having 2% of local dogs losing their lives (which a number of higher volume no kill animal control shelters in other places have achieved), the state’s shelters needlessly killed 555 dogs in 2020.


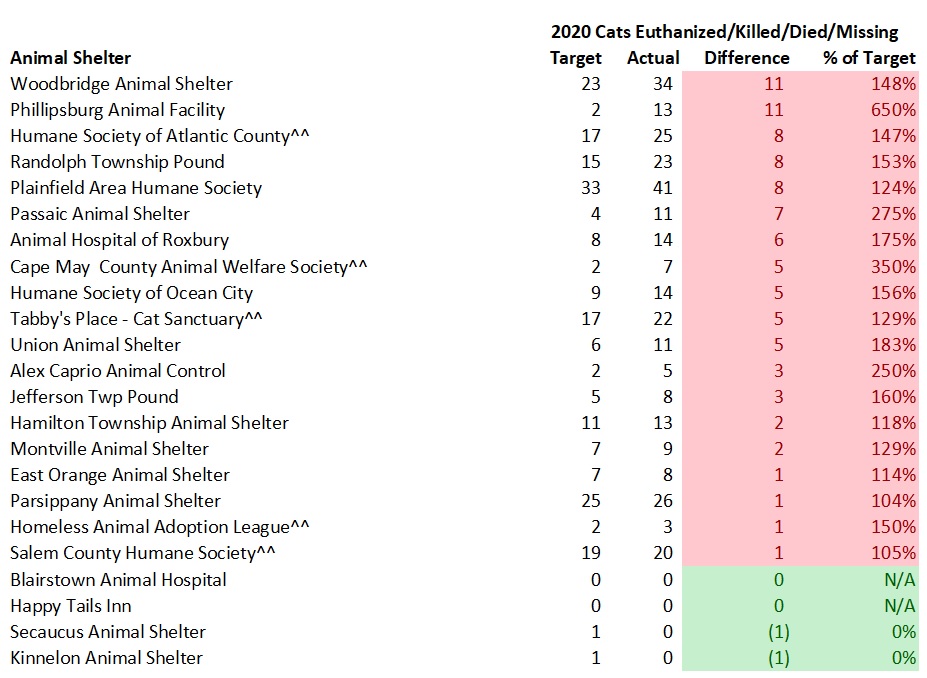
The tables below detail how many cats should lose their lives at each state animal shelter per my model (8% of strays, owner surrenders and other local cats and 5% of cats rescued from other shelters) and the actual numbers of cats that did. All missing or lost cats are assumed “dead” based on the assumption they died or went to a very bad place. Based on my review of a number of shelters’ underlying documents, virtually all of the cats in the “Other” outcome category died or went missing. While a small numbers of shelters could have included some live releases in the “Other” outcome category, it would be misleading to not count these deaths for the overwhelming majority of shelters. Shelters having the number of cats losing their lives at or below my targets and above my targets are highlighted in green and red in the tables below.
The largest number of cats unnecessarily dying occurred at a relatively small number of shelters. Overall, 3,105 cats needlessly lost their lives at New Jersey animal shelters in 2020 (i.e. the sum of all shelters killing too many cats). 10 out of 65 or 15% of the shelters accounted for 86% of the cats unnecessarily losing their lives under the model’s assumptions. Thus, almost all of the cats unnecessarily dying at New Jersey animals shelters happens at a small number of facilities.


Kill Rates Extremely High at a Number of New Jersey Animal Shelters
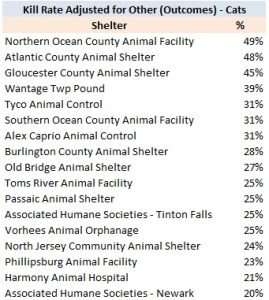
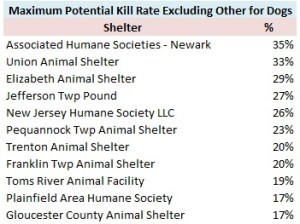
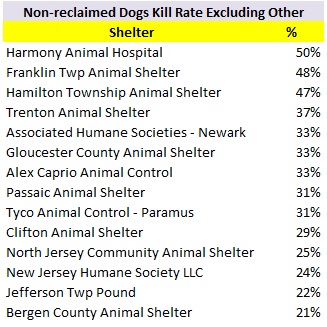
Dogs and cats are likely to lose their lives at a number of New Jersey animal shelters. Shelters with the highest kill rates for dogs and cats (excluding very low intake facilities) are listed in the following tables:


Thus, both dogs and cats have a very good chance of leaving many New Jersey animal shelters dead rather than alive.
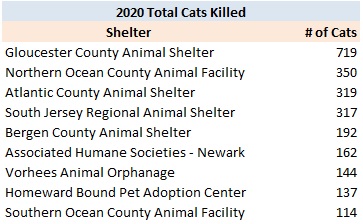
In terms of raw numbers, the following shelters killed the most animals:

Many shelters fail to account for large numbers of their animals. As discussed above, a shelter’s number of animals at the end of the year should be calculated as follows:
Beginning number of animals + animals impounded – animals leaving the shelter
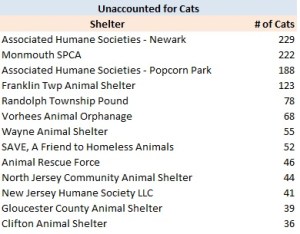
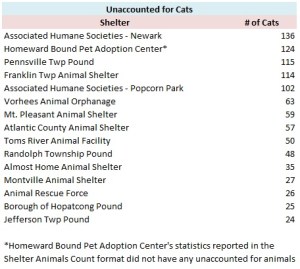
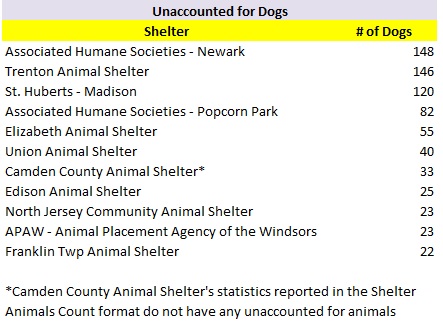
Unfortunately, a large number of shelters take in far more animals than they can explain where they went. Shelters having the highest numbers of unaccounted for dogs and cats are listed in the following tables:
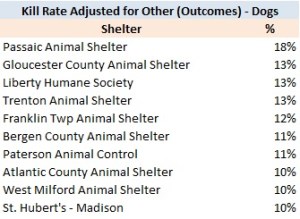
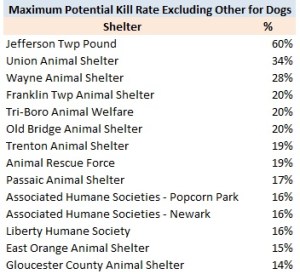
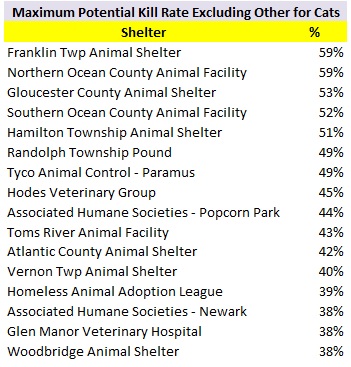
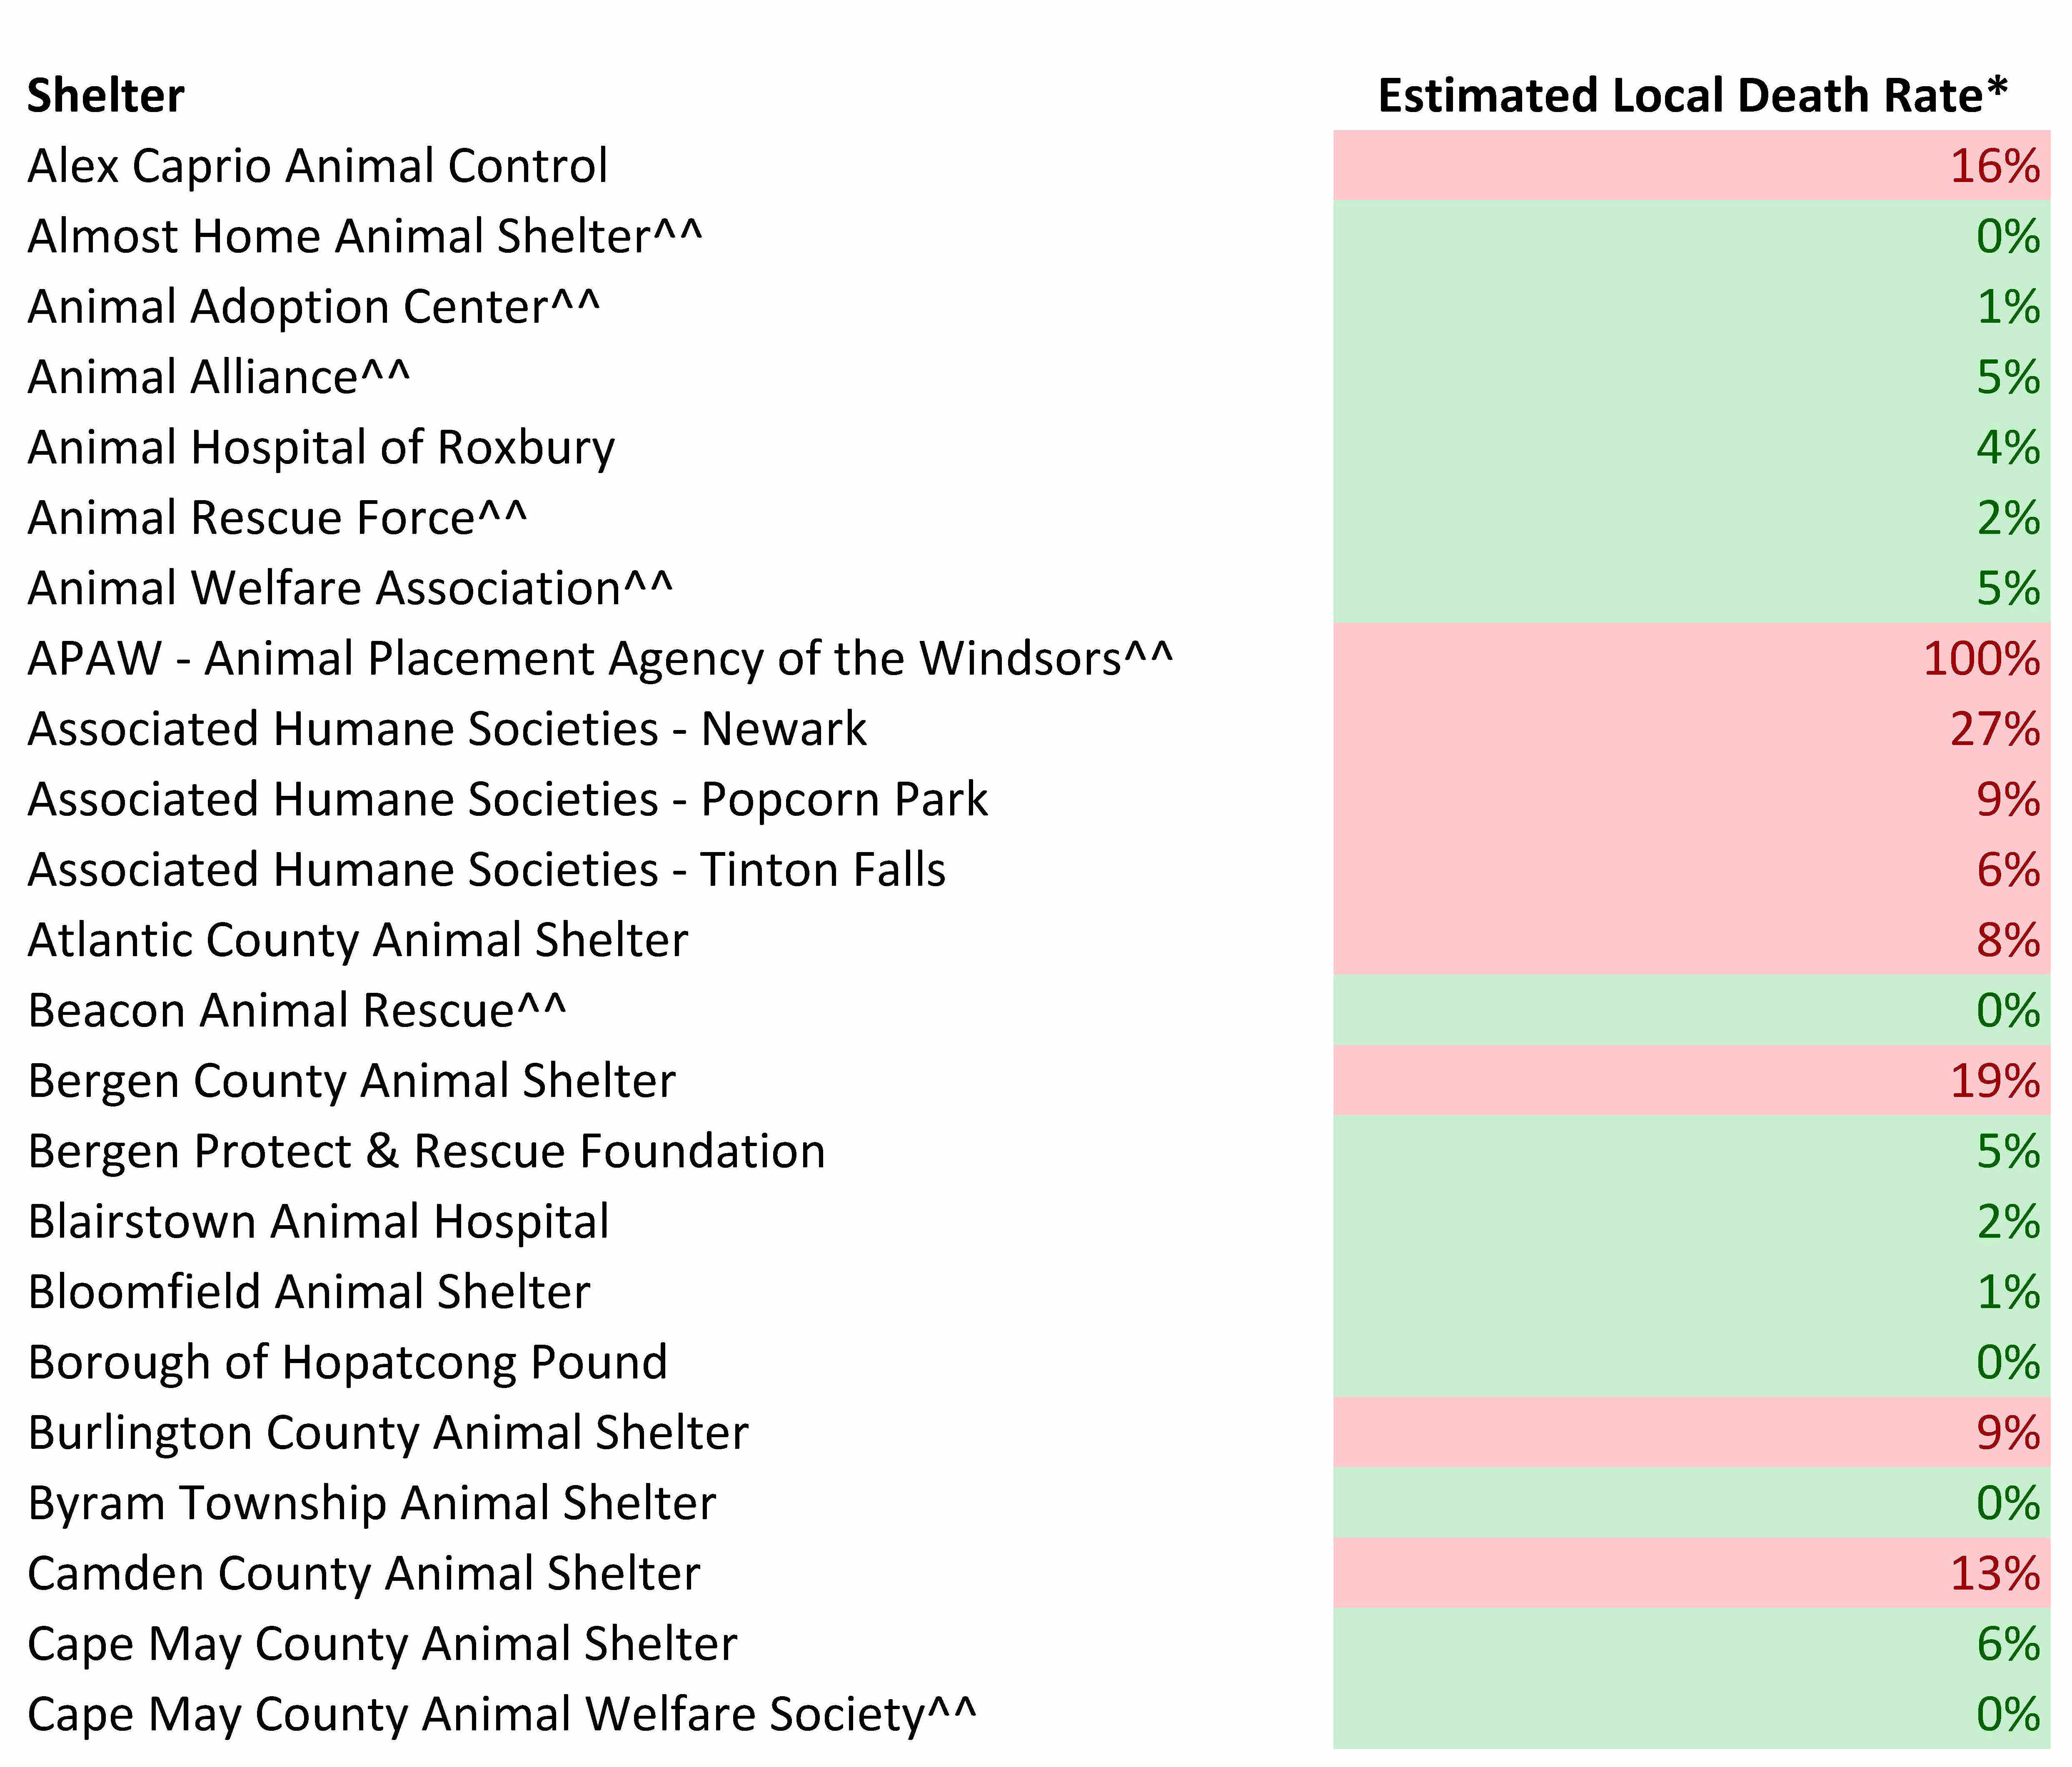
Dog and cat kill rates at many shelters may be even higher if these unaccounted for animals are counted as killed. If we only consider animal shelters which reported transporting few or no animals in 2020, facilities with the highest dog and cat kill rates considering the unaccounted for animals described above are as follows:


Thus, the plight of dogs and cats may be far worse in New Jersey animal shelters when we consider the unaccounted for animals.
Shelters Turn Their Backs on New Jersey’s Animals
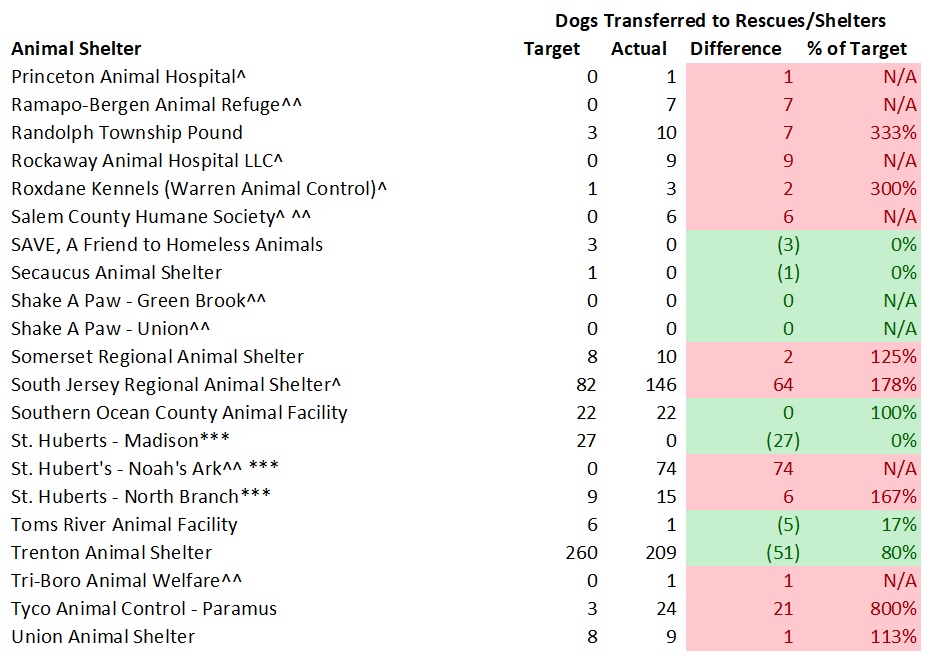
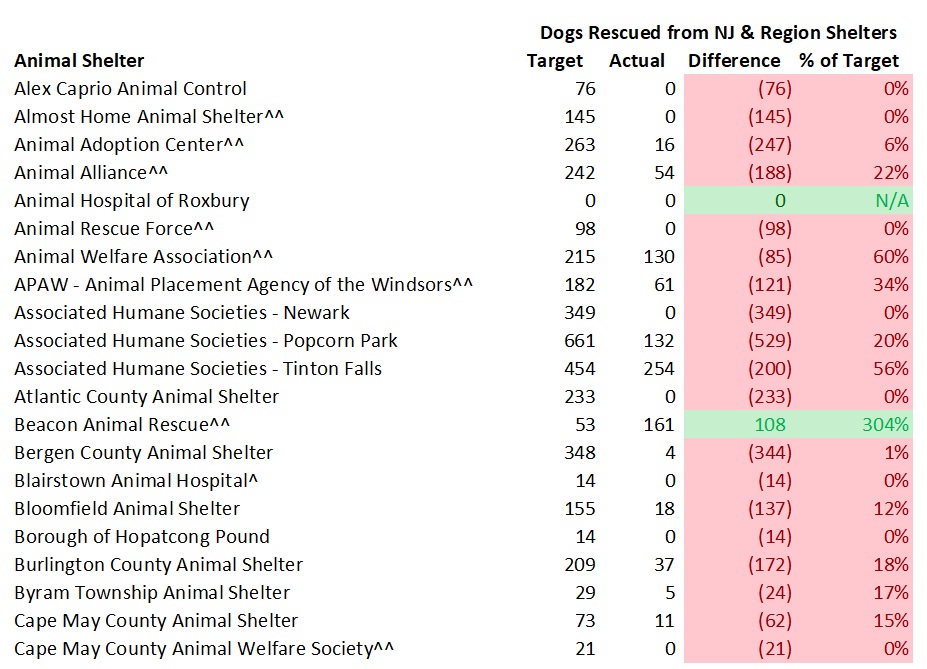
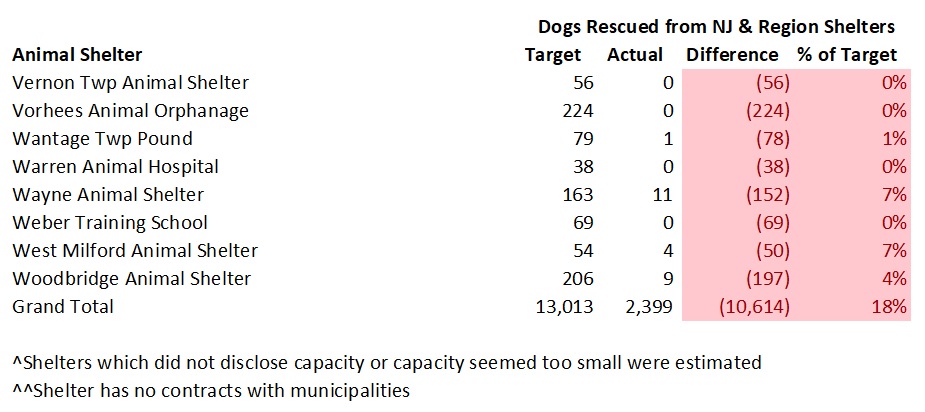
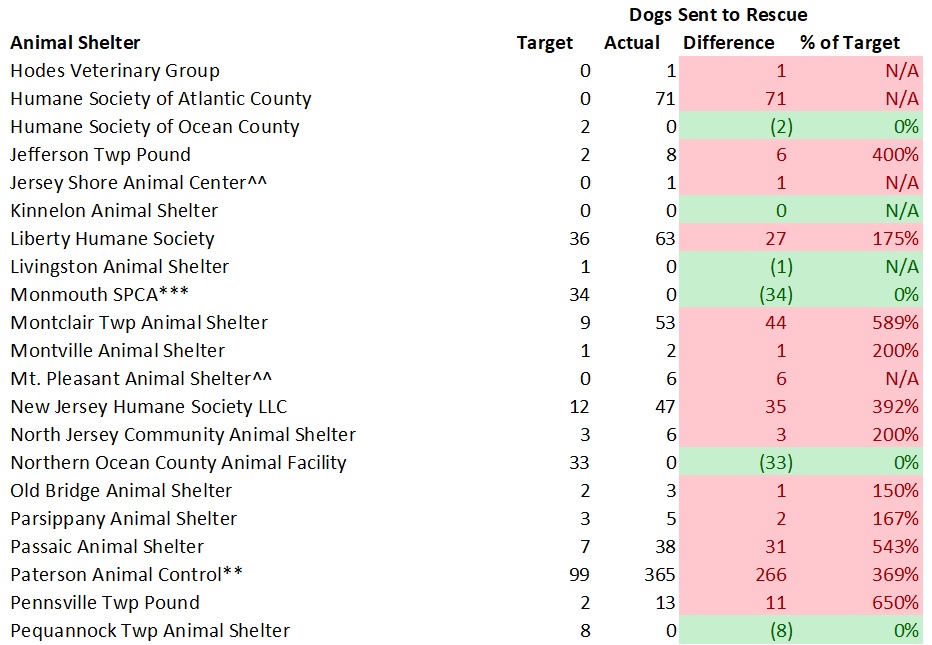
New Jersey animal shelters rescue far more dogs from out of state than from other New Jersey animal shelters. Specifically, New Jersey animal shelters transferred in 3,041 dogs from out of state animal shelters and only rescued 870 dogs from other New Jersey animal shelters. While fewer dogs were available for rescue in 2020, the pattern is consistent with past years.
While perhaps some shelters take animals from nearby New York or Pennsylvania animal control shelters, the overwhelming majority of these dogs most certainly came from down south. In fact, New Jersey animal shelters transported more dogs from out of state than dogs who were killed in New Jersey animal shelters. This number does not include additional out of state dogs transported into New Jersey by rescues operating without a physical facility. Shelters transporting the most dogs from out of state were as follows:
In 2020, several New Jersey animal shelters transported many cats from out of state. Its not clear if or how many of the cats EASEL took in from out of state were from nearby Pennsylvania or other places further away.
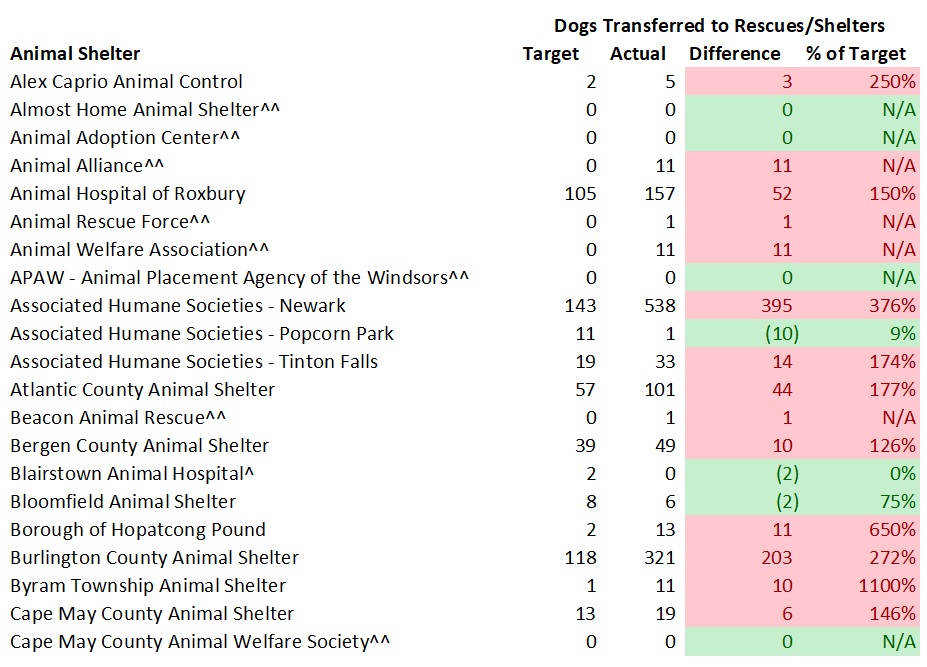
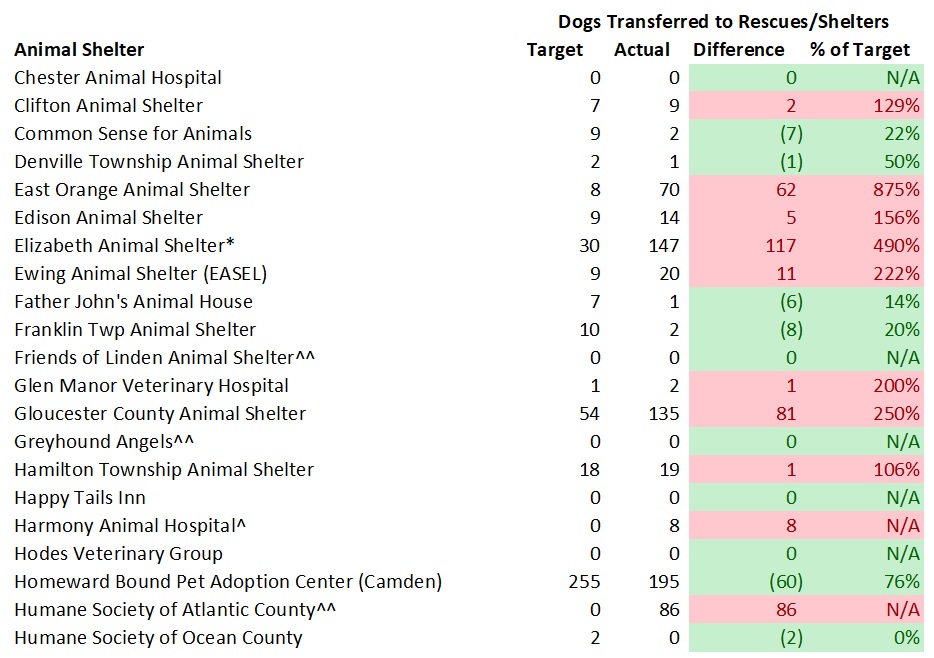
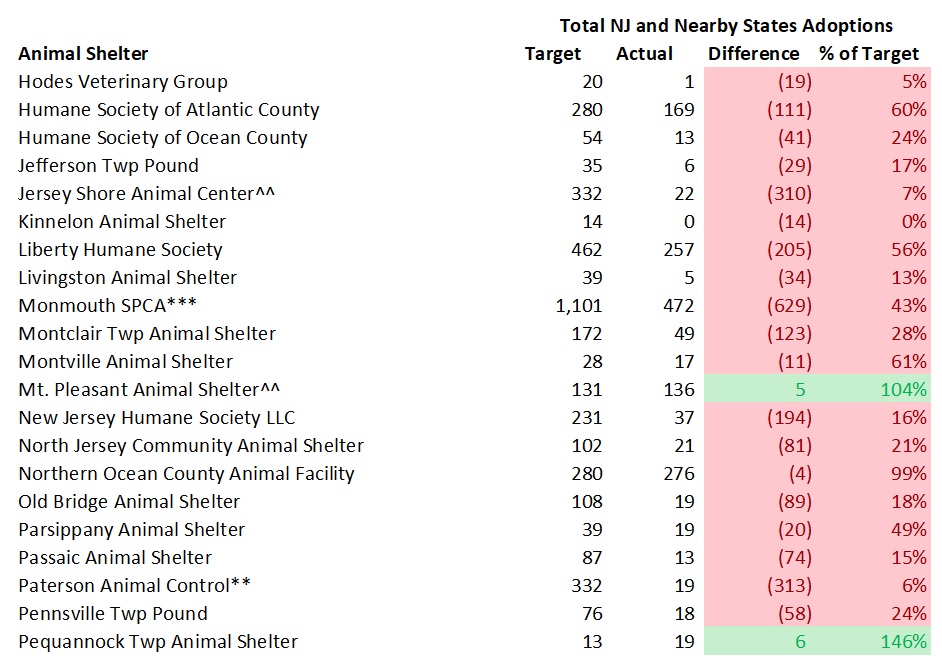
Shelters Do Far Worse with Animals Requiring New Homes
Since dogs reclaimed by their owners typically have licenses and/or microchips and quickly leave the shelter, its informative to look at dogs shelters have to find new homes for. To get a better idea of how organizations are doing with animals they actually have to shelter, I also examined what percentage of non-reclaimed dogs lose their lives at each facility. Shelters with the highest non-reclaimed dogs kill rates are as follows (excluding shelters taking few unclaimed dogs in):

Shelters with the highest maximum non-reclaimed dog kill rates are as follows (excluding facilities that reported transporting many dogs in and taking very few unclaimed animals in):

Shelters Leave Animal Enclosures Empty While Dogs and Cats Die
New Jersey animal shelters fail to use their space to save animals. Based on the average number of animals at all of New Jersey’s animal shelters at the beginning and the end of 2020, only 52% of dog and 74% of cat capacity was used. Given December is a low intake month, I also increased these populations to an average intake month. This adjustment only raised the dog capacity utilization to 54%. While this adjustment did increase the cat capacity utilization to 92%, it is highly unlikely this happened in reality. Shelter inspection reports I’ve reviewed often did not reveal significantly larger dog and cat populations in the summer and winter months. This is likely due to the influx of highly adoptable kittens having short lengths of stay and shelters killing cats with empty cages.
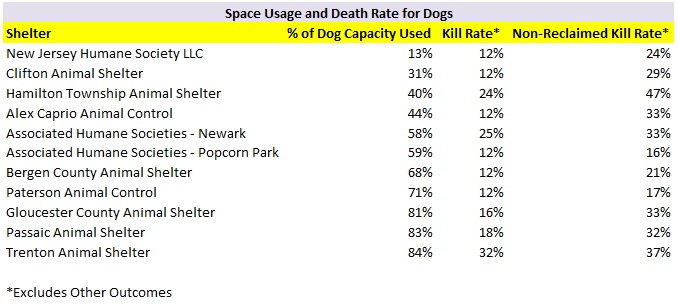
Many animal shelters with low kill rates failed to rescue animals with their excess space. Additionally, other shelters used little of their available space and still killed a large percentage of their animals. Some examples after increasing the population (and therefore capacity utilization) based on the adjustment discussed above are as follows:


Thus, many New Jersey animal shelters are killing dogs and cats despite having ample space to house these animals.
Shelters Show No Respect for Life for Animals Outside of Those Facilities
As I wrote in my last blog, 2020 was the most unusual year in the history of animal sheltering. The COVID-19 pandemic caused many shelters to restrict animal intake and the public, who were home more, lost fewer pets and fostered more animals. As a result, shelters took significantly fewer animals in and had more open animal enclosures than in the past.
On the other hand, many shelters across the country took it a step further and refused to help animals in need. Therefore, we must differentiate between shelters whose intake decreased due to pandemic related reasons and those who exploited COVID-19 to do less work and put animals at risk outside those facilities’ walls.
The following tables detail the shelters whose dog and cat intake decreased the most in 2020. As you can see, these shelters animal intake decreased significantly more than both the decrease for shelters across the country using PetPoint software (24% and 21% decrease for dogs and cats) and for New Jersey animal shelters as a whole (22% and 13% decrease for dogs and cats).


New Jersey’s animal shelters continue to fail the state’s animals. The state’s animal shelters only impounded 5.9 dogs and cats per 1,000 New Jersey residents in 2020. If we just count animals originating from New Jersey, the state’s animal shelters only impounded 5.2 dogs and cats per 1,000 people in 2020. As a comparison, Florida’s Lake County Animal Shelter took in 10.9 dogs and cats in 2020 and saved 98% of its dogs and 94% of its cats due to it fully implementing the No Kill Equation. Despite New Jersey shelters impounding a fraction of the animals many no kill communities take in on a per capita basis, the state’s animal control facilities continue to kill and allow animals to die under their care and outside their walls. Even worse, many of these shelters can’t even properly keep track of how many animals leave their facilities dead or alive. Our state’s animals deserve far better treatment than this. Contact your local city council members and mayor and demand better from the animal shelter serving your community. We can do so much better and it is time our shelters operate this way.