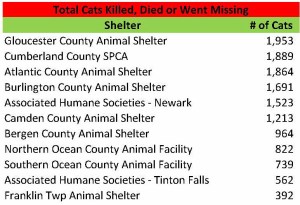
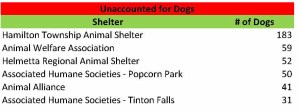
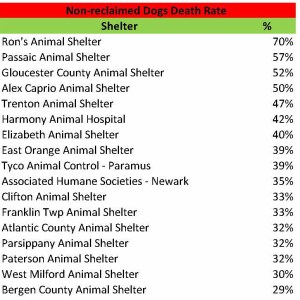
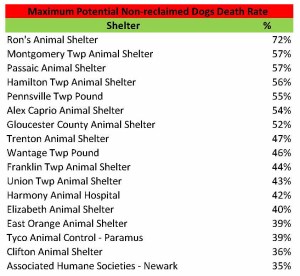
New Jersey’s Highest Kill Shelters in 2020

January 21, 2022 Update: Subsequent to my original analysis, St. Hubert’s-Madison submitted its statistics to the New Jersey Department of Health and the state health department revised its summary report on the state animals shelters statistics. As a result, I updated this blog for the St. Hubert’s-Madison data.

Recently, I wrote a blog discussing decreased killing at New Jersey animal shelters in 2020. This blog will explore the 2020 statistics in more detail and assess the current status of the state’s animal shelters.

Most New Jersey animal shelters voluntarily report detailed data to state authorities. Earlier this year, I shared the 2020 summary statistics for New Jersey animal shelters on my Facebook page. Each year, the New Jersey Department of Health requests each licensed animal shelter in the state to submit animal shelter data for the previous year. Animal shelters voluntarily submit this data in the “Shelter/Pound Annual Report.” The New Jersey Department of Health takes these Shelter/Pound Annual Reports and compiles the number of dogs, cats and other animals impounded, redeemed, adopted and euthanized to prepare its Animal Intake and Disposition report. However, the Shelter/Pound Annual Reports include additional information on how animals were impounded (i.e. strays, owner surrenders, rescued from in-state facilities, rescued from out of state shelters, and cruelty/bite cases/other) and disposed of (i.e. returned to owner, adopted, sent to rescue/another shelter, and died/missing/other outcome). Additionally, the Shelter/Pound Annual Reports include the number of animals in shelters at the beginning and end of the year as well as the maximum number of animals facilities can hold. Thus, the Shelter/Pound Annual Reports include very important data not found in the New Jersey Department of Health’s summary report.

I compiled the data from these reports and analyze the results in this blog. 2020 statistics for each New Jersey animal shelter are listed at this link. You can also view each “Shelter/Pound Annual Report” at this link.

Garbage Data Raises Serious Questions About New Jersey Animal Shelters’ Statistics

Most New Jersey animal shelters do not properly account for their animals. Simple math dictates the number of animals at a facility at the beginning of the year, plus all animals coming in during the year, less all animals leaving for the period, should equal the number of animals a shelter has at the end of the year. Stunningly, 36 out of 66 shelters reporting these dog statistics and 42 out of 65 facilities submitting this cat data failed to get this right. This raises serious questions about the accuracy of these shelters’ reported statistics. 24 of the 36 shelters with flawed dog statistics and 23 of the 42 facilities with incorrect cat statistics should have had more animals at the end of the year than reported. While these errors could have been due to incorrect counts of the number of animals at facilities, these shelters may have not recorded outcomes, such as animals who were killed, died, or went missing. To put it another way, 1,302 cats and dogs should have had outcomes reported and did not. Thus, there is the potential that as many as 1,302 additional dogs and cats were killed, died or went missing from New Jersey animal shelters than were reported in 2020.

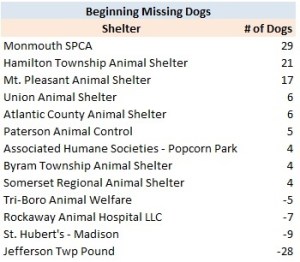
Even worse, a number of animal shelters reported having a different number of animals at the end of 2019 and at the beginning of 2020. Obviously, shelters should report the same number of animals at the end of the prior year and the start of the current year. However, 33 of 65 shelters reported different numbers of dogs at the end of 2019 and the beginning of 2020. Similarly, 29 of 63 shelters reported different numbers of cats at the end of 2019 and the beginning of 2020. The worst offenders are listed in the tables below:

Shelters may have failed to classify animals adopted out and sent to rescues properly. Both Paterson Animal Control and Elizabeth Animal Shelter reported no animals were sent to rescues and all dogs and cats leaving their facilities alive were owner reclaims or adoptions. However, intake and disposition records I reviewed at both of these shelters in recent years revealed almost all “adopted” animals are actually rescued. One has to wonder how many other facilities failed to properly classify adoptions and rescues properly. This data is very important as it provides details on the burden rescues and other shelters are taking on from these facilities.

We need better oversight of New Jersey animal shelters’ data reporting. Currently, these statistics are voluntarily reported and most shelters are not taking this seriously. For example, I noticed a large number of reports were submitted many months after the end of the year. This data should be easy to compile since facilities can utilize animal shelter software programs, some of which are free, to do this task. Furthermore, New Jersey animal shelter laws mandate facilities maintain much of the raw data found in the Shelter/Pound Annual Report. Unfortunately, New Jersey Department of Health inspections routinely find shelters do not properly keep records on animals. We need to make the data reporting mandatory for animal shelters as the shelter reform bill, S636, does along with serious penalties for significant errors (especially if deliberate). In order for animal shelters to take data reporting seriously, we may also need to require audits of these reports. Thus, these results show we need stronger laws and the New Jersey Department of Health to play a greater role in ensuring reported animal shelter statistics are in fact accurate.

Despite the errors in these reports, the data provided still reveals important information.

More Animals Losing Their Lives in New Jersey Animal Shelters Than Disclosed in Summary Report

The more detailed data in the Shelter/Pound Annual Reports allows one to more critically examine the percentage of locally impounded animals dying in New Jersey’s animal shelters. The following table summarizes my analysis of the kill rates calculated from the New Jersey Department of Health’s summary report and the data reported in the Shelter/Pound Annual Reports.

The statistics include an estimate to remove animals St. Hubert’s transfers in and quickly transfers out through its Sister Shelter WayStation program. Since St. Hubert’s is effectively acting as a middle man and not holding these animals very long, it makes sense to exclude these dogs and cats from the various kill rate statistics. If I did not exclude these animals, I would understate the dog and cat kill rates due to inflated intakes and outcomes numbers. Therefore, I removed all of St. Hubert’s dogs transferred out from the intake and outcomes figures in the metrics. Since St. Hubert’s primarily uses the Sister Shelter Waystation program to quickly transfer in cats and send them to out of state facilities, I only backed out the cats St. Hubert’s transferred to out of state organizations in the various kill rates. The dog kill rate (intake) increased from 3.6% to 4.1% and the cat kill rate (intake) remained at 9.8%.

The Animal Intake and Disposition report prepared by the New Jersey Department of Health only allows one to calculate the number of animals killed as a percentage of total animals impounded (i.e. intake). I prefer calculating the kill rate as a percentage of outcomes rather than intake as this metric directly compares positive and negative outcomes. Using intake may depress the kill rate since shelters can simply hold animals for a long time to the point of overcrowding. Calculating the kill rate based on outcomes rather than intake caused the dog kill rate to decrease from 4.1 to 4.0% and the cat kill rate to decrease from 9.8% to 9.7%. This decrease was due to outcomes exceeding intakes.

To calculate the statewide kill rate, we must also back out transfers from one New Jersey animal shelter to another state facility to avoid counting animals still in the state’s shelter system or registering two outcomes for the same animal (i.e. one New Jersey animal shelter transfers a dog or cat to another state facility which then adopts out the animal). This adjustment increased the dog kill rate from 4.0% to 4.3% and the cat kill rate from 9.7% to 10.7%.

In addition, we should increase the kill rate for animals who died or went missing in shelters. In the past, I’ve labeled this metric the death rate as these animals are likely dead or in a very bad situation. Unfortunately, the Shelter/Pound Annual Report includes animals who died or went missing in the “Other” outcome category. The “Other” category contains positive live releases, such as TNR for cats, at a few shelters. While including the “Other” category in the death rate for most shelters is appropriate (i.e. those facilities that don’t do TNR or don’t include cats released through TNR programs in “Other” outcomes), I’m no longer doing this due to an increasing number of shelters implementing TNR. Instead, I calculated the kill rate by subtracting out “Other” outcomes from total outcomes. If a shelter specifies the number of animals included in “Other” that left the shelter alive, I count this as “Other Live Release” and do not back these amounts out of total outcomes. After making this adjustment, the dog kill rate remained at 4.3% and the cat kill rate increased from 10.7% to 11.4%. For those interested in seeing the estimated death rates, you can find them in the supporting spreadsheet.

Also, many shelters transport easy to adopt animals from out of state which artificially increases live release rates. To properly calculate the percentage of New Jersey animals losing their lives, we need to adjust for transports. Unfortunately, shelters don’t break out their kill rates by local and out of state animals. However, most likely nearly all of the out of state animals (primarily puppies and easy to adopt dogs and cats) make it out of shelters alive. Therefore, I back out the number of out of state transports from total outcomes to estimate the local kill rate. This adjustment increases the New Jersey dog kill rate from 4.3% to 5.7% and the state’s cat kill rate from 11.4% to 11.6%.

Also, I estimate a maximum local kill rate by including the number of unaccounted for animals described in the section above. Making this adjustment increases the New Jersey dog kill rate from 5.7% to 10.3% and the state cat kill rate from 11.6% to 14.3%.

Some animal shelters quickly return large percentages of their animals to owners. At these shelters, the populations served are typically well-off and animals are licensed and have microchips. To account for the animals facilities actually have to shelter, I calculated a kill rate for non-reclaimed animals and a maximum potential kill rate for non-reclaimed local animals. The non-reclaimed kill rate and maximum potential kill rate for dogs is 6.2% and 18.0%. Non-reclaimed cats had a 12.2% kill rate and a 15.3% maximum potential kill rate. Thus, the percentage of New Jersey animals losing their lives in our state’s animal shelters may be much higher than the state summary report suggests.

Many Animals Killed Despite Low Statewide Death Rates

The goal of any properly managed animal shelter is to save all of its healthy and treatable animals. In some cases, such as selective admission rescue oriented shelters, it is pretty easy to not kill animals. In addition, other animal shelters with easy to service animal control contracts (i.e. few animals impounded, most strays quickly returned to owners) can avoid unnecessary killing due to having lots of extra space. As a result, some shelters may have an easier time than others in preventing killing at their shelters.

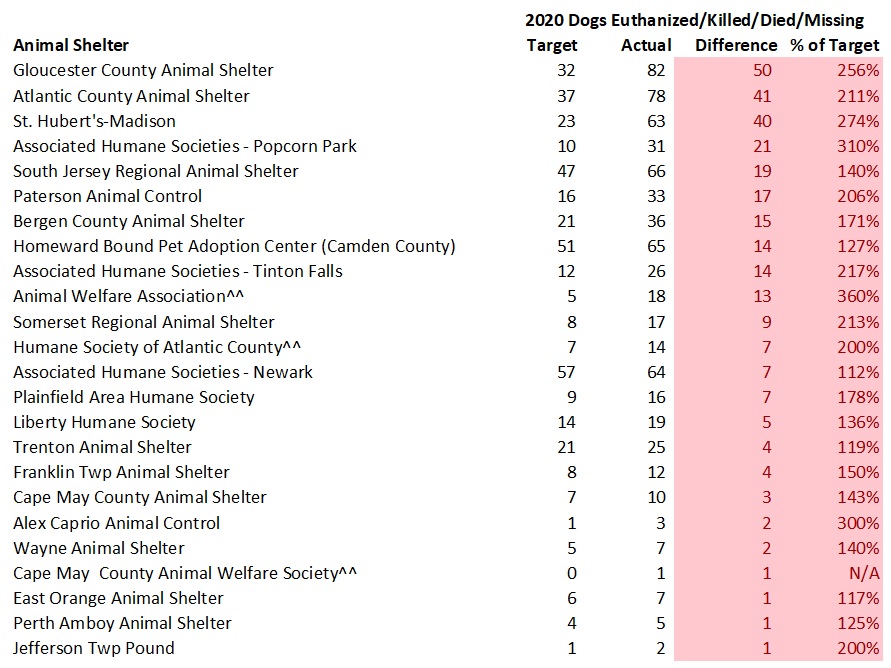
The tables below detail how many dogs should lose their lives at each state animal shelter per my model and the actual numbers of dogs that did. The model’s targets have shelters euthanizing 5% of community dogs (strays, owner surrenders, cruelty/bite cases, etc.) and 1% of dogs rescued from other shelters. All missing or lost dogs are assumed “dead” based on the assumption they died or went to a very bad place. Based on my review of a number of shelters’ underlying documents, virtually all of the dogs in the “Other” outcome category died or went missing. Shelters having the number of dogs losing their lives at or below my targets and above my targets are highlighted in green and red in the tables below.

The largest number of dogs unnecessarily dying occurred at a relatively small number of shelters. Overall, 301 dogs needlessly lost their lives at New Jersey animal shelters in 2020 (i.e. the sum of all shelters killing too many dogs). 10 out of 67 or 15% of the shelters accounted for 81% of the dogs unnecessarily losing their lives under the model’s assumptions. Thus, the bulk of the dogs unnecessarily dying at New Jersey animals shelters occurs at a small number of facilities.

If I use a stricter standard of shelters only having 2% of local dogs losing their lives (which a number of higher volume no kill animal control shelters in other places have achieved), the state’s shelters needlessly killed 555 dogs in 2020.
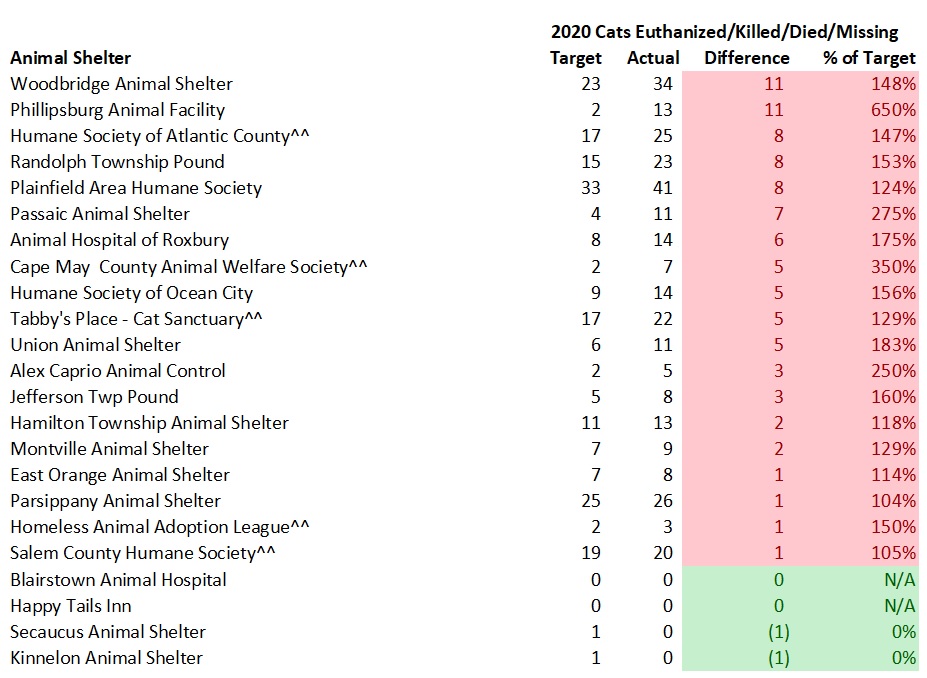
The tables below detail how many cats should lose their lives at each state animal shelter per my model (8% of strays, owner surrenders and other local cats and 5% of cats rescued from other shelters) and the actual numbers of cats that did. All missing or lost cats are assumed “dead” based on the assumption they died or went to a very bad place. Based on my review of a number of shelters’ underlying documents, virtually all of the cats in the “Other” outcome category died or went missing. While a small numbers of shelters could have included some live releases in the “Other” outcome category, it would be misleading to not count these deaths for the overwhelming majority of shelters. Shelters having the number of cats losing their lives at or below my targets and above my targets are highlighted in green and red in the tables below.

The largest number of cats unnecessarily dying occurred at a relatively small number of shelters. Overall, 3,105 cats needlessly lost their lives at New Jersey animal shelters in 2020 (i.e. the sum of all shelters killing too many cats). 10 out of 65 or 15% of the shelters accounted for 86% of the cats unnecessarily losing their lives under the model’s assumptions. Thus, almost all of the cats unnecessarily dying at New Jersey animals shelters happens at a small number of facilities.

Kill Rates Extremely High at a Number of New Jersey Animal Shelters

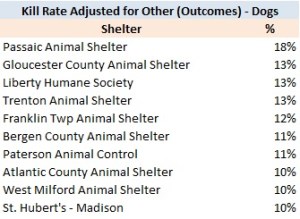
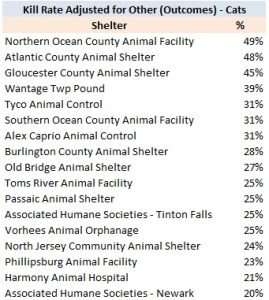
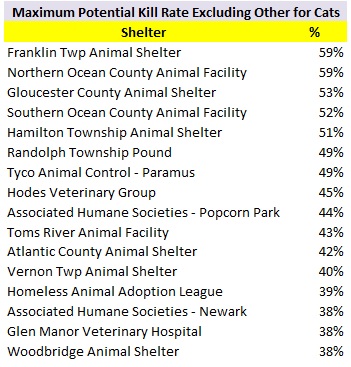
Dogs and cats are likely to lose their lives at a number of New Jersey animal shelters. Shelters with the highest kill rates for dogs and cats (excluding very low intake facilities) are listed in the following tables:

Thus, both dogs and cats have a very good chance of leaving many New Jersey animal shelters dead rather than alive.

In terms of raw numbers, the following shelters killed the most animals:

Many shelters fail to account for large numbers of their animals. As discussed above, a shelter’s number of animals at the end of the year should be calculated as follows:

Beginning number of animals + animals impounded – animals leaving the shelter

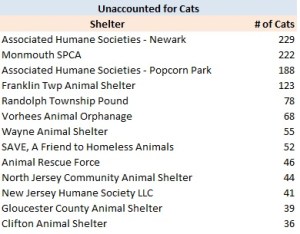
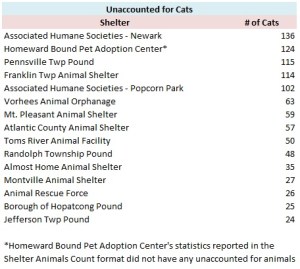
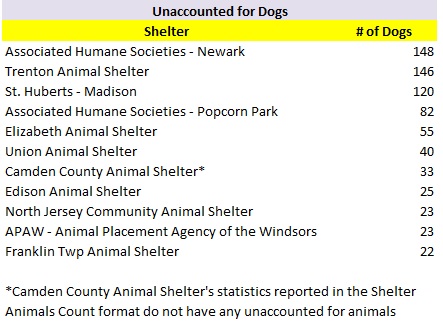
Unfortunately, a large number of shelters take in far more animals than they can explain where they went. Shelters having the highest numbers of unaccounted for dogs and cats are listed in the following tables:

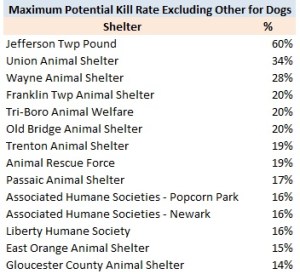
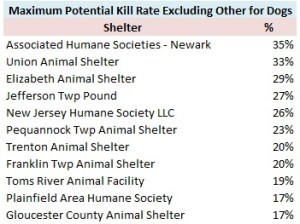
Dog and cat kill rates at many shelters may be even higher if these unaccounted for animals are counted as killed. If we only consider animal shelters which reported transporting few or no animals in 2020, facilities with the highest dog and cat kill rates considering the unaccounted for animals described above are as follows:

Thus, the plight of dogs and cats may be far worse in New Jersey animal shelters when we consider the unaccounted for animals.

Shelters Turn Their Backs on New Jersey’s Animals

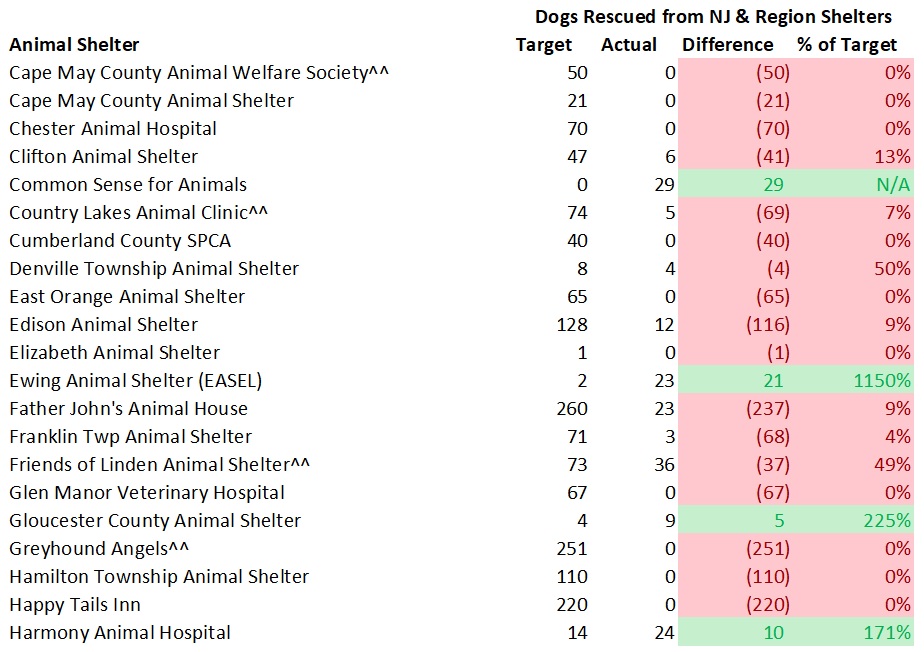
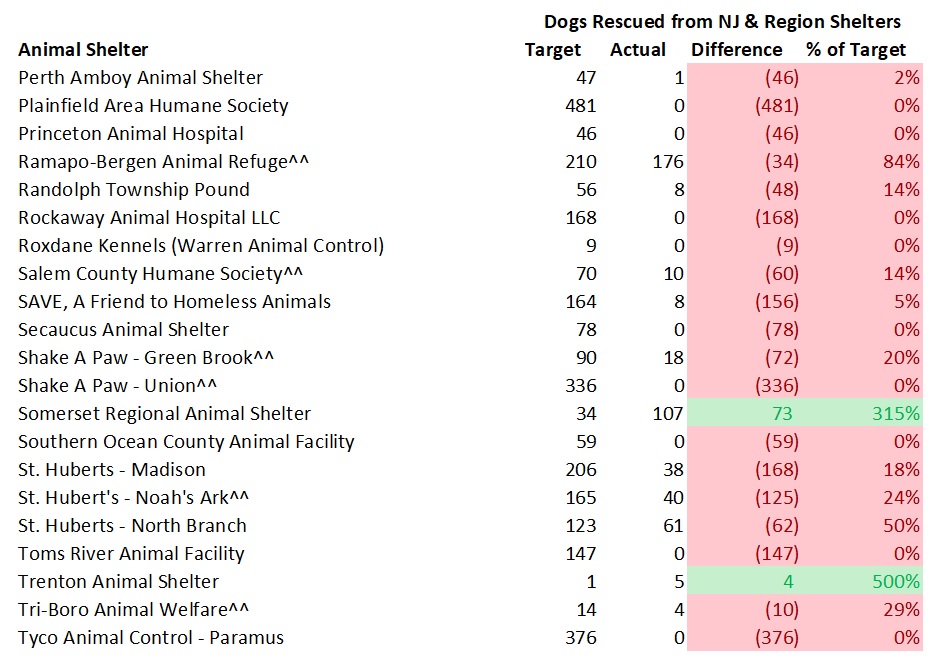
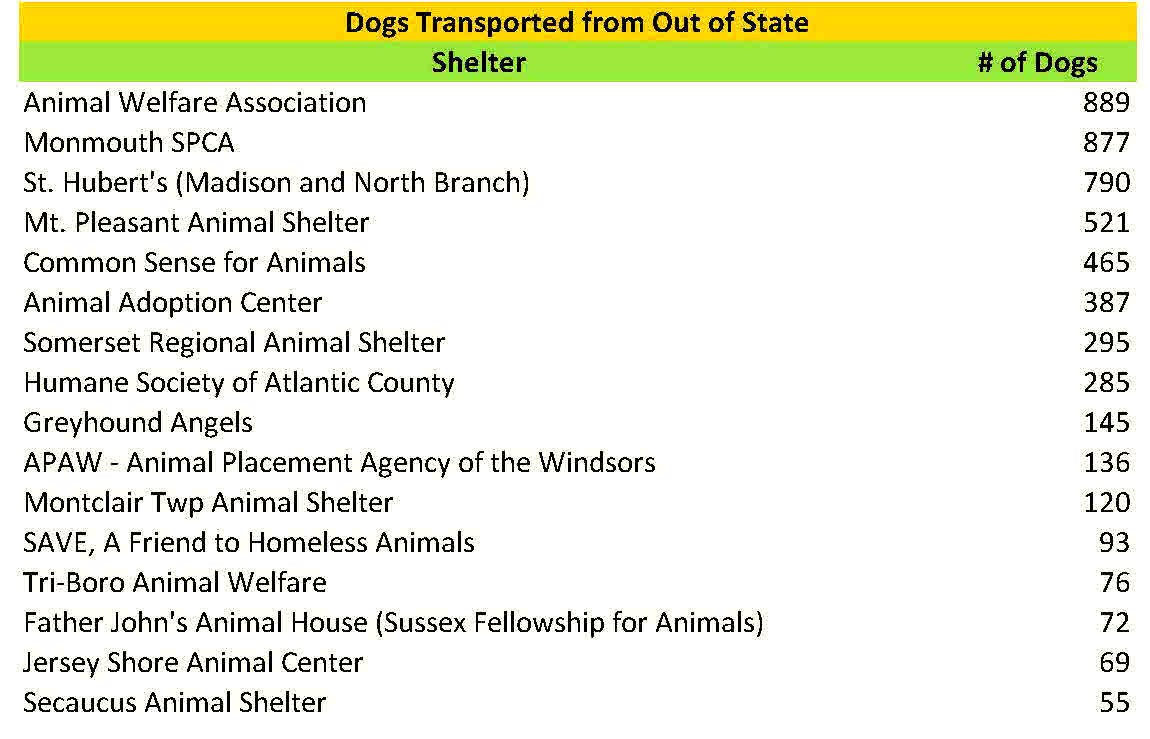
New Jersey animal shelters rescue far more dogs from out of state than from other New Jersey animal shelters. Specifically, New Jersey animal shelters transferred in 3,041 dogs from out of state animal shelters and only rescued 870 dogs from other New Jersey animal shelters. While fewer dogs were available for rescue in 2020, the pattern is consistent with past years.

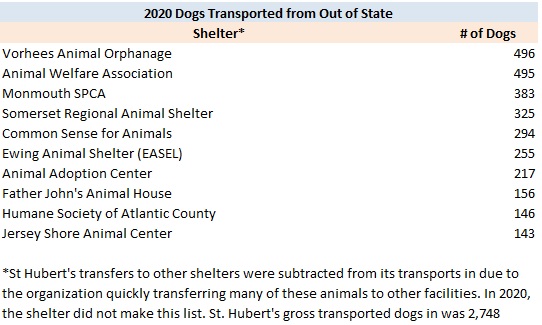
While perhaps some shelters take animals from nearby New York or Pennsylvania animal control shelters, the overwhelming majority of these dogs most certainly came from down south. In fact, New Jersey animal shelters transported more dogs from out of state than dogs who were killed in New Jersey animal shelters. This number does not include additional out of state dogs transported into New Jersey by rescues operating without a physical facility. Shelters transporting the most dogs from out of state were as follows:

In 2020, several New Jersey animal shelters transported many cats from out of state. Its not clear if or how many of the cats EASEL took in from out of state were from nearby Pennsylvania or other places further away.

Shelters Do Far Worse with Animals Requiring New Homes

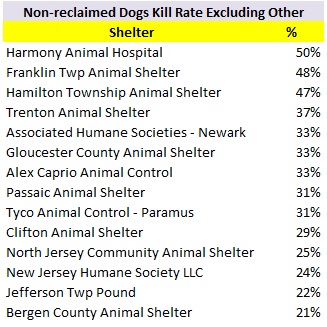
Since dogs reclaimed by their owners typically have licenses and/or microchips and quickly leave the shelter, its informative to look at dogs shelters have to find new homes for. To get a better idea of how organizations are doing with animals they actually have to shelter, I also examined what percentage of non-reclaimed dogs lose their lives at each facility. Shelters with the highest non-reclaimed dogs kill rates are as follows (excluding shelters taking few unclaimed dogs in):

Shelters with the highest maximum non-reclaimed dog kill rates are as follows (excluding facilities that reported transporting many dogs in and taking very few unclaimed animals in):

Shelters Leave Animal Enclosures Empty While Dogs and Cats Die

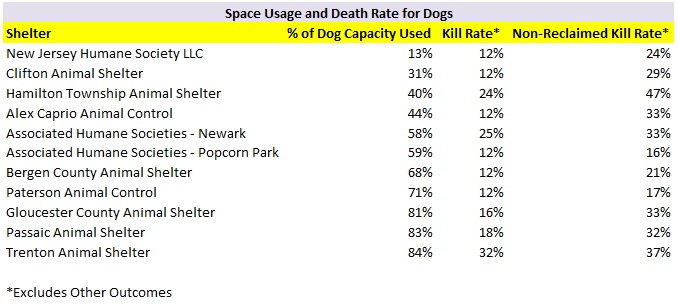
New Jersey animal shelters fail to use their space to save animals. Based on the average number of animals at all of New Jersey’s animal shelters at the beginning and the end of 2020, only 52% of dog and 74% of cat capacity was used. Given December is a low intake month, I also increased these populations to an average intake month. This adjustment only raised the dog capacity utilization to 54%. While this adjustment did increase the cat capacity utilization to 92%, it is highly unlikely this happened in reality. Shelter inspection reports I’ve reviewed often did not reveal significantly larger dog and cat populations in the summer and winter months. This is likely due to the influx of highly adoptable kittens having short lengths of stay and shelters killing cats with empty cages.

Many animal shelters with low kill rates failed to rescue animals with their excess space. Additionally, other shelters used little of their available space and still killed a large percentage of their animals. Some examples after increasing the population (and therefore capacity utilization) based on the adjustment discussed above are as follows:

Thus, many New Jersey animal shelters are killing dogs and cats despite having ample space to house these animals.

Shelters Show No Respect for Life for Animals Outside of Those Facilities

As I wrote in my last blog, 2020 was the most unusual year in the history of animal sheltering. The COVID-19 pandemic caused many shelters to restrict animal intake and the public, who were home more, lost fewer pets and fostered more animals. As a result, shelters took significantly fewer animals in and had more open animal enclosures than in the past.

On the other hand, many shelters across the country took it a step further and refused to help animals in need. Therefore, we must differentiate between shelters whose intake decreased due to pandemic related reasons and those who exploited COVID-19 to do less work and put animals at risk outside those facilities’ walls.

The following tables detail the shelters whose dog and cat intake decreased the most in 2020. As you can see, these shelters animal intake decreased significantly more than both the decrease for shelters across the country using PetPoint software (24% and 21% decrease for dogs and cats) and for New Jersey animal shelters as a whole (22% and 13% decrease for dogs and cats).

New Jersey’s animal shelters continue to fail the state’s animals. The state’s animal shelters only impounded 5.9 dogs and cats per 1,000 New Jersey residents in 2020. If we just count animals originating from New Jersey, the state’s animal shelters only impounded 5.2 dogs and cats per 1,000 people in 2020. As a comparison, Florida’s Lake County Animal Shelter took in 10.9 dogs and cats in 2020 and saved 98% of its dogs and 94% of its cats due to it fully implementing the No Kill Equation. Despite New Jersey shelters impounding a fraction of the animals many no kill communities take in on a per capita basis, the state’s animal control facilities continue to kill and allow animals to die under their care and outside their walls. Even worse, many of these shelters can’t even properly keep track of how many animals leave their facilities dead or alive. Our state’s animals deserve far better treatment than this. Contact your local city council members and mayor and demand better from the animal shelter serving your community. We can do so much better and it is time our shelters operate this way.

New Jersey’s Highest Kill Shelters in 2019

Recently, I wrote a blog discussing decreased killing at New Jersey animal shelters in 2019. This blog will explore the 2019 statistics in more detail and assess the current status of the state’s animal shelters.

Most New Jersey animal shelters voluntarily report detailed data to state authorities. Earlier this year, I shared the 2019 summary statistics for New Jersey animal shelters on my Facebook page. Each year, the New Jersey Department of Health requests each licensed animal shelter in the state to submit animal shelter data for the previous year. Animal shelters voluntarily submit this data in the “Shelter/Pound Annual Report.” The New Jersey Department of Health takes these Shelter/Pound Annual Reports and compiles the number of dogs, cats and other animals impounded, redeemed, adopted and euthanized to prepare its Animal Intake and Disposition report. However, the Shelter/Pound Annual Reports include additional information on how animals were impounded (i.e. strays, owner surrenders, rescued from in-state facilities, rescued from out of state shelters, and cruelty/bite cases/other) and disposed of (i.e. returned to owner, adopted, sent to rescue/another shelter, and died/missing/other outcome). Additionally, the Shelter/Pound Annual Reports include the number of animals in shelters at the beginning and end of the year as well as the maximum number of animals facilities can hold. Thus, the Shelter/Pound Annual Reports include very important data not found in the New Jersey Department of Health’s summary report.

I compiled the data from these reports and analyze the results in this blog. 2019 statistics for each New Jersey animal shelter are listed at this link. You can also view each “Shelter/Pound Annual Report” at this link.

Garbage Data Raises Serious Questions About New Jersey Animal Shelters’ Statistics

Most New Jersey animal shelters do not properly account for their animals. Simple math dictates the number of animals at a facility at the beginning of the year, plus all animals coming in during the year, less all animals leaving for the period, should equal the number of animals a shelter has at the end of the year. Stunningly, 47 out of 91 shelters reporting these dog statistics and 50 out of 89 facilities submitting this cat data failed to get this right. This raises serious questions about the accuracy of these shelters’ reported statistics. 31 of the 47 shelters with flawed dog statistics and 32 of the 50 facilities with incorrect cat statistics should have had more animals at the end of the year than reported. While these errors could have been due to incorrect counts of the number of animals at facilities, these shelters may have not recorded outcomes, such as animals who were killed, died, or went missing. To put it another way, 1,934 cats and dogs should have had outcomes reported and did not. Thus, there is the potential that as many as 1,934 additional dogs and cats were killed, died or went missing from New Jersey animal shelters than were reported in 2019.

Even worse, a number of animal shelters reported having a different number of animals at the end of 2018 and at the beginning of 2019. Obviously, shelters should report the same number of animals at the end of the prior year and the start of the current year. However, 32 of 88 shelters reported different numbers of dogs at the end of 2018 and the beginning of 2019. Similarly, 37 of 87 shelters reported different numbers of cats at the end of 2018 and the beginning of 2019. The worst offenders are listed in the tables below:

Shelters may have failed to classify animals adopted out and sent to rescues properly. Both Paterson Animal Control and Elizabeth Animal Shelter reported no animals were sent to rescues and all dogs and cats leaving their facilities alive were owner reclaims or adoptions. However, intake and disposition records I reviewed at both of these shelters in recent years revealed almost all “adopted” animals are actually rescued. One has to wonder how many other facilities failed to properly classify adoptions and rescues properly. This data is very important as it provides details on the burden rescues and other shelters are taking on from these facilities.

We need better oversight of New Jersey animal shelters’ data reporting. Currently, these statistics are voluntarily reported and most shelters are not taking this seriously. For example, I noticed a large number of reports were submitted many months after the end of the year. This data should be easy to compile since facilities can utilize animal shelter software programs, some of which are free, to do this task. Furthermore, New Jersey animal shelter laws mandate facilities maintain much of the raw data found in the Shelter/Pound Annual Report. Unfortunately, New Jersey Department of Health inspections routinely find shelters do not properly keep records on animals. We need to make the data reporting mandatory for animal shelters as the shelter reform bill, S636, does along with serious penalties for significant errors (especially if deliberate). In order for animal shelters to take data reporting seriously, we may also need to require audits of these reports. Thus, these results show we need stronger laws and the New Jersey Department of Health to play a greater role in ensuring reported animal shelter statistics are in fact accurate.

Despite the errors in these reports, the data provided still reveals important information.

More Animals Losing Their Lives in New Jersey Animal Shelters Than Disclosed in Summary Report

The more detailed data in the Shelter/Pound Annual Reports allows one to more critically examine the percentage of locally impounded animals dying in New Jersey’s animal shelters. The following table summarizes my analysis of the kill rate calculated from the New Jersey Department of Health’s summary report and the data reported in the Shelter/Pound Annual Reports.

The statistics include an estimate to remove animals St. Hubert’s transfers in and quickly transfers out through its Sister Shelter WayStation program. Since St. Hubert’s is effectively acting as a middle man and not holding these animals very long, it makes sense to exclude these dogs and cats from the various kill rate statistics. If I did not exclude these animals, I would understate the dog and cat kill rates due to inflated intakes and outcomes numbers. Therefore, I removed all of St. Hubert’s dogs transferred out from the intake and outcomes figures in the metrics. Since St. Hubert’s primarily uses the Sister Shelter Waystation program to quickly transfer in cats and send them to out of state facilities, I only backed out the cats St. Hubert’s transferred to out of state organizations in the various kill rates. This adjustment increased the dog kill rate (intake) from 5.1 to 5.7% and the cat kill rate (intake) from 15.2% to 15.4%.

The Animal Intake and Disposition report prepared by the New Jersey Department of Health only allows one to calculate the number of animals killed as a percentage of total animals impounded or intake. I prefer calculating the kill rate as a percentage of outcomes rather than intake as this metric directly compares positive and negative outcomes. Using intake may depress the kill rate since shelters can simply hold animals for a long time to the point of overcrowding. Calculating the kill rate based on outcomes rather than intake caused the dog kill rate to decrease from 5.7% to 5.6% and the cat kill rate to increase from 15.4% to 15.6%.

To calculate the statewide kill rate, we must also back out transfers from one New Jersey animal shelter to another state facility to avoid counting animals still in the state’s shelter system or registering two outcomes for the same animal (i.e. one New Jersey animal shelter transfers a dog or cat to another state facility which then adopts out the animal). This adjustment increases the dog kill rate from 5.6% to 6.0% and the cat kill rate from 15.6% to 16.6%.

In addition, we should increase the kill rate for animals who died or went missing in shelters. In the past, I’ve labeled this metric the death rate as these animals are likely dead or in a very bad situation. Unfortunately, the Shelter/Pound Annual Report includes animals who died or went missing in the “Other” outcome category. The “Other” category contains positive live releases, such as TNR for cats, at a few shelters. While including the “Other” category in the death rate for most shelters is appropriate (i.e. those facilities that don’t do TNR or don’t include cats released through TNR programs in “Other” outcomes), I’m no longer doing this due to an increasing number of shelters implementing TNR. Instead, I calculated the kill rate by subtracting out “Other” outcomes from total outcomes. If a shelter specifies the number of animals included in “Other” that left the shelter alive, I count this as “Other Live Release” and do not back these amounts out of total outcomes. After making this adjustment, the dog kill rate increased from 6.0% to 6.1% and the cat kill rate stayed at 16.6%. For those interested in seeing the estimated death rates, you can find them in the supporting spreadsheet.

Also, many shelters transport easy to adopt animals from out of state which artificially increases live release rates. To properly calculate the percentage of New Jersey animals losing their lives, we need to adjust for transports. Unfortunately, shelters don’t break out their kill rates by local and out of state animals. However, most likely nearly all of the out of state animals (primarily puppies and easy to adopt dogs and cats) make it out of shelters alive. Therefore, I back out the number of out of state transports from total outcomes to estimate the local kill rate. This adjustment increases the New Jersey dog kill rate from 6.1% to 7.7% and the state’s cat kill rate from 16.6 to 17.8%.

Also, I estimate a maximum local kill rate by including the number of unaccounted for animals described in the section above. Making this adjustment increases the maximum potential New Jersey dog kill rate from 7.7% to 10.2% and the maximum potential state cat kill rate from 17.8% to 20.7%.

Some animal shelters quickly return large percentages of their animals to owners. At these shelters, the populations served are typically well-off and animals are licensed and have microchips. To account for the animals facilities actually have to shelter, I calculated a kill rate for non-reclaimed animals and a maximum potential kill rate for non-reclaimed local animals. The non-reclaimed kill rate and maximum potential kill rate for dogs is 9.0% and 17.8%. Non-reclaimed cats had a 18.8% kill rate and a 22.1% maximum potential kill rate. Thus, the percentage of New Jersey animals losing their lives in our state’s animal shelters may be much higher than the state summary report suggests.

Kill Rates Extremely High at a Number of New Jersey Animal Shelters

Dogs and cats are likely to lose their lives at a number of New Jersey animal shelters. Shelters with the highest kill rates for dogs and cats (excluding very low intake facilities) are listed in the following tables:

Thus, both dogs and cats have a very good chance of leaving many New Jersey animal shelters dead rather than alive.

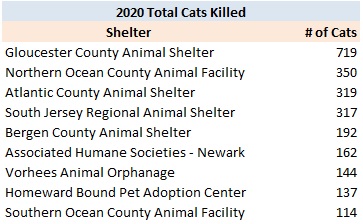
In terms of raw numbers, the following shelters killed the most animals:
Many shelters fail to account for large numbers of their animals. As discussed above, a shelter’s number of animals at the end of the year should be calculated as follows:

Beginning number of animals + animals impounded – animals leaving the shelter

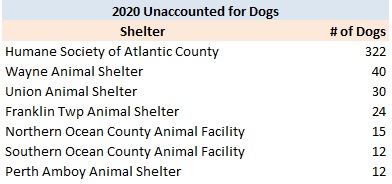
Unfortunately, a large number of shelters take in far more animals than they can explain where they went. Shelters having the highest numbers of unaccounted for dogs and cats are listed in the following tables:
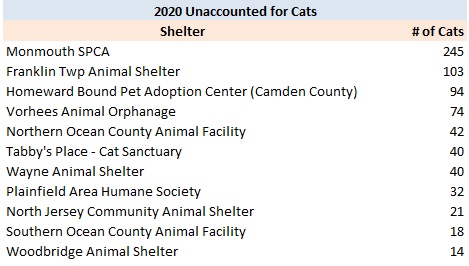
Dog and cat kill rates at many shelters may be even higher if these unaccounted for animals are counted as killed. If we only consider animal shelters which reported transporting few or no animals in 2019, facilities with the highest dog and cat kill rates considering the unaccounted for animals described above are as follows:

Thus, the plight of dogs and cats may be far worse in New Jersey animal shelters when we consider the unaccounted for animals.

Shelters Turn Their Backs on New Jersey’s Animals

New Jersey animal shelters rescue far more dogs from out of state than from other New Jersey animal shelters. Specifically, New Jersey animal shelters transferred in 8,197 dogs from out of state animal shelters and only rescued 2,308 dogs from other New Jersey animal shelters. However, St. Hubert’s frequently transfers a substantial number of its transports quickly to its partners in New Jersey and other states. If I back out St. Hubert’s transfers of dogs to out of state organizations, the number of transports decreases from 8,197 dogs to 5,269 dogs. While the state’s local kill rate decreased in 2019, it is likely the local kill rate would have decreased by more if not for the massive number of out of state transports.

While perhaps some shelters take animals from nearby New York or Pennsylvania animal control shelters, the overwhelming majority of these dogs most certainly came from down south. In fact, New Jersey animal shelters transported more dogs from out of state than dogs who were killed in New Jersey animal shelters. This number does not include additional out of state dogs transported into New Jersey by rescues operating without a physical facility. Shelters transporting the most dogs from out of state were as follows:
Shelters Do Far Worse with Animals Requiring New Homes

Since dogs reclaimed by their owners typically have licenses and/or microchips and quickly leave the shelter, its informative to look at dogs shelters have to find new homes for. To get a better idea of how organizations are doing with animals they actually have to shelter, I also examined what percentage of non-reclaimed dogs lose their lives at each facility. Shelters with the highest non-reclaimed dogs kill rates are as follows (excluding shelters taking few unclaimed dogs in):

Shelters with the highest maximum non-reclaimed dogs kill rates are as follows (excluding facilities that reported transporting many dogs in and taking very few unclaimed animals in):

Shelters Leave Animal Enclosures Empty While Dogs and Cats Die

New Jersey animal shelters fail to use their space to save animals. Based on the average number of animals at all of New Jersey’s animal shelters at the beginning and the end of 2019, only 57% of dog and 75% of cat capacity was used. Given December is a low intake month, I also increased these populations to an average intake month. This adjustment only raised the dog capacity utilization to 62%. While this adjustment did increase the cat capacity utilization to over 100%, it is highly unlikely this happened in reality. Shelter inspection reports I’ve reviewed often did not reveal significantly larger dog and cat populations in the summer and winter months. This is likely due to the influx of highly adoptable kittens having short lengths of stay and shelters killing cats with empty cages.

Many animal shelters with low kill rates failed to rescue animals with their excess space. Additionally, other shelters used little of their available space and still killed a large percentage of their animals. Some examples after increasing the population (and therefore capacity utilization) based on the adjustment discussed above are as follows:

Thus, many New Jersey animal shelters are killing dogs and cats despite having ample space to house these animals.

New Jersey’s animal shelters continue to fail the state’s animals. The state’s animal shelters only impound 8.9 dogs and cats per 1,000 New Jersey residents. If we just count animals originating from New Jersey, the state’s animal shelters only impound 7.2 dogs and cats per 1,000 people. As a comparison, Florida’s Lake County Animal Shelter took in 15.1 dogs and cats in 2019 and saved 99% of its dogs, 98% of its pit bull like dogs and 91% of its cats due to it fully implementing the No Kill Equation. Despite New Jersey shelters impounding a fraction of the animals many no kill communities take in on a per capita basis, the state’s animal control facilities continue to kill and allow animals to die under their care. Even worse, many of these shelters can’t even properly keep track of how many animals leave their facilities dead or alive. Our state’s animals deserve far better treatment than this. Contact your local city council members and mayor and demand better from the animal shelter serving your community. We can do so much better and it is time our shelters operate this way.

New Jersey’s Highest Kill Shelters in 2018

Recently, I wrote a blog discussing decreased killing at New Jersey animal shelters in 2018. This blog will explore the 2018 statistics in more detail and assess the current status of the state’s animal shelters.

Most New Jersey animal shelters voluntarily report detailed data to state authorities. Last month, I shared the 2018 summary statistics for New Jersey animal shelters on my Facebook page. Each year, the New Jersey Department of Health requests each licensed animal shelter in the state to submit animal shelter data for the previous year. Animal shelters voluntarily submit this data in the “Shelter/Pound Annual Report.” The New Jersey Department of Health takes these Shelter/Pound Annual Reports and compiles the number of dogs, cats and other animals impounded, redeemed, adopted and euthanized to prepare its Animal Intake and Disposition report. However, the Shelter/Pound Annual Reports include additional information on how animals were impounded (i.e. strays, owner surrenders, rescued from in-state facilities, rescued from out of state shelters, and cruelty/bite cases/other) and disposed of (i.e. returned to owner, adopted, sent to rescue/another shelter, and died/missing/other outcome). Additionally, the Shelter/Pound Annual Reports include the number of animals in shelters at the beginning and end of the year as well as the maximum number of animals facilities can hold. Thus, the Shelter/Pound Annual Reports include very important data not found in the New Jersey Department of Health’s summary report.

I compiled the data from these reports and analyze the results in this blog. 2018 statistics for each New Jersey animal shelter are listed at this link. You can also view each “Shelter/Pound Annual Report” at this link.

Garbage Data Raises Serious Questions About New Jersey Animal Shelters’ Statistics

Most New Jersey animal shelters do not properly account for their animals. Simple math dictates the number of animals at a facility at the beginning of the year, plus all animals coming in during the year, less all animals leaving for the period, should equal the number of animals a shelter has at the end of the year. Stunningly, 56 out of 92 shelters reporting these dog statistics and 59 out of 91 facilities submitting this cat data failed to get this right. This raises serious questions about the accuracy of these shelters’ reported statistics. 32 of the 56 shelters with flawed dog statistics and 34 of the 59 facilities with incorrect cat statistics should have had more animals at the end of the year than reported. While these errors could have been due to incorrect counts of the number of animals at facilities, these shelters may have not recorded outcomes, such as animals who were killed, died, or went missing. To put it another way, 2,002 cats and dogs should have had outcomes reported and did not. Thus, there is the potential that as many as 2,002 additional dogs and cats were killed, died or went missing from New Jersey animal shelters than were reported in 2018.

Even worse, a number of animal shelters reported having a different number of animals at the end of 2017 and at the beginning of 2018. Obviously, shelters should report the same number of animals at the end of the prior year and the start of the current year. However, 32 of 92 shelters reported different numbers of dogs at the end of 2017 and the beginning of 2018. Similarly, 37 of 91 shelters reported different numbers of cats at the end of 2017 and the beginning of 2018. The worst offenders are listed in the tables below:

Shelters may have failed to classify animals adopted out and sent to rescues properly. Both Paterson Animal Control and Elizabeth Animal Shelter reported no animals were sent to rescues and all dogs and cats leaving their facilities alive were owner reclaims or adoptions. However, intake and disposition records I reviewed at both of these shelters in recent years revealed almost all “adopted” animals are actually rescued. One has to wonder how many other facilities failed to properly classify adoptions and rescues properly. This data is very important as it provides details on the burden rescues and other shelters are taking on from these facilities.

We need better oversight of New Jersey animal shelters’ data reporting. Currently, these statistics are voluntarily reported and most shelters are not taking this seriously. For example, I noticed a large number of reports were submitted many months after the end of the year. This data should be easy to compile since facilities can utilize animal shelter software programs, some of which are free, to do this task. Furthermore, New Jersey animal shelter laws mandate facilities maintain much of the raw data found in the Shelter/Pound Annual Report. Unfortunately, New Jersey Department of Health inspections routinely find shelters do not properly keep records on animals. We need to make the data reporting mandatory for animal shelters as the shelter reform bill, S725, does along with serious penalties for significant errors (especially if deliberate). In order for animal shelters to take data reporting seriously, we may also need to require audits of these reports. Thus, these results show we need stronger laws and the New Jersey Department of Health to play a greater role in ensuring reported animal shelter statistics are in fact accurate.

Despite the errors in these reports, the data provided still reveals important information.

More Animals Losing Their Lives in New Jersey Animal Shelters Than Disclosed in Summary Report

The more detailed data in the Shelter/Pound Annual Reports allows one to more critically examine the percentage of locally impounded animals dying in New Jersey’s animal shelters. The following table summarizes my analysis of the kill rate calculated from the New Jersey Department of Health’s summary report and the data reported in the Shelter/Pound Annual Reports.

This year I revised the cat statistics to remove an estimate of the cats St. Hubert’s transfers in and quickly transfers out through its Sister Shelter WayStation program. Previously, I made this adjustment only for dogs. Since St. Hubert’s is effectively acting as a middle man and not holding these animals very long, it makes sense to exclude these dogs and cats from the various kill rate statistics. If I did not exclude these animals, I would understate the dog and cat kill rates due to inflated intakes and outcomes numbers. Therefore, I removed all of St. Hubert’s dogs transferred out from the intake and outcomes figures in the metrics. Since St. Hubert’s primarily uses the Sister Shelter Waystation program to quickly transfer in cats and send them to out of state facilities, I only backed out the cats St. Hubert’s transferred to out of state organizations in the various kill rates. This adjustment increased the dog kill rate (intake) from 5.5 to 6.3% and the cat kill rate (intake) from 16.1% to 16.3%.

The Animal Intake and Disposition report prepared by the New Jersey Department of Health only allows one to calculate the number of animals killed as a percentage of total animals impounded or intake. I prefer calculating the kill rate as a percentage of outcomes rather than intake as this metric directly compares positive and negative outcomes. Using intake may depress the kill rate since shelters can simply hold animals for a long time to the point of overcrowding. Calculating the kill rate based on outcomes rather than intake caused the dog kill rate to increase from 6.3% to 6.4% and the cat kill rate to increase from 16.3% to 16.7%.

To calculate the statewide kill rate, we must also back out transfers from one New Jersey animal shelter to another state facility to avoid counting animals still in the state’s shelter system or registering two outcomes for the same animal (i.e. one New Jersey animal shelter transfers a dog or cat to another state facility which then adopts out the animal). This adjustment increases the dog kill rate from 6.4% to 6.8% and the cat kill rate from 16.7% to 18.0%.

In addition, we should increase the kill rate for animals who died or went missing in shelters. In the past, I’ve labeled this metric the death rate as these animals are likely dead or in a very bad situation. Unfortunately, the Shelter/Pound Annual Report includes animals who died or went missing in the “Other” outcome category. The “Other” category contains positive live releases, such as TNR for cats, at a few shelters. While including the “Other” category in the death rate for most shelters is appropriate (i.e. those facilities that don’t do TNR or don’t include cats released through TNR programs in “Other” outcomes), I’m no longer doing this due to an increasing number of shelters implementing TNR. Instead, I calculated the kill rate by subtracting out “Other” outcomes from total outcomes. If a shelter specifies the number of animals included in “Other” that left the shelter alive, I count this as “Other Live Release” and do not back these amounts out of total outcomes. After making this adjustment, the dog kill rate remained at 6.8% and the cat kill rate also stayed at 18.0%. For those interested in seeing the estimated death rates, you can find them in the supporting spreadsheet.

Also, many shelters transport easy to adopt animals from out of state which artificially increases live release rates. To properly calculate the percentage of New Jersey animals losing their lives, we need to adjust for transports. Unfortunately, shelters don’t break out their save rates by local and out of state animals. However, most likely nearly all of the out of state animals (primarily puppies and easy to adopt dogs and cats) make it out of shelters alive. Therefore, I back out the number of out of state transports from total outcomes to estimate the local kill rate. This adjustment increases the New Jersey dog kill rate from 6.8% to 9.2% and the state’s cat kill rate from 18.0 to 19.3%.

Also, I estimate a maximum local kill rate by including the number of unaccounted for animals described in the section above. Making this adjustment increases the maximum potential New Jersey dog kill rate from 9.2 to 12.9% and the maximum potential state cat kill rate from 19.3% to 21.3%.

Some animal shelters quickly return large percentages of their animals to owners. At these shelters, the populations served are typically well-off and animals are licensed and have microchips. To account for the animals facilities actually have to shelter, I calculated a kill rate for non-reclaimed animals and a maximum potential kill rate for non-reclaimed local animals. The non-reclaimed kill rate and maximum potential kill rate for dogs is 9.7% and 21.0%. Non-reclaimed cats had a 20.4% kill rate and a 22.9% maximum potential kill rate. Thus, the percentage of New Jersey animals losing their lives in our state’s animal shelters may be much higher than the state summary report suggests.

Kill Rates Extremely High at a Number of New Jersey Animal Shelters

Dogs and cats are likely to lose their lives at a number of New Jersey animal shelters. Shelters with the highest kill rates for dogs and cats (excluding very low intake facilities) are listed in the following tables:

Thus, both dogs and cats have a very good chance of leaving many New Jersey animal shelters dead rather than alive.

In terms of raw numbers, the following shelters killed the most animals:

Many shelters fail to account for large numbers of their animals. As discussed above, a shelter’s number of animals at the end of the year should be calculated as follows:

Beginning number of animals + animals impounded – animals leaving the shelter

Unfortunately, a large number of shelters take in far more animals than they can explain where they went. Shelters having the highest numbers of unaccounted for dogs and cats are listed in the following tables:

Dog and cat kill rates at many shelters may be even higher if these unaccounted for animals are counted as killed. If we only consider animal shelters which reported transporting few or no animals in 2018, facilities with the highest dog and cat kill rates considering the unaccounted for animals described above are as follows:

Thus, the plight of dogs and cats may be far worse in New Jersey animal shelters when we consider the unaccounted for animals.

Shelters Turn Their Backs on New Jersey’s Animals

New Jersey animal shelters rescue far more dogs from out of state than from other New Jersey animal shelters. Specifically, New Jersey animal shelters transferred in 10,131 dogs from out of state animal shelters and only rescued 2,399 dogs from other New Jersey animal shelters. However, St. Hubert’s frequently transfers a substantial number of its transports quickly to its partners in New Jersey and other states. If I back out St. Hubert’s transfers of dogs to out of state organizations, the number of transports decreases from 10,131 dogs to 6,360 dogs. While the state’s local kill rate decreased in 2018, it is likely the local kill rate would have decreased by more if not for the massive number of out of state transports.

While perhaps some shelters, such as Animal Alliance in Lambertville, take animals from nearby New York or Pennsylvania animal control shelters, the overwhelming majority of these dogs most certainly came from down south. In fact, New Jersey animal shelters transported more dogs from out of state than dogs who were killed in New Jersey animal shelters. This number does not include additional out of state dogs transported into New Jersey by rescues operating without a physical facility. Shelters transporting the most dogs from out of state were as follows:

Shelters Do Far Worse with Animals Requiring New Homes

Since dogs reclaimed by their owners typically have licenses and/or microchips and quickly leave the shelter, its informative to look at dogs shelters have to find new homes for. To get a better idea of how organizations are doing with animals they actually have to shelter, I also examined what percentage of non-reclaimed dogs lose their lives at each facility. Shelters with the highest non-reclaimed dogs kill rates are as follows:

Shelters with the highest maximum non-reclaimed dogs kill rates are as follows (excluding facilities that reported transporting many dogs in and taking very few animals in):

Shelters Leave Animal Enclosures Empty While Dogs and Cats Die

New Jersey animal shelters fail to use their space to save animals. Based on the average number of animals at all of New Jersey’s animal shelters at the beginning and the end of 2018, only 62% of dog and 75% of cat capacity was used. Given December is a low intake month, I also increased these populations to an average intake month. This adjustment only raised the dog capacity utilization to 70%. While this adjustment did increase the cat capacity utilization to over 100%, it is highly unlikely this happened in reality. Shelter inspection reports I’ve reviewed often did not reveal significantly larger dog and cat populations in the summer and winter months. This is likely due to the influx of highly adoptable kittens having short lengths of stay and shelters killing cats with empty cages.

Many animal shelters with low kill rates failed to rescue animals with their excess space. Additionally, other shelters used little of their available space and still killed a large percentage of their animals. Some examples after increasing the population (and therefore capacity utilization) based on the adjustment discussed above are as follows:

Thus, many New Jersey animal shelters are killing dogs and cats despite having ample space to house these animals.

New Jersey’s animal shelters continue to fail the state’s animals. The state’s animal shelters only impound 8.6 dogs and cats per 1,000 New Jersey residents. If we just count animals originating from New Jersey, the state’s animal shelters only impound 7.4 dogs and cats per 1,000 people. As a comparison, the average community in the country impounds anywhere from 14 animals per 1,000 residents based on estimates from Animal People Newspaper and No Kill Movement. Despite New Jersey shelters impounding a fraction of the animals other no kill communities take in on a per capita basis, the state’s animal control facilities continue to kill and allow animals to die under their care. Even worse, many of these shelters can’t even properly keep track of how many animals leave their facilities dead or alive. Our state’s animals deserve far better treatment than this. Contact your local city council members and mayor and demand better from the animal shelter serving your community. We can do so much better and it is time our shelters operate this way.
2017 Dog Report Cards for New Jersey Animal Shelters

In a blog from earlier this year, I disclosed New Jersey’s depressing animal shelter statistics. This blog explains why so many dogs are losing their lives in the state’s animal shelters and whether these facilities can end the killing.

Successful organizations set measurable goals and regularly monitor their performance. Examples include financial budgets, customer and employee satisfaction surveys, and product reliability metrics. Unfortunately, many animal shelters for far too long have failed to set lifesaving goals and standards. Municipalities, donors and volunteers need to know where their resources will be best utilized. Time and money are scarce resources and people should allocate these assets to organizations who will best utilize them. As a result, animal shelters need to set goals and hold their leadership and staff accountable for achieving these objectives.

Model Assesses New Jersey Animal Shelters’ Life Saving Performance

In order to assess how good of a job New Jersey animal shelters are doing, I’ve developed an analysis I call the “Life Saving Model.” While shelter performance is dependent on many variables, such as finances, facility design, local laws, etc., the most critical factor impacting potential life saving is physical space. Without having enough physical space, a shelter might not have enough time to find loving homes for its animals. Shelters can overcome financial limitations through creative fundraising or recruiting more volunteers. Similarly, organizations can save their dogs despite having run down facilities if these groups enthusiastically implement policies to get animals into loving homes quickly. As a result, my analysis focuses on making the best use of space to save the maximum number of New Jersey and nearby states dogs.

The Life Saving Model measures the number of local animals a shelter should adopt out, rescue from other facilities, send to rescues or other shelters, and euthanize. The targeted outcomes take into account each facility’s physical capacity and the number and types of dogs the organization receives from its community (i.e. strays, owner surrenders, cruelty/bite cases). I assume a target euthanasia rate, take the number of dogs actually returned to owners and then estimate how many community dogs a shelter should adopt out. To the extent space runs out, I then calculate how many dogs the shelter must send to rescues. If the shelter has excess space after properly serving its local community, the facility uses that room to rescue and adopt out dogs from nearby areas. The targeted results calculated from this model are compared to the actual or estimated actual results from each shelter below.

For shelters with animal control contracts, I place 10% of all dogs that are not reclaimed by owners into the targeted sent to rescue category. Austin Pets Alive used data from Austin Animal Center, which is the local municipal shelter, to determine large dogs with behavioral challenges are part of the last 10% of animals losing their lives. While shelters can save most of these dogs through behavioral rehabilitation and/or foster programs, I decided to put an estimate of these dogs into the sent to rescue category since that is another good outcome for these dogs.

My analysis puts a cap on the targeted numbers of dogs rescued from other shelters and adoptions. While my unmodified targeted numbers of rescued and adopted animals are quite achievable, I want to provide very conservative goals for New Jersey animals shelters. For example, the unmodified model resulted in a statewide per capita dog adoption rate of around 30% to 70% of the level found at some of the nation’s best animal control shelters. Similarly, the unmodified model yielded a statewide pit bull per capita adoption rate (2.0 pit bulls per 1,000 people) that is less than the pit bull per capita adoption rate at one of the best animal control shelters in the country. In my opinion, New Jersey shelters could more easily achieve that per capita pit bull adoption rate given my model includes far fewer dogs from competing breeds than those in this role model animal control shelter.

My modified analysis capped pit bull adoptions at 2 pit bulls per 1,000 people within each New Jersey county. In other words, the targeted numbers of dogs rescued from other shelters and adopted below are the lesser of

  1. Number predicted by model
  2. Number determined by capping pit bull adoptions at 2 pit bulls per 1,000 people in the county

In simple terms, a shelter is expected to achieve this per capita adoption rate unless the facility lacks enough space. If a shelter does not have sufficient room, it won’t have the time to reach all the potential adopters and requires assistance from rescues and/or other facilities. Given my model assumes 80% of rescued dogs are pit bull like dogs, my targeted numbers of dogs rescued and adopted are quite low as detailed in the section below. For example, shelters in counties where dog adoptions are capped have extra space that they do not use to adopt out other dog breeds.

To read specific details and assumptions used in the model, please see the Appendix at the end of this blog.

New Jersey Animal Shelters Contain Enough Space to Save All of New Jersey’s Dogs and Many More from Other States

New Jersey’s animal shelter system has enough space to save all of the state’s healthy and treatable dogs. The table below details the targeted numbers of dog outcomes the New Jersey animal shelter system should achieve. Out of the 22,391 New Jersey dogs coming into the state’s animal shelters in 2017, 10,928 and 1,590 dogs should have been adopted out and sent to other shelters/rescues by the facilities originally taking the dogs in. However, other New Jersey animal shelters had more than enough capacity to rescue the 1,590 dogs from space constrained facilities. Thus, New Jersey animal shelters should be able to able to adopt out every single healthy and treatable dog taken in from the state and not require any support from rescue organizations without physical facilities from a space perspective.

New Jersey animal shelters have enough excess space to save many dogs from out of state as well. Specifically, New Jersey animal shelters had enough physical capacity to rescue and adopt out 10,070 dogs from out of state after achieving a 95% live release rate for New Jersey dogs. To put this number into perspective, New Jersey animal shelters could make both New York City and Philadelphia no kill cities for dogs and increase those cities’ dog live release rates to 95% in 2017 as follows:

  • New York City – 1,304 additional dogs need saving
  • Philadelphia – 935 additional dogs need saving

Additionally, New Jersey animal shelters could save another 7,831 dogs from other locations outside of the state. Of course, some New Jersey animal shelters do pull some dogs from New York City and Philadelphia animal control shelters. However, most of these dogs are likely easy to adopt and therefore have short lengths of stay. As a result, the additional number of dogs New Jersey animal shelters could save from New York City, Philadelphia and elsewhere is probably not much lower than the figures above. Thus, New Jersey animal shelters could make New Jersey a no kill state for dogs as well as many other places.

These adoption goals are quite achievable when comparing the performance of well-run animal control shelters across the country. New Jersey animal shelters would only need to adopt out 2.5 dogs per 1,000 people in the state (1.4 dogs if no dogs rescued from out of state). As a comparison, recent per capita dog adoption numbers from several high performing no kill open admission shelters are as follows:

  • Lynchburg Humane Society (Lynchburg, Virginia) – 10.7 dogs per 1,000 people
  • Longmont Humane Society (Longmont, Colorado area) – 10.5 dogs per 1,000 people
  • Nevada Humane Society (Reno, Nevada and Carson City, Nevada areas) – 8.5 dogs per 1,000 people
  • KC Pet Project (Kansas City, Missouri) – 6.5 dogs per 1,000 people
  • Humane Society of Fremont County (Fremont County, Colorado) – 5.8 dogs per 1,000 people
  • Williamson County Animal Shelter (Williamson County, Texas) – 5.5 dogs per 1,000 people
  • Lake County Animal Shelter (Lake County, Florida) – 4.6 dogs per 1,000 people

Thus, many communities are already adopting out around two to four times as many dogs as the goal set for New Jersey animal shelters.

Some naysayers may claim New Jersey would have a more difficult time due to the state’s shelters taking in many pit bulls. However, this is a myth. My model estimates New Jersey animal shelters would need to adopt out roughly 0.5 pit bulls per 1,000 people to save 95% of New Jersey’s dogs. Our shelters would only need to adopt out around 1.4 pit bulls per 1,000 people if New Jersey shelters also rescued and adopted out the targeted number of pit bulls from other states. As a comparison, I estimate Longmont Humane Society adopts out 2.2 pit bulls per 1,000 people based on the number of pit bulls impounded in 2014 as a percentage of total dogs impounded in 2014 and multiplying that number by the 10.5 dogs per 1,000 people adoption rate in 2017. Furthermore, the pit bull adoption targets are even more reasonable given the model assumes there are roughly 1/8 of the number of dogs from other breeds to compete with in the New Jersey adoption market compared to the Longmont, Colorado area.

2017 New Jersey Dog Targeted Outcomes

Animal Deaths Vary Widely at New Jersey Animal Shelters

The goal of any properly managed animal shelter is to save all of its healthy and treatable animals. In some cases, such as selective admission rescue oriented shelters, it is pretty easy to not kill animals. In addition, other animal shelters with easy to service animal control contracts (i.e. few animals impounded, most strays quickly returned to owners) can avoid unnecessary killing due to having lots of extra space. As a result, some shelters may have an easier time than others in preventing killing at their shelters.

The tables below detail the estimated dog death rates. All dogs missing are assumed “dead” based on the assumption they died or went to a very bad place. As discussed in a prior blog, the estimated death rate includes “Other” outcomes as animals who died or went missing along with dogs reported as killed. Based on my review of a number of shelters’ underlying documents, virtually all of the dogs in the “Other” outcome category died or went missing. Shelters having estimated dog death rates equal to or less than and greater than 5% are highlighted in green and red in the table below.

The Humane Society of Atlantic County and St. Hubert’s-Noah’s Ark had unusually high estimated dog death rates of 11% and 8% (St. Hubert’s estimated death rates reflect an adjustment for the organization’s Sister Shelter Waystation program discussed in this blog). These facilities’ estimated death rates are very high for rescue oriented shelters with no animal control contracts and raise serious questions about how life and death decisions are made by these organizations. The estimated death rates at other rescue oriented shelters, such as Ramapo-Bergen Animal Refuge and Animal Welfare Association (both had estimated dog death rates of 1%) are much lower than the Humane Society of Atlantic County and St. Hubert’s-Noah’s Ark. Thus, the Humane Society of Atlantic County’s and St. Hubert’s-Noah’s Ark’s estimated dog deaths rate are extremely high for rescue oriented shelters.

Certain shelters may kill a larger percentage of local animals. Since a number of both rescue oriented and shelters with animal control contracts transport large numbers of highly adoptable dogs from out of state, its helpful to look at their estimated death rates for just local animals. Unfortunately, shelters do not provide data to precisely compute this local dog death rate. If we assume these shelters only killed the generally less adoptable local dogs, we can estimate the local dog death rate as follows:

Total Dogs Killed and in Other Outcomes (died, missing)/(Total Dogs Impounded-Total Dogs Transported In from Other States)

When we calculate this estimated local death rate, a number of shelters stand out. The Humane Society of Atlantic County’s estimated dog death rate rises from 11% to 21% under this calculation. Additionally, St. Hubert’s-Madison’s estimated dog death rate increases from 10% to 48% under this calculation. While these facilities may not be only killing local dogs and therefore may have lower local dog death rates, I think its very possible these shelters’ local dog death rates are significantly higher than their total estimated dog death rates in the tables below.

The largest number of dogs unnecessarily dying occurred at a relatively small number of shelters. Specifically, 12 out of 93 or 13% of the shelters accounted for 80% of the estimated 1,507 dogs unnecessarily losing their lives under the model’s assumptions. In fact, Associated Humane Societies-Newark, which broke state shelter law left and right in 2017 per New Jersey Department of Health inspection reports, and Trenton Animal Shelter, which also violated state shelter law last year per a state health department inspection report, accounted for 31% of the dogs needlessly losing their lives at New Jersey animal shelters. Shelters with the greatest number of unnecessary dog deaths (assuming all dogs killed were local animals) are as follows:

  • Associated Humane Societies – Newark (338)
  • St. Hubert’s – Madison (138)
  • Trenton Animal Shelter (134)
  • Gloucester County Animal Shelter (128)
  • Camden County Animal Shelter (83)
  • Hamilton Township Animal Shelter (76)
  • Associated Humane Societies – Tinton Falls (66)

Thus, the bulk of the dogs unnecessarily dying at New Jersey animals shelters occurs at a small number of facilities.

2017 NJ Shelters Estimated Dog Death Rates 1.jpg

2017 NJ Shelters Estimated Dog Death Rates 2

2017 NJ Shelters Estimated Dog Death Rates 3.jpg

2017 NJ Shelters Estimated Dog Death Rates 4.jpg

2017 NJ Shelters Estimated Dog Death Rates 5.jpg

Most New Jersey Animal Shelters Require Little Rescue Assistance

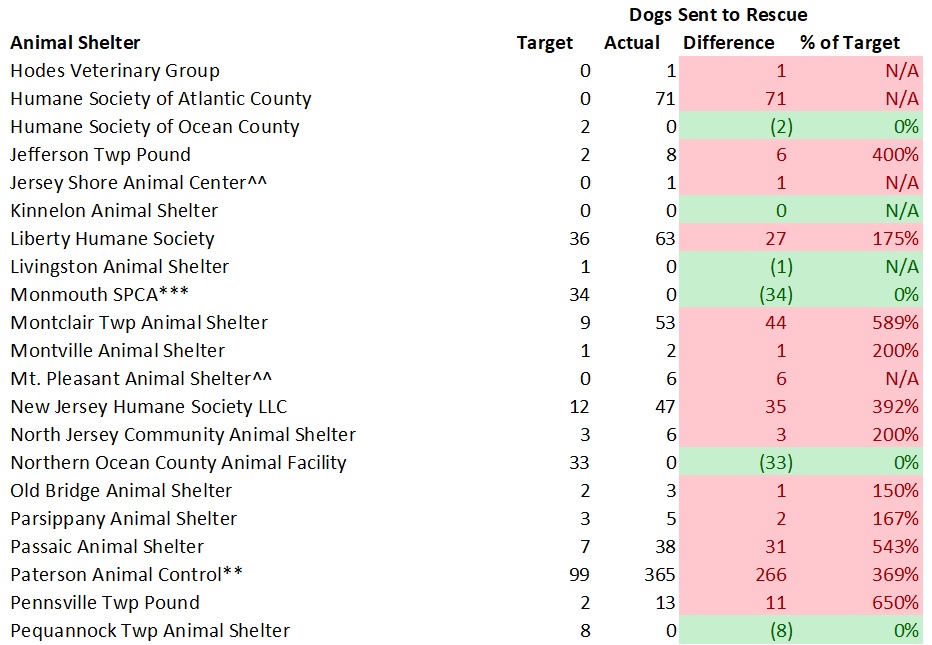
Some animal shelters will require more support from rescues and animal shelters with excess space than others. If a shelter has relatively high intake, very limited space, and few stray dogs returned to owners, it will need more help than other shelters. In an ideal world, rescues would take all shelter animals. However, due to limited numbers of foster homes, lesser ability to find foster homes due to many rescue organizations’ small sizes, and most rescues’ restrictive adoption policies, all shelters cannot heavily rely on rescues. The tables below compare the number of dogs a shelter should transfer to other organizations per the model and the number of dogs actually sent to other animal welfare groups. Shelters marked in green are receiving less than the expected rescue support while facilities marked in red are receiving too much rescue help.

Overall, most New Jersey animal shelters require little rescue support if space-constrained facilities fast-track their most highly adoptable dogs. Shelter medicine experts advocate prioritizing the processing of highly adoptable animals to make the best use of space and reduce disease. For example, making sure these animals are the first to get spayed/neutered and vaccinated and receive microchips to ensure they can leave as soon as the shelter finds a good home.

54 shelters received too much help, 17 facilities received just enough assistance and 22 shelters received too little help from other animal welfare organizations. However, the excess dogs rescued (1,743 dogs) at shelters receiving too much assistance was far higher than the rescue deficits at other shelters (232 dogs) resulting in the state’s shelters sending 1,511 more dogs than needed to rescues and other animal welfare organizations. Northern Ocean Animal Facility and Southern Ocean Animal Facility received less rescue support than needed. However, neither of the shelters reported rescues taking any animals, which raises questions as to whether these shelters correctly reported their data (i.e. counting animals sent to rescues as adoptions). Nonetheless, the New Jersey shelter system as a whole is receiving enough rescue assistance, but some shelters are hurt by rescues pulling animals from less needy facilities.

Rescue groups and shelters with extra space should pull dogs from kill shelters with the highest rescue “target” numbers and deficits in the tables below. If shelters not needing rescue support get that extra help, these shelters will not take the steps necessary to properly run their facilities. As a result of enabling poorly performing shelters and not pulling dogs from truly space constrained facilities, rescuing dogs from shelters with enough space leads to less lifesaving.

Shelters receiving less than needed rescue support should also examine their own policies and performance. Are the shelter’s operating processes allowing too many animals to get sick and therefore discouraging organizations to rescue their animals due to subsequent medical costs? Does the shelter actively reach out to rescues/other shelters and treat them with respect? Does the shelter make it convenient for other organizations to pull their animals?

Given killing animals for space is intolerable, the space-constrained shelters need to expand their effective dog capacity. These facilities could use extra space in their buildings to house dogs on a short-term basis. These shelters can enter into arrangements with local veterinarians to house and adopt out some dogs. Furthermore, shelters can create or expand foster programs to increase the number of dogs cared for. Additionally, creating a pet owner surrender prevention program, implementing a proper managed intake policy (i.e. where animals are impounded when in danger and waiting periods for owner surrenders are relatively short) and making serious efforts to return lost dogs to owners could free up space in these shelters. Finally, space-constrained shelters with multiple animal control contracts should terminate some of these arrangements to bring their capacity for care in line with the number of dogs they take in. As a result, space constrained shelters still need to take active steps to reduce killing rather than simply solely relying on rescue support.

In certain circumstances, it may make sense for shelters with excess space to send dogs to rescues. For example, a unique breed or a dog needing very specialized behavioral or medical rehabilitation. However, these cases are accounted for in my targeted sent to rescue figures for animal control shelters.

2017 NJ Shelters Targeted Verses Actual Dogs Sent to Rescues 1.jpg

2017 NJ Shelters Targeted Verses Actual Dogs Sent to Rescues 2.jpg

2017 NJ Shelters Targeted Verses Actual Dogs Sent to Rescues 3

2017 NJ Shelters Targeted Verses Actual Dogs Sent to Rescues 4

2017 NJ Shelters Targeted Verses Actual Dogs Sent to Rescues 5

Most New Jersey Animal Shelters Fail to Come Close to Reaching Their Local Dog Adoption Potential

We can assess each shelter’s contribution to making New Jersey and nearby areas no kill. While a shelter may be able to avoid killing healthy and treatable animals, it still may not live up to its potential for adopting out local dogs. On the other hand, a space constrained shelter may kill healthy and treatable dogs, but still do a good job adopting animals out.

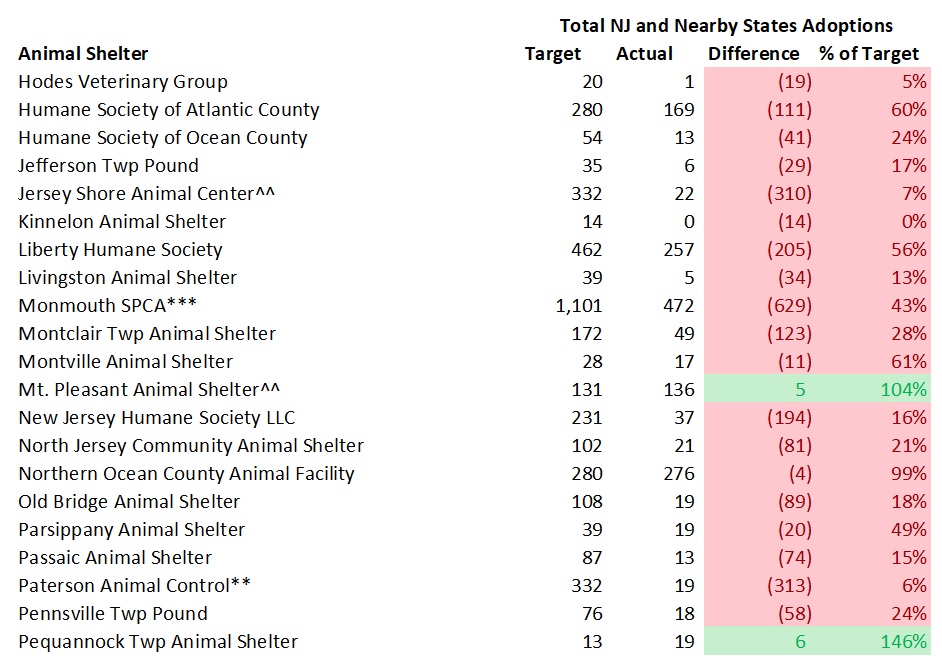
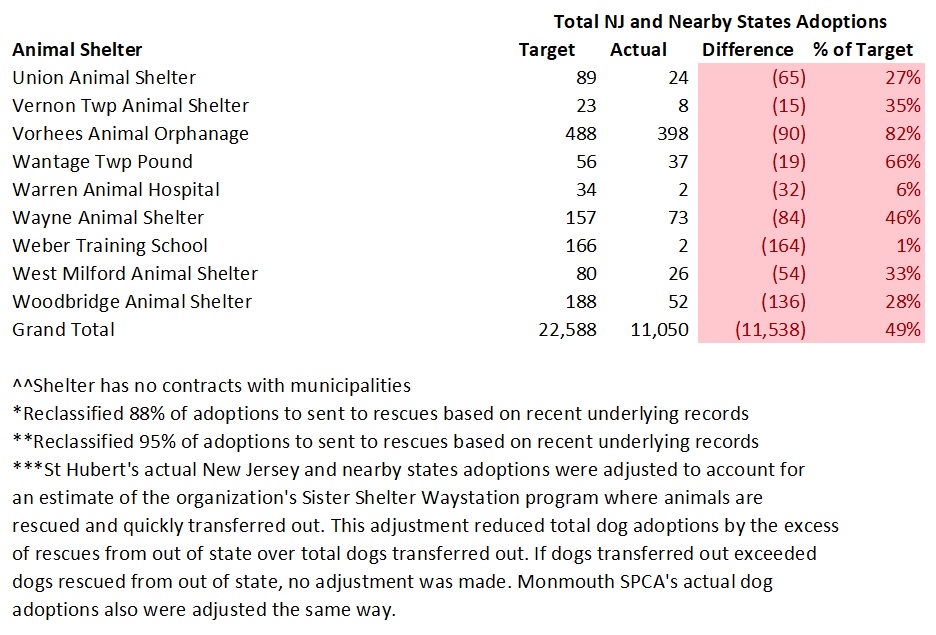
The tables below compare the number of dogs from New Jersey and nearby states each animal shelter should adopt out with the estimated number of local dogs actually adopted out.

Many rescue oriented shelters likely pull much easier to adopt dogs than the bulk of dogs needing to get rescued from local facilities. Thus, the results from rescue oriented shelters may look better than they actually are.

Few organizations reached or exceeded their adoption targets. Specifically, only 10 out of 93 shelters met the adoptions goals computed by the Life Saving Model. Thus, the overwhelming number of New Jersey animal shelters need to step up their adoption efforts.

A number of other rescue oriented shelters exceeded their adoption targets, but this may at least partially be due to the types of dogs they impounded.  Common Sense for Animals operates more like a rescue oriented than an animal control shelter. While this organization exceeded its adoption targets, the shelter’s figures were off by 128 dogs using the methodology outlined in another blog. This makes me wonder if their adoption numbers were accurate. Somerset Regional Animal Shelter, which also operates more like a rescue oriented shelter than an animal control facility, exceeded its adoption target. However, this shelter appears to mostly rescue easier to adopt dogs from New Jersey animal shelters. Other rescue oriented shelters, such as Mt. Pleasant Animal Shelter and Animal Welfare Association also exceeded their adoption targets, but this is likely due to these organizations rescuing easier to adopt dogs from New Jersey shelters. Thus, I believe most of these rescue oriented shelters’ high local dog adoption numbers were due to these organizations selecting easier to adopt dogs.

Pequannock Animal Shelter’s higher than targeted local dog adoption result is a bit misleading. This facility benefited from the method I used to cap adoptions in the county and reduce the adoption targets for these two shelters. For example, the shelter only reached 61% of its adoption target using my unadjusted model only taking the shelter’s physical space into account. Since Morris County has many shelters that collectively have a very large capacity (i.e. very high adoption potential), my model reduces all Morris County animal shelters’ target adoptions to my county adoption cap. Therefore, Pequannock Animal Shelter has a relatively low dog adoption target. Thus, this shelter really didn’t do an excellent job adopting out dogs.

Three animal control shelters deserve mentioning. Camden County Animal Shelter exceeded its adoption target by 40 dogs. As a large county shelter that includes a poor urban area, this is an impressive result. Similarly, Burlington County Animal Shelter, which also takes in many dogs, exceeded its dog adoption target by 82 dogs. Ewing Animal Shelter, which is operated by EASEL Animal Rescue League, adopted out 19 more dogs than its adoption target. Unsurprisingly, all three shelters had dog live release rates exceeding 90% in 2017 (Camden County Animal Shelter: 92%, Burlington County Animal Shelter: 96%, EASEL Animal Rescue League: 98%) and all three facilities provide either condensed or full statistics on their web sites.

Shelters adopting out the fewest animals in total relative to their targets were as follows:

  • Associated Humane Societies-Newark – 1,412 fewer dogs adopted than targeted
  • Monmouth SPCA – 629 fewer dogs adopted than targeted
  • Associated Humane Societies-Popcorn Park – 593 fewer dogs adopted than targeted
  • Plainfield Area Humane Society – 486 fewer dogs adopted than targeted
  • Bergen County Animal Shelter – 458 fewer dogs adopted than targeted
  • Tyco Animal Control – Paramus – 388 fewer dogs adopted than targeted
  • Trenton Animal Shelter – 383 fewer dogs adopted than targeted
  • St. Hubert’s – Madison – 338 fewer dogs adopted than targeted
  • Shake a Paw-Union – 334 fewer dogs adopted than targeted
  • Paterson Animal Shelter – 313 fewer dogs adopted than targeted
  • Jersey Shore Animal Center – 310 fewer dogs adopted than targeted
  • Cumberland County SPCA – 302 fewer dogs adopted than targeted
  • Associated Humane Societies-Tinton Falls – 300 fewer dogs adopted than targeted

Unsurprisingly, Associated Humane Societies has archaic adoption policies that make it more difficult to adopt than the procedures recommended from national animal welfare organizations. Furthermore, Associated Humane Societies-Newark, Associated Humane Societies-Tinton Falls, Trenton Animal Shelter, Paterson Animal Shelter, Monmouth SPCA, Paterson Animal Shelter and Bergen County Animal Shelter had troublesome stories involving the shelters and/or prominent people affiliated with these organizations over the last several years. Shake a Paw-Union’s low local adoption numbers are not surprising since it also operates a for profit pet store and transports almost all of its dogs it rescues from out of state. Finally, Plainfield Area Humane Society’s local dog adoption deficit is quite disturbing since this organization could easily take on Plainfield’s dogs who currently go to the horrific and high kill Associated Humane Societies-Newark.

2017 NJ Targeted Verses Actual NJ and Nearby States Dog Adoptions 1.jpg

2017 NJ Targeted Verses Actual NJ and Nearby States Dog Adoptions 2.jpg

2017 NJ Targeted Verses Actual NJ and Nearby States Dog Adoptions 3.jpg

2017 NJ Targeted Verses Actual NJ and Nearby States Dog Adoptions 4

2017 NJ Targeted Verses Actual NJ and Nearby States Dog Adoptions 5.jpg

Shelters Fail to Use Excess Space to Save Local Dogs

To further examine New Jersey animal shelters’ performance in saving the state’s homeless dogs, I compared the targeted number of dogs each shelter should pull from nearby shelters and compared it to the number actually rescued from local facilities. I assume all reported out of state rescued dogs came from southern or other far away states (except for Animal Alliance due to the shelter stating it primarily pulls out of state dogs from Pennsylvania). While some of the out of state rescued dogs may have comes from nearby areas, I believe this is a small number and does not significantly impact the results.

Virtually all New Jersey animal shelters are failing to rescue the number of local dogs they should. 90 of the 93 shelters should rescue some dogs from other local shelters. In fact, 41 of the 90 shelters with targeted excess capacity failed to rescue even a single dog from a New Jersey animal shelter. Of the 90 shelters that should have rescued dogs, the following shelters were the only facilities that met or exceeded their local dog rescue targets:

  1. Animal Adoption Center – 179 more dogs rescued than targeted
  2. Animal Welfare Association – 77 more dogs rescued than targeted
  3. Burlington County Animal Shelter – 76 more dogs rescued than targeted
  4. Somerset Regional Animal Shelter – 73 more dogs rescued than targeted
  5. Humane Society of Atlantic County – 32 more dogs rescued than targeted
  6. Ewing Animal Shelter (EASEL) – 21 more dogs rescued than targeted
  7. Beacon Animal Rescue – 19 more dogs rescued than targeted
  8. Mt. Pleasant Animal Shelter – 12 more dogs rescued than targeted
  9. Harmony Animal Hospital – 10 more dogs rescued than targeted
  10. Gloucester County Animal Shelter – 5 more dogs rescued than targeted
  11. Trenton Animal Shelter – 4 more dogs rescued than targeted

As mentioned above, many of these shelters local rescue numbers are inflated due to these organizations cherry picking highly adoptable animals to rescue. Thus, nearly all New Jersey animal shelters with targeted excess capacity are failing to do their share in ending the killing of local healthy and treatable dogs.

Camden County Animal Shelter also deserves mentioning. This facility rescued 380 dogs from other New Jersey shelters last year. While this is an obviously good thing, this may have artificially decreased this shelter’s estimated local death rate by as much as 2% if it only pulled highly adoptable dogs.

Shelters can overcome challenges in rescuing dogs from outside their service area. In some cases, municipalities may frown on government run shelters using taxpayer funds to rescue dogs from elsewhere. However, shelter directors at these facilities can encourage individuals to form a non-profit or raise money on their own to pay for these rescued dogs. Additionally, shelters with limited capacity or even some of the well-off private shelters could contribute funding for each dog rescued. For example, Maddie’s Fund paid an approximate $160 subsidy to rescues pulling dogs from New York Animal Care & Control. Similarly, private shelters with excess space, but limited financial resources, could expand their fundraising efforts to save more local dogs. Thus, perceived obstacles to rescuing local dogs can and should be overcome.

2017 NJ Shelters Targeted Verses Actual Dogs Rescued from NJ Shelters 1

2017 NJ Shelters Targeted Verses Actual Dogs Rescued from NJ Shelters 2

2017 NJ Shelters Targeted Verses Actual Dogs Rescued from NJ Shelters 3.jpg

2017 NJ Shelters Targeted Verses Actual Dogs Rescued from NJ Shelters 4

2017 NJ Shelters Targeted Verses Actual Dogs Rescued from NJ Shelters 5

New Jersey Animal Shelters Need to Form Life-Saving Coalitions

The improper allocation of space within the state’s animal shelter system requires organizations to form coalitions. While putting a competent and compassionate director in every shelter would likely be even more effective, that will likely take time to do. No kill coalitions between animal control facilities and selective admission shelters have been used in places, such as Portland, Oregon, Reno, Nevada, Jacksonville, Florida and Austin, Texas to radically increase life saving. Maddie’s Fund, which has supported using coalitions for over a decade, has many resources for organizations seeking to collaborate with each other. Thus, New Jersey animal shelters need to formally work together, develop quantifiable and measurable goals (such as the targeted outcomes in this blog), and hold each organization accountable for meeting these benchmarks.

Sobering Results Require Shelter Leaders to Critically Examine Themselves

Shelters should examine the reasons why their adoption numbers fall far short of these benchmarks. In some cases, shelters need to expand the hours they are open for adoptions. Many shelters should switch from an overly judgmental adoption process based on black and white rules to a conversational one focused on educating the adopter. Organizations will need to radically increase their off-site events and do same day adoptions. Similarly, many shelters must reduce adoption fees and run frequent promotions. Executive Directors should monitor the latest life-saving programs on Maddie’s Fund’s, ASPCA Pro’s, American Pets Alive Conference’s, and the Best Friends National Conference’s web sites and put some of these policies into place. Shelter management teams will need to ensure their facilities are clean and customers are treated with respect (this can be measured by encouraging the public to complete surveys). Thus, poorly performing shelters need to stop making excuses and do what it takes to reach their adoption potential.

We can turn New Jersey, New York City and Philadelphia into no kill communities. It is time we give our money and volunteer efforts to organizations who raise their performance to help us reach that goal. To do otherwise, would betray all the animals whose lives are on the line.

Appendix – Life Saving Model Assumptions

The Life Saving Model utilizes the following basic animal shelter population equations to calculate the targeted dog outcomes for each facility:

Daily capacity or population = Daily animal intake x average length of stay

Average length of stay = Daily capacity or population/daily intake

Each shelter’s community dog intake (i.e. owner surrenders, strays, cruelty bite cases), number of dogs returned to owners, and maximum dog capacity were taken from its 2017 “Shelter/Pound Annual Report” submitted to the New Jersey Department of Health.

This data was then used as follows:

  • Community dog intake and dogs returned to owners were initially estimated for each month by dividing the annual figures by 12. In order to take into account the extra space in low intake months and reduced space in high intake months, we multiply that number by each month’s percentage of the average month. For example, assume 240 dogs were taken in during the year and the average month equals 20 dogs (240/12). In July, the dog intake is 120% higher than the average month and we therefore multiply 20 dogs by 1.2 to equal 24 dogs. If 120 dogs were returned to owners during the year, the estimated number of dogs returned to owners in July would equal 12 dogs (120/12 = 10; 10*1.2). The monthly intake percentages were based off the average of the 2017 dog intake data on New York Animal Care & Control’s and ACCT Philly’s web sites.
  • The estimated number of community dogs returned to owners each month are then assumed to stay 5 days on average at shelters based on data from other shelters across the country. If anything, this estimate is conservative (i.e. average length of stay for dogs returned to owners may be less than 5 days and therefore frees up more shelter space for adoptions) based on some shelters returning the bulk of their dogs to owners within 3 days.
  • The number of community dogs euthanized (including animals who died or are missing) is set to equal 5% of intake. 5% is a reasonable standard euthanasia rate for shelters in New Jersey to meet given few vulnerable stray puppies (i.e. who could die or require euthanasia) arrive in the state’s animal shelters. The average length of stay for euthanized dogs is assumed to equal 14.5 days. Half of dogs are assumed euthanized for untreatable aggression towards people and 21 days is the time estimated to make that determination. The other half of dogs are assumed euthanized for severe and untreatable health issues and I estimate these dogs are euthanized after 8 days (subsequent to the end of the stray hold and owner surrender protection periods).
  • Adopted dogs are assumed to stay at shelters for varying lengths of time. Adoption length of stay was based on data from a study in the Journal of Applied Animal Welfare and the figures used (except for space-constrained shelters) are located in a prior blog on pit bull adoption. The data primarily comes from Tompkins County SPCA during a time it saved over 90% of its dogs. This was a fairly conservative data set to use as other no kill open admission shelters’ average length of stay are substantially shorter. Specifically, the following assumptions were made:
    1. 80% and 20% of each communities dogs (including pit bulls) were adults 1 year and older and under 1 year.
    2. Pit bulls were assumed to comprise 50%, 35% and 25% of community dog intake at poor, middle/upper middle class, and wealthy area animal control shelters. While some shelters may have pit bulls comprising more than 50% of their shelter dog population at a given time, this is due to pit bulls longer average length of stay. For example, a shelter with pit bulls making up 50% of their dog intake and pit bulls having an average length of stay three times longer than other dogs will have pit bulls constituting 75% of the dog population. Shelters without animal control contracts were assumed to only have pit bulls make up 10% of their community dogs (i.e. strays and owner surrenders) based on most of these shelters’ highly selective admission practices.
    3. Pit bull adoption length of stay was taken directly from the Journal of Applied Animal Welfare study. The average adoption lengths of stay for other breeds from this study were averaged and used for dogs other than pit bulls in the analysis
  • Space constrained shelters were assumed to adopt out their easiest to adopt animals first until they ran out of space. To estimate the average adoption length of stay, I used pit bull adoption length of stay data from Greenhill Humane Society from March 2013 through May 2015. I broke the adoption length of stay data into 5 groups that each made up 20% of the data. The average adoption length of stay for each of these 5 groups was calculated. The average adoption length of stay of each group was divided by the average length of stay for all of the adopted pit bulls in the Greenhill Humane Society data set. Those percentages were then multiplied by the average dog adoption length of stay determined in the previous bullet and used to determine the adoption lengths of stay used for space-constrained shelters.
  • Dogs transferred to rescue or other facilities are assumed to stay at shelters 8 days on average based on the assumption strays can’t be released until the 7 day hold period elapses.
  • Community dogs not returned to owners or euthanized are initially assumed as adopted for each month. However, if the calculated length of stay exceeds the shelter’s required length of stay, dogs are moved from adoption (i.e. longer length of stay) to rescue (i.e. shorter length of stay) until the calculated length of stay each month approximately equals the required length of stay.
  • Animal control shelters have a minimum of 10% of unclaimed dogs go to rescues. To the extent shelters transfer 10% of unclaimed dogs to rescues despite having space (i.e. reclassifying dogs from adoptions with a longer length of stay to rescues with a shorter length of stay), I do not require these facilities to use that space to rescue additional dogs.
  • Required length of stay = Shelter’s reported capacity/adjusted daily intake for the month. Adjusted daily intake for month = Adjusted monthly intake per first bullet above/the number of days in the month.
  • Shelters with excess capacity are assumed to use the extra space to rescue and adopt out dogs from other New Jersey animal shelters. To the extent all healthy and treatable New Jersey animal shelter dogs are saved, I assume additional dogs are pulled from nearby states with similar types of dogs. I assume all rescued dogs will not be killed since the transferring and receiving shelters should evaluate these dogs’ behavior. Based on pit bull type dogs having longer lengths of stay at shelters, I assume 80% of dogs rescued from local animal shelters are pit bulls and 20% are non-pit bulls. 80% and 20% of pit bull and non-pit bull type dogs are considered 1 year and older and under 1 year. The average length of stay for rescued pit bulls and other dogs are the same as the adoption length of stay figures above.
  • Each month’s targeted outcomes are added to determine how many local dogs New Jersey animal shelters should adopt out, send to rescue, rescue from other nearby animal shelters and euthanize.
  • The targeted number of dogs rescued and adopted were capped at 2 pit bulls per 1,000 people in each county. If the model yielded a higher result than this cap, the targeted numbers of dogs adopted were set to equal to this cap using the pit bull percentage assumptions above. For shelters in these counties (except Passaic County), I calculated the cap at the county level and then reduced the number of cats adopted for the county to equal the cap. I excluded West Milford from Passaic County due the town’s large distance from the population centers in the rest of the county. Each shelter’s percentage of total targeted adoptions in the county from the unmodified model were applied to the the total reduction in the number of adoptions in the county to yield the targeted numbers of dogs adopted in the modified model. If the shelter also rescued animals from other shelters, the rescued numbers were also reduced since I assume rescued animals are adopted.

New Jersey’s Highest Kill Shelters in 2017

Last month, I wrote a blog discussing decreased killing at New Jersey animal shelters in 2017. This blog will explore the 2017 statistics in more detail and assess the current status of the state’s animal shelters.

Most New Jersey animal shelters voluntarily report detailed data to state authorities. Last month, I shared the 2017 summary statistics for New Jersey animal shelters on my Facebook page. Each year, the New Jersey Department of Health requests each licensed animal shelter in the state to submit animal shelter data for the previous year. Animal shelters voluntarily submit this data in the “Shelter/Pound Annual Report.” The New Jersey Department of Health takes these Shelter/Pound Annual Reports and compiles the number of dogs, cats and other animals impounded, redeemed, adopted and euthanized to prepare its Animal Intake and Disposition report. However, the Shelter/Pound Annual Reports include additional information on how animals were impounded (i.e. strays, owner surrenders, rescued from in-state facilities, rescued from out of state shelters, and cruelty/bite cases/other) and disposed of (i.e. returned to owner, adopted, sent to rescue/another shelter, and died/missing/other outcome). Additionally, the Shelter/Pound Annual Reports include the number of animals in shelters at the beginning and end of the year as well as the maximum number of animals facilities can hold. Thus, the Shelter/Pound Annual Reports include very important data not found in the New Jersey Department of Health’s summary report.

I compiled the data from these reports and analyze the results in this blog. 2017 statistics for each New Jersey animal shelter are listed at this link. You can also view each “Shelter/Pound Annual Report” at this link.

Garbage Data Raises Serious Questions About New Jersey Animal Shelters’ Statistics

Most New Jersey animal shelters do not properly account for their animals. Simple math dictates the number of animals at a facility at the beginning of the year, plus all animals coming in during the year, less all animals leaving for the period, should equal the number of animals a shelter has at the end of the year. Stunningly, 59 out of 93 shelters reporting these dog statistics and 60 out of 91 facilities submitting this cat data failed to get this right. This raises serious questions about the accuracy of these shelters’ reported statistics. 39 of the 59 shelters with flawed dog statistics and 38 of the 60 facilities with incorrect cat statistics should have had more animals at the end of the year than reported. While these errors could have been due to incorrect counts of the number of animals at facilities, these shelters may have not recorded outcomes, such as animals who were killed, died, or went missing. To put it another way, 2,245 cats and dogs should have had outcomes reported and did not. Thus, there is the potential that as many as 2,245 additional dogs and cats were killed, died or went missing from New Jersey animal shelters than were reported in 2017.

Even worse, a number of animal shelters reported having a different number of animals at the end of 2016 and at the beginning of 2017. Obviously, shelters should report the same number of animals at the end of the prior year and the start of the current year. However, 34 of 93 shelters reported different numbers of dogs at the end of 2016 and the beginning of 2017. Similarly, 43 of 91 shelters reported different numbers of cats at the end of 2016 and the beginning of 2017. The worst offenders are listed in the tables below:

2017 New Jersey Animal Shelters Beginning Missing Dogs.jpg

2017 New Jersey Animal Shelters Beginning Missing Cats

Shelters may have failed to classify animals adopted out and sent to rescues properly. Both Paterson Animal Control and Elizabeth Animal Shelter reported no animals were sent to rescues and all dogs and cats leaving their facilities alive were owner reclaims or adoptions. However, intake and disposition records I reviewed at both of these shelters in recent years revealed almost all “adopted” animals are actually rescued. One has to wonder how many other facilities failed to properly classify adoptions and rescues properly. This data is very important as it provides details on the burden rescues and other shelters are taking on from these facilities.

We need better oversight of New Jersey animal shelters’ data reporting. Currently, these statistics are voluntarily reported and most shelters are not taking this seriously. For example, I noticed a large number of reports were submitted many months after the end of the year. This data should be easy to compile since facilities can utilize animal shelter software programs, some of which are free, to do this task. Furthermore, New Jersey animal shelter laws mandate facilities maintain much of the raw data found in the Shelter/Pound Annual Report. Unfortunately, New Jersey Department of Health inspections routinely find shelters do not properly keep records on animals. We need to make the data reporting mandatory for animal shelters as the shelter reform bill, S725, does along with serious penalties for significant errors (especially if deliberate). In order for animal shelters to take data reporting seriously, we may also need to require audits of these reports. Thus, these results show we need stronger laws and the New Jersey Department of Health to play a greater role in ensuring reported animal shelter statistics are in fact accurate.

Despite the errors in these reports, the data provided still reveals important information.

More Animals Losing Their Lives in New Jersey Animal Shelters Than Disclosed in Summary Report

The more detailed data in the Shelter/Pound Annual Reports allows one to more critically examine the percentage of locally impounded animals dying in New Jersey’s animal shelters. The following table summarizes my analysis of the kill rate calculated from the New Jersey Department of Health’s summary report and the data reported in the Shelter/Pound Annual Reports.

2017 New Jersey Detailed Dog and Cat Kill Rates

This year I revised the dog statistics to remove an estimate of the dogs St. Hubert’s transfers in and quickly transfers out through its Sister Shelter WayStation program. Since St. Hubert’s is effectively acting as a middle man and not holding these animals very long, it makes sense to exclude these dogs from the various kill rate statistics below. If I did not exclude these animals, I would understate the dog kill rate due to inflated intake and outcomes numbers. Therefore, I removed all of St. Hubert’s dogs transferred out from the intake and outcomes figures to calculate the kill rates above except the “Kill Rate Per State Report (Intake).” This adjustment increased the dog kill rate (intake) from 6.6% to 7.3%. While St. Hubert’s also transfers in and transfers out cats through the Sister Shelter WayStation program, the numbers did not have a material impact on the statewide kill rates. As a result, I did not revise the cat statistics.

The Animal Intake and Disposition report prepared by the New Jersey Department of Health only allows one to calculate the number of animals killed as a percentage of total animals impounded or intake. I prefer calculating the kill rate as a percentage of outcomes rather than intake as this metric directly compares positive and negative outcomes. Using intake may depress the kill rate since shelters can simply hold animals for a long time to the point of overcrowding. Calculating the kill rate based on outcomes rather than intake caused the cat kill rate to increase from 18.4% to 18.8% while the dog kill rate remained at 7.3%.

To calculate the statewide kill rate, we must also back out transfers from one New Jersey animal shelter to another state facility to avoid counting animals still in the state’s shelter system or registering two outcomes for the same animal (i.e. one New Jersey animal shelter transfers a dog or cat to another state facility which then adopts out the animal). This adjustment increases the dog kill rate from 7.3% to 8.0% and the cat kill rate from 18.8% to 20.5%.

In addition, we should increase the kill rate for animals who died or went missing in shelters. In the past, I’ve labeled this metric the death rate as these animals are likely dead or in a very bad situation. Unfortunately, the Shelter/Pound Annual Report includes animals who died or went missing in the “Other” outcome category. The “Other” category contains positive live releases, such as TNR for cats, at a few shelters. While including the “Other” category in the death rate for most shelters is appropriate (i.e. those facilities that don’t do TNR or don’t include cats released through TNR programs in “Other” outcomes), I’m no longer doing this due to an increasing number of shelters implementing TNR. Instead, I calculated the kill rate by subtracting out “Other” outcomes from total outcomes. If a shelter specifies the number of animals included in “Other” that left the shelter alive, I count this as “Other Live Release” and do not back these amounts out of total outcomes. After making this adjustment, the dog kill rate increases from 8.0% to 8.1% and the cat kill rate rises from 20.5% to 21.9%. For those interested in seeing the estimated death rates, you can find them in the supporting spreadsheet.

Also, many shelters transport easy to adopt animals from out of state which artificially increases live release rates. To properly calculate the percentage of New Jersey animals losing their lives, we need to adjust for transports. Unfortunately, shelters don’t break out their save rates by local and out of state animals. However, most likely nearly all of the out of state animals (primarily puppies and easy to adopt dogs) make it out of shelters alive. Therefore, I back out the number of out of state transports from total outcomes to estimate the local kill rate. This adjustment increases the New Jersey dog kill rate from 8.1% to 10.5% and the state’s cat kill rate from 21.9% to 22.2%.

Also, I estimate a maximum local kill rate by including the number of unaccounted for animals described in the section above. Making this adjustment increases the maximum potential New Jersey dog kill rate from 10.5% to 14.2% and the maximum potential state cat kill rate from 22.2% to 24.7%.

Some animal shelters quickly return large percentages of their animals to owners. At these shelters, the populations served are typically well-off and animals are licensed and have microchips. To account for the animals facilities actually have to shelter, I calculated a kill rate for non-reclaimed animals and a maximum potential kill rate for non-reclaimed local animals. The non-reclaimed kill rate and maximum potential kill rate for dogs is 11.6% and 23.5%. Non-reclaimed cats had a 22.8% kill rate and a 25.8% maximum potential kill rate. Thus, the percentage of New Jersey animals losing their lives in our state’s animal shelters may be much higher than the state summary report suggests.

Kill Rates Extremely High at a Number of New Jersey Animal Shelters

Dogs and cats are likely to lose their lives at a number of New Jersey animal shelters. Shelters with the highest kill rates for dogs and cats (excluding very low intake facilities) are listed in the following tables:

2017 Dog Kill Rate

2017 Cat Kill Rate NJ.jpg

Thus, both dogs and cats have a very good chance of leaving many New Jersey animal shelters dead rather than alive.

In terms of raw numbers, the following shelters killed the most animals:

2017 Shelters with Most Dogs Killed

2017 Shelters with Most Cats Killed

Many shelters fail to account for large numbers of their animals. As discussed above, a shelter’s number of animals at the end of the year should be calculated as follows:

Beginning number of animals + animals impounded – animals leaving the shelter

Unfortunately, a large number of shelters take in far more animals than they can explain where they went. Shelters having the highest numbers of unaccounted for dogs and cats are listed in the following tables:

2017 Shelters Most Unaccounted for Dogs.jpg

2017 Shelters Most Unaccounted for Cats

Dog and cat kill rates at many shelters may be even higher if these unaccounted for animals are counted as killed. If we only consider animal shelters which reported transporting few or no animals in 2017, facilities with the highest dog and cat kill rates considering the unaccounted for animals described above are as follows:

2017 Shelters Maximum Potential Dog Kill Rate.jpg

2017 Shelters Maximum Potential Cat Kill Rate.jpg

Thus, the plight of dogs and cats may be far worse in New Jersey animal shelters when we consider the unaccounted for animals.

Shelters Turn Their Backs on New Jersey’s Animals

New Jersey animal shelters rescue far more dogs from out of state than from other New Jersey animal shelters. Specifically, New Jersey animal shelters transferred in 9,918 dogs from out of state animal shelters and only rescued 2,950 dogs from other New Jersey animal shelters. However, St. Hubert’s frequently transfers a substantial number of its transports quickly to its partners in New Jersey and other states. If I back out St. Hubert’s transfers of dogs to out of state organizations, the number of transports decreases from 9,918 dogs to 8,326 dogs. As a comparison, the total and adjusted transports in 2016 were 7,948 dogs and 7,033 dogs. While the state’s local kill rate decreased in 2017, it is likely the local kill rate would have decreased by more if not for the massive number of out of state transports.

While perhaps some shelters, such as Animal Alliance in Lambertville, take animals from nearby New York or Pennsylvania animal control shelters, the overwhelming majority of these dogs most certainly came from down south. In fact, New Jersey animal shelters transported more dogs from out of state than dogs who were killed in New Jersey animal shelters. This number does not include additional out of state dogs transported into New Jersey by rescues operating without a physical facility. Shelters transporting the most dogs from out of state were as follows:

2017 Dogs Transported into NJ

Shelters Do Far Worse with Animals Requiring New Homes

Since dogs reclaimed by their owners typically have licenses and/or microchips and quickly leave the shelter, its informative to look at dogs shelters have to find new homes for. To get a better idea of how organizations are doing with animals they actually have to shelter, I also examined what percentage of non-reclaimed dogs lose their lives at each facility. Shelters with the highest non-reclaimed dogs kill rates are as follows:

2017 Nonreclaimed Dog Kill Rate.jpg

Shelters with the highest maximum non-reclaimed dogs kill rates are as follows (excluding facilities that reported transporting many dogs in and taking very few animals in):

2017 Maximum Potential Nonreclaimed Dog Kill Rate

Shelters Leave Animal Enclosures Empty While Dogs and Cats Die

New Jersey animal shelters fail to use their space to save animals. Based on the average number of animals at all of New Jersey’s animal shelters at the beginning and the end of 2017, only 56% of dog and 71% of cat capacity was used. Given December is a low intake month, I also increased these populations to an average intake month. This adjustment only raised the dog capacity utilization to 62%. While this adjustment did increase the cat capacity utilization to 97%, it is highly unlikely this happened in reality. Shelter inspection reports I’ve reviewed often did not reveal significantly larger dog and cat populations in the summer and winter months. This is likely due to the influx of highly adoptable kittens having short lengths of stay and shelters killing cats with empty cages.

Many animal shelters with low kill rates failed to rescue animals with their excess space. Additionally, other shelters used little of their available space and still killed a large percentage of their animals. Some examples after increasing the population (and therefore capacity utilization) based on the adjustment discussed above are as follows:

Space Usage Dogs

Space Usage Cats

Thus, many New Jersey animal shelters are killing dogs and cats despite having ample space to house these animals.

New Jersey’s animal shelters continue to fail the state’s animals. The state’s animal shelters only impound 9.2 dogs and cats per 1,000 New Jersey residents. If we just count animals originating from New Jersey, the state’s animal shelters only impound 7.3 dogs and cats per 1,000 people. As a comparison, the average community in the country impounds anywhere from 14-30 animals per 1,000 residents based on estimates from Animal People Newspaper and the Humane Society of the United States. Despite New Jersey shelters impounding a fraction of the animals other no kill communities take in on a per capita basis, the state’s animal control facilities continue to kill and allow animals to die under their care. Even worse, many of these shelters can’t even properly keep track of how many animals leave their facilities dead or alive. Our state’s animals deserve far better treatment than this. Contact your local city council members and mayor and demand better from the animal shelter serving your community. We can do so much better and it is time our shelters operate this way.
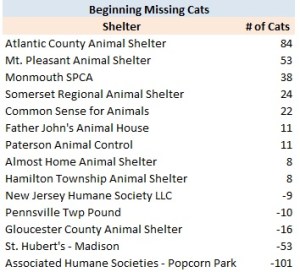
2015 New Jersey Animal Shelter Statistics Reveal Big Problems Still Exist

Earlier this month, I wrote a blog detailing decreased killing at New Jersey animal shelters in 2015. This blog will explore the 2015 statistics in more detail and assess the current status of the state’s animal shelters.

Most New Jersey animal shelters voluntarily report detailed data to state authorities. Last month, I shared the 2015 summary statistics for New Jersey animal shelters on my Facebook page. Each year, the New Jersey Department of Health requests each licensed animal shelter in the state to submit animal shelter data for the previous year. Animal shelters voluntarily submit this data in the “Shelter/Pound Annual Report.” The New Jersey Department of Health takes these Shelter/Pound Annual Reports and compiles the number of dogs, cats and other animals impounded, redeemed, adopted and euthanized to prepare its Animal Intake and Disposition report. However, the Shelter/Pound Annual Reports include additional information on how animals were impounded (i.e. strays, owner surrenders, rescued from in-state facilities, rescued from out of state shelters, and cruelty/bite cases) and disposed of (i.e. returned to owner, adopted, sent to rescue/another shelter, and died/missing/other outcome). Additionally, the Shelter/Pound Annual Reports include the number of animals in shelters at the beginning and end of the year as well as the maximum number of animals facilities can hold. Thus, the Shelter/Pound Annual Reports include very important data not found in the New Jersey Department of Health’s summary report.

I compiled the data from these reports and analyze the results in this blog. 2015 statistics for each New Jersey animal shelter are listed at this link.

Garbage Data Raises Serious Questions About New Jersey Animal Shelters’ Statistics

Most New Jersey animal shelters do not properly account for their animals. Simple math dictates the number of animals at a facility at the beginning of the year, plus all animals coming in during the year, less all animals leaving for the period, should equal the number of animals a shelter has at the end of the year. Stunningly, 54 out of 91 shelters reporting these dog statistics and 55 out of 92 facilities submitting this cat data failed to get this right. While this is actually a significant improvement over the results in 2014, this raises serious questions about the accuracy of these shelters’ reported statistics. 25 of the 54 shelters with flawed dog statistics and 29 of the 55 facilities with incorrect cat statistics should have had more animals at the end of the year then reported. While these errors could have been due to incorrect counts of the number of animals at facilities, these shelters may have not recorded outcomes, such as animals who were killed, died, or went missing. To put it another way, 1,193 cats and dogs should have had outcomes reported and did not. Thus, there is the potential that as many as 1,193 additional dogs and cats were killed, died or went missing from New Jersey animal shelters than were reported in 2015.

Even worse, a number of animal shelters reported having a different number of animals at the end of 2014 and at the beginning of 2015. Obviously, shelters should report the same number of animals at the end of the prior year and the start of the current year. However, 40 of 90 shelters reported different numbers of dogs at the end of 2014 and the beginning of 2015. Similarly, 38 of 91 shelters reported different numbers of cats at the end of 2014 and the beginning of 2015. The worst offenders were Burlington County Animal Shelter (39 missing dogs and 98 missing cats at the beginning 2015), Monmouth SPCA (43 missing dogs and 56 missing cats at the beginning 2015) and Bergen Protect and Rescue Foundation (22 extra dogs and 76 missing cats at the beginning of 2015).

Shelters may have failed to classify animals adopted out and sent to rescue properly. Both Paterson Animal Control and Elizabeth Animal Shelter reported no animals were sent to rescues and all dogs and cats leaving their facilities alive were owner reclaims or adoptions. However, intake and disposition records I reviewed at both of these shelters in 2015 revealed virtually all “adopted” animals are actually rescued. This makes sense as neither shelter advertises animals for adoption on a web site like Petfinder. One has to wonder how many other facilities failed to properly classify adoptions and rescues properly. This data is very important as it provides details on the burden rescues and other shelters are taking on from these facilities.

We need better oversight of New Jersey animal shelters’ data reporting. Currently, these statistics are voluntarily reported and most shelters are not taking this seriously. For example, I noticed a large number of reports were submitted many months after the end of the year. This data should be easy to compile since facilities can utilize animal shelter software programs, some of which are free, to do this task. Furthermore, New Jersey animal shelter laws mandate facilities maintain much of the raw data found in the Shelter/Pound Annual Report. Unfortunately, New Jersey Department of Health inspections routinely find shelters do not properly keep records on animals. We need to make the Shelter/Pound Annual Report mandatory for animal shelters along with serious penalties for significant errors (especially if deliberate). In order for animal shelters to take data reporting seriously, we may also need to require audits of these reports. Thus, these results show we need stronger laws and the New Jersey Department of Health to play a greater role in ensuring reported animal shelter statistics are in fact accurate.

Despite the errors in these reports, the data provided still reveals important information.

More Animals Losing Their Lives in New Jersey Animal Shelters Than Disclosed in Summary Report

The more detailed data in the Shelter/Pound Annual Reports allows one to more critically examine the percentage of locally impounded animals dying in New Jersey’s animal shelters. The following table summarizes my analysis of the kill/death rate calculated from the New Jersey Department of Health’s summary report and the data reported in the Shelter/Pound Annual Reports.

2015 NJ Summary Totals2.jpgThe Animal Intake and Disposition report prepared by the New Jersey Department of Health only allows one to calculate the number of animals killed as a percentage of total animals impounded or intake. I prefer calculating the kill rate as a percentage of outcomes rather than intake as this metric directly compares positive and negative outcomes. Using intake may depress the kill rate since shelters can simply hold animals for a long time to the point of overcrowding. Calculating kill rate based on outcomes rather than intake increases the cat kill rate from 28.0% to 28.2% and the dog kill rate remains the same.

To calculate the statewide kill rate, we must also back out transfers from one New Jersey animal shelter to another state facility to avoid counting animals still in the state’s shelter system or registering two outcomes for the same animal (i.e. one New Jersey animal shelter transfers a dog or cat to another state facility who then adopts out the animal). This adjustment increases the dog kill rate from 10.6% to 11.2% and the cat kill rate from 28.2% to 30.5%.

In addition, we should increase the kill rate for animals who died or went missing in shelters. I label this metric the death rate as these animals are likely dead or in a very bad situation. Unfortunately, the Shelter/Pound Annual Report includes animals who died or went missing in the “Other” outcome category. While it is possible this “Other” category contains positive live releases, such as TNR for cats, I suspect the “Other” category consists almost entirely of animals who died or went missing for most shelters. Therefore, I classify animals in the “Other” category as dead or missing unless the shelter specifies the number of animals included in this category that left the shelter alive. For example, I do not count cats as dead/missing when shelters, such as Montclair Township Animal Shelter and Edison Animal Shelter, write a note on the form listing out the number of TNR cats placed in the “Other” outcome category. After making this adjustment, the dog death rate increases from 11.2% to 11.9% and the cat death rate rises from 30.5% to 35.8%.

Also, many shelters transport easy to adopt animals from out of state which artificially increases live release rates. To properly calculate the percentage of New Jersey animals losing their lives, we need to adjust for transports. Unfortunately, shelters don’t break out their save rates by local and out of state animals. However, most likely nearly all of the out of state animals (primarily puppies and easy to adopt dogs) make it out of shelters alive. Therefore, I back out the number of out of state transports to estimate the local death rate except for St. Hubert’s. Since St. Hubert’s subsequently transfers many of these animals to other shelters, I only subtract out the number of dogs St. Hubert’s rescues from out of state less the number of dogs it transfers to other shelters. This adjustment increases the New Jersey dog death rate from 11.9% to 14.4% and the state cat death rate from 35.8% to 36.1%.

Also, I estimate a maximum local death rate by including the number of unaccounted for animals described in the section above. Making this adjustment increases the maximum potential New Jersey dog death rate from 14.4% to 15.4% and the maximum potential state cat death rate from 36.1% to 37.5%.

Some animal shelters quickly return large percentages of their animals to owners. At these shelters, the populations served are typically well-off and animals are licensed and have microchips. To account for the animals facilities actually have to shelter, I calculated a death rate for non-reclaimed animals and a maximum potential death rate for non-reclaimed local animals. The non-reclaimed death rate and maximum potential death rate for dogs is 17.0% and 24.7%. Non-reclaimed cats had a 37.7% death rate and a 39.4% maximum potential death rate. Thus, the percentage of New Jersey animals losing their lives in our state’s animal shelters may be much higher than the state summary report suggests.

Death Rates Extremely High at a Number of New Jersey Animal Shelters

Dogs and cats are likely to lose their lives or go missing at a number of New Jersey animal shelters. Shelters with the highest death rates for dogs and cats (excluding very low intake facilities) are listed in the following tables:

2015 dog death rate

2015 cat death rate
Thus, both dogs and cats have a very good chance of leaving many New Jersey animal shelters dead rather than alive.

In terms of raw numbers, the following shelters had the most animals lose their lives or go missing:

2015 Dogs Killed died

2015 cats killed died

Many shelters fail to account for large numbers of their animals. As discussed above, a shelter’s number of animals at the end of the year should be calculated as follows:

Beginning number of animals + animals impounded – animals leaving the shelter

Unfortunately, a large number of shelters take in far more animals than they can explain where they went. Shelters having the highest numbers of unaccounted for dogs and cats are listed in the following tables:

2015 unaccounted for dogs

2015 unaccounted for cats

Dog and cat death rates at many shelters may be even higher if these unaccounted for animals are counted as dead or missing. If we only consider animal shelters which reported transporting few or no animals in 2015, facilities with the highest dog and cat death rates considering the unaccounted for animals described above are as follows:

2015 max pot dogs

2015 max pot cats.jpg

Thus, the plight of dogs and cats may be far worse in New Jersey animal shelters when we consider the unaccounted for animals.

Shelters Turn Their Backs on New Jersey’s Animals

New Jersey animal shelters rescue far more dogs from out of state than from other New Jersey animal shelters. Specifically, New Jersey animal shelters transferred in 5,350 dogs from out of state animal shelters and only rescued 1,631 dogs from other New Jersey animal shelters. In fact, transports of out of state dogs increased by 260 dogs while rescues of dogs from other New Jersey animal shelters decreased by 61 dogs in 2015 compared to 2014. While the state’s local death rate decreased in 2015, it is likely the local death rate would have decreased by more if not for the massive number of out of state transports.

While perhaps some shelters, such as Animal Alliance in Lambertville, take animals from nearby New York or Pennsylvania animal control shelters, the overwhelming majority of these dogs most certainly came from down south. In fact, New Jersey animal shelters transported more dogs from out of state than dogs who were killed in, died in and went missing from New Jersey animal shelters. This number does not include additional out of state dogs transported into New Jersey by rescues operating without a physical facility. Shelters transporting the most dogs from out of state were as follows:

2015 Dogs transported

Return to Owner Rates Better Than Average at Most Shelters

Return to owners (“RTO”) rates are one of the positive results from this analysis. Overall, the dog and cat RTO rates of 57% and 7% are approximately 2-3 times the national average. As I noted in my blog on reuniting lost pets with owners, return to owner rates are highly correlated with socioeconomic status. Wealthier people likely have more resources/knowledge to license and microchip their dogs. Similarly, people with greater incomes are more likely to afford reclaim fees or ransom payments to animal shelters. New Jersey’s RTO rates for dogs clearly fit this pattern with shelters serving wealthy towns returning most stray dogs to owners while certain urban shelters are returning a much lower percentage of lost dogs to owners. Clearly, we need to help people in urban areas get microchips and ID tags on their dogs. Additionally, we need to create pet help desks at shelters in these cities to help people pay the reclaim fees, which are often mandated by the cities themselves, when necessary. The statewide cat reclaim rate, like figures from across the nation, is still very low and suggests shelters need to figure out better ways to get lost cats back to their families. New Jersey should allow shelters to transfer stray cats to rescues during the mandatory 7 day hold period since few are returned to owners at shelters. This would open up space to save more cats and reduce the chance of disease (i.e. cats spending less time in shelters are not as likely to get sick).

To get a better idea of how organizations are doing with animals they actually have to shelter, I also examined what percentage of non-reclaimed dogs lose their lives at each facility. Shelters with the highest non-reclaimed dogs death rates are as follows:

2015 nonreclaimed dog death rate

Shelters with the highest maximum non-reclaimed dogs death rates are as follows (excluding facilities that reported transporting many dogs and taking very few animals in):

2015 max pot non rec death rate

Shelters Leave Animal Enclosures Empty While Dogs and Cats Die

New Jersey animal shelters fail to use their space to save animals. Based on the average number of animals at all of New Jersey’s animal shelters at the beginning and the end of 2015, only 49% of dog and 63% of cat capacity was used. Given December is a low intake month, I also increased these populations to an average intake month. This adjustment only raised the dog and cat capacity utilization to 51% and 95%. These estimates likely overestimate the average capacity utilized as many facilities kill animals once they reach a certain population level. Many animal shelters with low kill rates failed to rescue animals with their excess space. Additionally, other shelters used little of their available space and still killed a large percentage of their animals. Some examples after increasing the population (and therefore capacity utilization) based on the adjustment discussed above are as follows:

2015 space usage dogs.jpg

2015 space cusage cats.jpg

Thus, many New Jersey animal shelters are killing dogs and cats despite having ample space to house these animals.

New Jersey’s animal shelters continue to fail the state’s animals. The state’s animal shelters only impound 8.2 dogs and cats per 1,000 New Jersey residents. If we just count animals originating from New Jersey, the state’s animal shelters only impound 7.6 dogs and cats per 1,000 people. As a comparison, the average community in the country impounds anywhere from 14-30 animals per 1,000 residents based on estimates from Animal People Newspaper and the Humane Society of the United States. Despite New Jersey shelters impounding a fraction of the animals other no kill communities take in on a per capita basis, the state’s animal control facilities continue to kill and allow animals to die under their care. Even worse, many of these shelters can’t even properly keep track of how many animals leave their facilities dead or alive. Our state’s animals deserve far better treatment than this. Contact your local city council members and mayor and demand better from the animal shelter serving your community. We can do so much better and it is time our shelters operate this way.

2015 New Jersey Animal Shelter Statistics Show Significant Improvement and Prove Advocacy Works

Recently, a number of people and organizations in the no kill movement slammed animal advocates for demanding shelters save more animals. Susan Houser, who is the author of the Out the Front Door blog and Facebook page, repeatedly denounced animal advocates for criticizing regressive high kill shelters that allegedly were improving. Ms. Houser has also claimed strong advocacy was driving good leaders out of the shelter industry resulting in potentially less lifesaving. Best Friends Co-Founder, Francis Battista, wrote an article comparing President Obama’s recent statement on getting things done in a democracy to no kill movement tactics. While the article denounced people who say nasty things about high kill shelters, it also criticized people who act with “moral purity” and call out those regressive facilities. In a nutshell, Mr. Battista stated people should shut up and not try to win over hearts and minds with principled stands and instead try to work with bad actors.

Does strong advocacy that is highly critical of shelters reduce or increase lifesaving?

Data Reviewed

Each year, licensed animal shelters in the state submit animal shelter data to the New Jersey Department of Health for the previous year. For the last several years, I’ve tabulated this data and calculated various metrics. You can view the 2015 data at this link. After compiling the 2015 data, I compared the results to the 2014 statistics I tabulated last year.

2015 Statistics Show Significant Increase in Lifesaving

The table below summarizes the dog statistics in 2015 and 2014. To see how I calculate the various metrics, please review the footnotes in this link and my blog analyzing the 2014 statistics.

All dog statistics significantly improved in 2015 verses 2014. While an approximate 3% decrease in the dog kill and death rates may not seem huge, this is a large decrease considering the prior kill and death rates were relatively low. For example, a 2.9% decrease in the 2014 kill rate of 13.5% represents a 21% reduction. As a comparison, in 2014 the kill rate based on intake was 0.1% higher than the 2013 figure and the death rate based on outcomes was only 0.7% lower than this measure in 2013. Given saving the last 15% of animals is more difficult due to animals having more medical and behavioral problems that require treatment, this result is very good. Additionally, the larger decrease in the death rate for non-reclaimed animals indicates the kill rate decreased even more for dogs shelters actually had to find new homes for. Finally, the larger decrease in the maximum local death rate indicates shelters had less unaccounted for animals and this may indicate even fewer animals lost their lives in the state’s shelters in 2015 verses 2014.

2015 Dog vs 2014 stats

The cat statistics improved even more than the dog statistics in 2015 verses 2014. As you can see in the table below, the kill rates and death rates decreased by approximately 7% and 8% in 2015 compared to 2014. As a comparison, the cat kill rate based on intake and the cat death rate based on outcomes only decreased by 3.9% and 3.8% in 2014 verses 2013. Even more impressive, the maximum local death rate decreased by around 10% in 2015 compared to 2014. Thus, New Jersey animal shelters became much safer places for cats in 2015 than in 2014.

2015 cat vs 2014 stats

Dog Kill Rate Decreases Due to Lower Intake and Shelters Saving a Greater Percentage of Impounded Animals

The table below summarizes the changes in the dog statistics in 2015 verses 2014. Based on the changes in the metrics used moving in a similar direction, I anlyzed the kill rate based on intake below. As you can see, both dog intake and dogs killed decreased significantly while positive outcomes decreased much less. In particular, dog adoptions barely decreased despite shelters receiving 1,870 fewer dogs in 2015 compared to 2014.

Data from prior years indicates positive outcomes along with lower intake drove the improvement in the dog kill rate in 2015. While lower intake can theoretically increase live release rates due to shelters having more time and space to save animals as well as having more resources per animal, this does not always work out in the real world. For example, shelters may kill with empty cages and hoard money instead of spending it on animals. In 2014, dog intake decreased by more from the prior year (2,821 fewer dogs impounded), but the number of dogs reclaimed by owners, adopted out and sent to rescues decreased by almost as much (2,292 fewer positive dog outcomes). Therefore, the kill rate for dogs based on intake actually increased despite lower intake due to fewer positive outcomes. This indicates the decrease in the dog kill rate in 2015 was not only due to shelters taking fewer animals in, but shelters also finding more positive outcomes for the dogs coming into their facilities. In fact, this latter conclusion is consistent with my finding that New Jersey shelters have plenty of space to save their dogs and many others from elsewhere.

Dog 2015 vs 2014 reasons

The table below details which shelters contributed most to the decrease in the dog kill rate in the state during 2015. As you can see, this list mostly represents large shelters that have high kill rates (i.e. shelters with high kill rates have more room for improvement).

Dog Shelter Kill Rate Impact

The following table showing the change in data at each shelter in 2015 verses 2014 highlights the pattern of shelters saving a greater percentage of animals they took in during 2015. As you can see, the reduction in dogs killed made up a large percentage of the drop in intake while positive outcomes decreased by much less or actually increased in some cases.

Atlantic County Animal Shelter and Liberty Humane Society deserve specific recognition for achieving greater than 90% live release rates for dogs in 2015 (i.e. often considered no kill status). The kill rate at Atlantic County Animal Shelter decreased from 19% in 2014 to 8% in 2015. Liberty Humane Society’s kill rate decreased from 21% in 2014 to 5% in 2015. These results are impressive as both shelters serve some very poor areas of the state. Atlantic County Animal Shelter’s kill rate decreased due to a combination of lower intake and adopting out more dogs and sending more dogs to rescues and other shelters. On the other hand, Liberty Humane Society’s kill rate decreased due to lower intake resulting from implementing a pet surrender prevention program and an appointment system for owner surrenders. While I’m not thrilled that the shelter has a “significant wait period” for owner surrenders, I much prefer this system over killing healthy and treatable dogs.

2015 Summary Stats (1) (7)

Cat Kill Rate Decreased Due to Shelters Increasing Positive Outcomes

The table below summarizes the changes in the cat statistics in 2015 verses 2014. In contrast to dogs, New Jersey shelters impounded more cats during 2015 as compared to 2014. However, the state’s shelters significantly increased positive outcomes.

Unfortunately, it is difficult to determine how much of the increase is due to TNR. Generally speaking, many more communities embraced TNR in 2015. However, the “Shelter/Pound Annual Report” shelters fill out does not provide TNR as an outcome. In practice, some shelters may place TNR cats in the return to owner (RTO), adopted, sent to rescues or other categories. Montclair Township Animal Shelter wrote in the number of their TNR cats in 2015 and 2014 and Edison Animal Shelter did so in 2015. I included these cats in the TNR category. Additionally, approximately 500-600 of the increase in cats returned to owners likely represents TNR based on this article and Bergen County Animal Shelter’s increase in cats returned to owners listed below.

c

The table below details which shelters contributed most to the decrease in the cat kill rate in the state during 2015.

Cats 2015 kill rate change

The following table showing the change in data at each shelter in 2015 verses 2014 documents the increase in positive live releases. All shelters except for Jersey Shore Animal Center, which stopped serving as an animal control shelter in 2015, significantly increased the number of cats adopted out and/or sent to rescue. As indicated above, approximately 500-600 more cats were neutered and released at Bergen County Animal Shelter in 2015, and were likely included in the RTO category. Therefore, the increase in the cat live release rate was largely due to shelters increasing the number of positive outcomes.

Cats shelter 2015 vs 2014

Advocacy Efforts Coincide with Increase in Lifesaving

Obviously, people working with animals, such as shelter staff, volunteers and rescuers are directly responsible for the increase in lifesaving. However, advocacy efforts can create the climate where those people are allowed to save lives in a more effective manner. For example, public pressure can force a shelter to start a kitten foster program, do off-site adoption events, and act more rescue friendly.

Statewide shelter advocacy efforts began to grow in 2015. While this blog and my related Facebook page started in early 2014, readership increased significantly in 2015. Additionally, I started analyzing and grading each of the state’s animal shelters at the end of 2014 which I think put pressure on many facilities to improve. In the past, no one really knew what went on behind closed doors. Also, a number of local advocates have told me the ideas expressed on this blog and my Facebook page inspired them to take action. Several advocates also told me that exposing poorly performing shelters they were fighting helped their cause. Thus, I do think this blog and my related Facebook page helped create a climate where local advocacy efforts could be more successful.

The Reformers-Advocates for Shelter Change in NJ group also likely positively contributed to the increase in the state live release rate in 2015. This no holds barred animal advocacy group grew out of the movement to reform the Helmetta Regional Animal Shelter and started having a significant impact in 2015. The Reformers use the Open Public Records Act (OPRA), powerful messaging and relentless public pressure to bring bad actors to justice. While this group employs much different tactics than I use and sometimes has different views on things than me, they have been wildly successful at exposing the NJ SPCA, pet stores, disreputable rescues, poorly performing animal shelters and even facilities with high live release rates. Love them or hate them, no one can deny the positive impact this group has had on New Jersey animal welfare. In fact, many regressive shelters truly fear this group and that alone may change bad behavior.

Local advocacy efforts seem to have increased in recent years. While I can’t quantify this phenomenon, I do see these campaigns increasing and getting more media exposure. Ultimately, local advocates on the ground are the key actors in forcing change.

Finally, the professional advocacy efforts by groups like People for Animals and the Animal Protection League of New Jersey have played a key role in convincing municipalities to implement TNR. These groups bring well-thought out plans that provide compelling cases, for fiscal, public health and humane reasons, to convince towns to adopt TNR.

Clearly, confrontational shelter advocacy efforts have played a positive role in New Jersey animal welfare. If shelter killing can decrease to this extent during the same time a no holds barred group like the Reformers have actively inserted themselves into the state’s shelter issues, then that pretty much proves the argument that confrontational shelter advocacy efforts work. While I favor a less in your face approach more akin to Ryan Clinton’s campaign in Austin, I do believe we must honestly call out shelters that needlessly kill and not brush that killing under the rug for the sake of collaboration. Personally, I have great respect for the work Best Friends has done to create no kill communities, and do not oppose collaboration when appropriate. In fact, I have often advocated that shelters should work together to save lives in New Jersey. However, Best Friends and Susan Houser should not make bold assertions about confrontational animal advocacy efforts without having solid data to back those claims up. As the data in this blog shows, Best Friends and Ms. Houser are dead wrong about confrontational shelter advocacy efforts, at least in New Jersey.

Speaking as someone who for years did just the things Mr. Battista is arguing for, I found his remarks perplexing. As many of us who have worked and volunteered within our broken sheltering system know, most regressive shelter leaders and animal unfriendly politicians have little interest in saving lives. At the same time, we know the public at large wants to save animals in shelters and is unaware of just how bad most of our shelters are. Naturally, making the public aware of what is really going on in shelters and calling for action puts pressure on those elected officials and shelter leaders. This pressure in turn improves the negotiating position of those animal advocates engaging elected officials and shelter directors.

In the political world, we have opinion columnists, think tanks, and special interest groups that change public opinion to make negotiations more favorable for their causes. Whether you like the National Rifle Association or not, no one can deny how effective their “moral purity” stances have been in blocking laws they oppose and passing ones they support. Thus, advocates arguing on principle help other advocates doing the negotiating for change.

Unfortunately, New Jersey animal shelters still kill too many animals and do not save nearly as many pets as they should. In future blogs, I’ll address the current state of New Jersey animal shelters. Clearly, New Jersey shelter reform advocates have much work to do, but at least for a moment, they can feel good about the recent progress made.

2014 New Jersey Animal Shelter Statistics Show Little Improvement

East Orange Animal Shelter Dog

Most New Jersey animal shelters voluntarily report detailed data to state authorities. Last September, I shared the 2014 summary statistics for New Jersey animal shelters on my Facebook page. Each year, the New Jersey Department of Health requests each licensed animal shelter in the state to submit animal shelter data for the previous year. Animal shelters voluntarily submit this data in the “Shelter/Pound Annual Report.” The New Jersey Department of Health takes these Shelter/Pound Annual Reports and compiles the number of dogs, cats and other animals impounded, redeemed, adopted and euthanized to prepare its Animal Intake and Disposition report. However, the Shelter/Pound Annual Reports include additional information on how animals were impounded (i.e. strays, owner surrenders, rescued from in-state facilities, rescued from out of state shelters, and cruelty/bite cases) and disposed of (i.e. returned to owner, adopted, sent to rescue/another shelter, and died/missing). Additionally, the Shelter/Pound Annual Reports include the number of animals in shelters at the beginning and end of the year as well as the maximum number of animals facilities can hold. Thus, the Shelter/Pound Annual Reports include very important data not found in the New Jersey Department of Health’s summary report.

I compiled the data from these reports and analyze the results in this blog. 2014 statistics for each New Jersey animal shelter are listed at this link.

Garbage Data Raises Serious Questions About New Jersey Animal Shelters’ Statistics

Several animal shelters, which reported statistics in prior years, failed to submit data in 2014. Specifically, Livingston Animal Shelter, Hunterdon Hills Animal Hospital, All Pets Veterinary Hospital and Warren Animal Hospital disclosed this data in 2013, but did not do so in 2014. These shelters failure to disclose data raises serious questions. For example, are they trying to hide embarrassing statistics from the public?

Most New Jersey animal shelters do not properly account for their animals. Simple math dictates the number of animals at a facility at the beginning of the year, plus all animals coming in during the year, less all animals leaving for the period, should equal the number of animals a shelter has at the end of the year. Stunningly, 67 out of 96 shelters reporting these dog statistics and 68 out of 95 facilities submitting this cat data failed to get this right. This raises serious questions about the accuracy of these shelters’ reported statistics. Even worse, 42 of the 67 shelters with flawed dog statistics and 43 of the 68 facilities with incorrect cat statistics should have had more animals at the end of the year then reported. While these errors could have been due to incorrect counts of the number of animals at facilities, the more likely answer is many outcomes, such as animals killed, dying, or gone missing, were not recorded. Given 63% of the errors were due to shelters having less rather than more animals on hand at the end of the year than they should have had lends credence to the theory that errors were mostly due to shelters failing to account for various outcomes. To put it another way, 2,699 cats and dogs should have had outcomes reported and did not. Thus, there is the potential that as many as 2,699 additional dogs and cats were killed, died or went missing from New Jersey animal shelters than were reported in the last year.

Shelters may have failed to classify animals adopted out and sent to rescue properly. Both Paterson Animal Control and Elizabeth Animal Shelter reported no animals were sent to rescues and all dogs and cats leaving their facilities alive were owner reclaims or adoptions. However, rescues I know who work closely with these two facilities told me both shelters rarely adopt animals directly to the public. This makes sense as neither shelter advertized animals for adoption (i.e. no adoption web site or social medial pages run by the two shelters) in 2014. One has to wonder how many other facilities failed to properly classify adoptions and rescues properly. This data is very important as it provides details on the burden rescues and other shelters are taking from these facilities.

We need better oversight of New Jersey animal shelters’ data reporting. Currently, these statistics are voluntarily reported and most shelters are not taking this seriously. For example, I noticed a large number of reports were submitted many months after the end of the year. This data should be easy to compile since facilities can utilize animal shelter software programs, some of which are free, to do this task. Furthermore, New Jersey animal shelter laws mandate facilities maintain much of the raw data found in the Shelter/Pound Annual Report. Unfortunately, New Jersey Department of Health inspections routinely find shelters do not properly keep records on animals. We need to make the Shelter/Pound Annual Report mandatory for animal shelters along with serious penalties for significant errors (especially if deliberate). In order for animal shelters to take data reporting seriously, we may also need to require audits of these reports. Thus, these results show we need stronger laws and the New Jersey Department of Health to play a greater role in ensuring reported animal shelter statistics are in fact accurate.

Despite the errors in these reports, the data provided still reveals important information.

More Animals Losing Their Lives in New Jersey Animal Shelters Than Disclosed in Summary Report

The more detailed data in the Shelter/Pound Annual Reports allows one to more critically examine the percentage of locally impounded animals dying in New Jersey’s animal shelters. The following table summarizes my analysis of the kill/death rate calculated from the New Jersey Department of Health’s summary report and the data reported in the Shelter/Pound Annual Reports.

2014 Summary Stats (1) (1) (2)The Animal Intake and Disposition report prepared by the New Jersey Department of Health only allows one to calculate the number of animals killed as a percentage of total animals impounded or intake. I prefer calculating the kill rate as a percentage of outcomes rather than intake as this metric directly compares positive and negative outcomes. Using intake depresses the kill rate since shelters can simply hold animals for a long time to the point of overcrowding. Calculating kill rate based on outcomes rather than intake increases the cat kill rate from 34.6% to 35.2% and the dog kill rate remains the same.

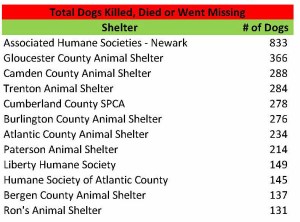
To calculate the statewide kill rate, we must also back out transfers from one New Jersey animal shelter to another state facility to avoid counting animals still in the state’s shelter system or registering two outcomes for the same animal (i.e. one New Jersey animal shelter transfers a dog or cat to another state facility who then adopts out the animal). This adjustment increases the dog kill rate from 13.5% to 14.2% and the cat kill rate from 35.2% to 37.4%.

In addition, we should increase the kill rate for animals who died or went missing in shelters. I label this metric the death rate as these animals are likely dead or in a very bad situation. After making this adjustment, the dog death rate increases from 14.2% to 14.8% and the cat death rate rises from 37.4% to 43.4%.

Also, many shelters transport easy to adopt animals from out of state which artificially increases live release rates. To properly calculate the percentage of New Jersey animals losing their lives, we need to adjust for transports. Unfortunately, shelters don’t break out their save rates by local and out of state animals. However, most likely nearly all of the out of state animals (primarily puppies and easy to adopt dogs) make it out of shelters alive. Therefore, I back out the number of out of state transports to estimate the local death rate except for St. Hubert’s. Since St. Hubert’s subsequently transfers many of these animals to other shelters, I only subtract out the number of dogs St. Hubert’s rescues from out of state less the dogs it transfers to other shelters. This adjustment increases the New Jersey dog death rate from 14.8% to 17.7% and the state cat death rate from 43.4% to 43.8%.

Also, I estimate a maximum local death rate by including the number of unaccounted for animals described in the section above. Making this adjustment increases the maximum potential New Jersey dog death rate from 17.7% to 20.6% and the maximum potential state cat death rate from 43.8% to 47.3%.

Some animal shelters quickly return large percentages of their animals to owners. At these shelters, the populations served are typically well-off and animals are licensed and have microchips. To account for the animals facilities actually have to shelter, I calculated a death rate for non-reclaimed animals and a maximum potential death rate for non-reclaimed local animals. The non-reclaimed death rate and maximum potential death rate for dogs is 20.9% and 31.7%. Non-reclaimed cats had a 44.8% death rate and a 48.9% maximum potential death rate. Thus, the percentage of New Jersey animals losing their lives in our state’s animal shelters may be much higher than previously thought.

Overall, the statewide statistics showed little improvement from 2013. The dog death rate in 2014 only was three tenths of one percent lower than 2013. While the maximum potential dog death rate was 3.4 percentage points lower in 2014, we don’t know whether that is due to better record keeping or actually improved life saving. The cat death rate and maximum potential death rate decreased by 3.4% and 4.2%. The growing acceptance of TNR likely slightly decreased the percentage of cats losing their lives in New Jersey animal shelters this year. That being said, the improvements were very small and the percentage of dogs and cats losing their lives in the state’s animal shelters is still way too high.

Death Rates Extremely High at a Number of New Jersey Animal Shelters

Dogs and cats are likely to lose their lives or go missing at a number of New Jersey animal shelters. Shelters with the highest death rates for dogs and cats (excluding very low intake facilities) are listed in the following tables:

Dog Death rate 2014

Cat Death Rate 2014

Thus, both dogs and cats have a very good chance of leaving many New Jersey animal shelters dead rather than alive.

In terms of raw numbers, the following shelters had the most animals lose their lives or go missing:

Total Killed Died 2014 Dogs

Total Killed Died 2014 Cats

Many shelters fail to account for large numbers of their animals. As discussed above, a shelter’s number of animals at the end of the year should be calculated as follows:

Beginning number of animals + animals impounded – animals leaving the shelter

Unfortunately, a large number of shelters take in far more animals than they can explain where they went. Shelters having the highest numbers of unaccounted for dogs and cats are listed in the following tables:

Unacct dogs

Unacct cats 2014

Dog and cat death rates at many shelters may be even higher if these unaccounted for animals are counted as dead or missing. If we only consider animal shelters which reported transporting few or no animals in 2014, facilities with the highest dog and cat death rates considering the unaccounted for animals described above are as follows:

Max Pot Dr 2014 Dogs

Max Pot cats 2014

Thus, the plight of dogs and cats may be far worse in New Jersey animal shelters when we consider the unaccounted for animals.

Shelters Turn Their Backs on New Jersey’s Animals

New Jersey animal shelters rescue far more animals from out of state than other New Jersey animal shelters. Specifically, 5,090 dogs were transferred from out of state animal shelters compared to only 1,692 dogs taken in from other New Jersey animal shelters. The number of out of state dogs transported into New Jersey decreased in 2014, but that is due to problems at Jersey Animal Coalition and Helmetta Regional Animal Shelter during the year. These problems likely resulted in fewer transported dogs. However, Jersey Animal Coalition, which is now closed, did not report any statistics for 2014. Furthermore, Helmetta Regional Animal Shelter erroneously reported it transported no dogs during 2014 as the facility imported many dogs from the south before the shelter’s problems received media attention in the summer of 2014. Thus, the decrease in transports is likely due to a combination of  incorrect reporting and increased regulatory pressure on these two shelters that transported many dogs into New Jersey.

While perhaps some shelters, such as Animal Alliance in Lambertville, take animals from nearby New York or Pennsylvania animal control shelters, the overwhelming majority of these dogs most certainly came from down south. In fact, New Jersey animal shelters transported more dogs from out of state than dogs who were killed in, died in and went missing from New Jersey animal shelters. This number does not include additional dogs transported in from out of state by rescues operating without a physical facility. Shelters transporting the most dogs from out of state were as follows:

Dogs Transported 2014

Return to Owner Rates Better Than Average at Most Shelters

Return to owners (“RTO”) rates are one of the positive results from this analysis. Overall, the dog and cat RTO rates of 55% and 5% are approximately twice the national average. As I noted in my blog on reuniting lost pets with owners, return to owner rates are highly correlated with socioeconomic status. Wealthier people likely have more resources/knowledge to license and microchip their dogs. Similarly, people with greater incomes are more likely to afford reclaim fees or ransom payments to animal shelters. New Jersey’s RTO rates for dogs clearly fit this pattern with shelters serving wealthy towns returning most stray dogs to owners while many urban shelters are only returning about around a quarter of lost dogs to owners. Clearly, we need to help people in urban areas get microchips and ID tags on their dogs. Additionally, we need to create pet help desks at shelters in these cities to help people pay the reclaim fees, which are often mandated by the cities themselves, when necessary. The statewide cat reclaim rate, like figures from across the nation, is still very low and suggests shelters need to figure out better ways to get lost cats back to their families. New Jersey should allow shelters to transfer stray cats to rescues during the mandatory 7 day hold period since few are returned to owners at shelters. This would open up space to save more cats and reduce the chance of disease (i.e. cats spending less time in shelters are not as likely to get sick).

To get a better idea how organizations are doing with animals they actually have to shelter, I also examined what percentage of non-reclaimed dogs lose their lives at each facility. Shelters with the highest non-reclaimed dogs death rates are as follows:

non-reclaimed dog death rate

Shelters with the highest maximum non-reclaimed local dogs death rates are as follows (excluding facilities that reported transporting many dogs and taking very few animals in):

Max non-reclaimed dog death rate

Shelters Leave Animal Enclosures Empty While Dogs and Cats Die

New Jersey animal shelters fail to use their space to save animals. Based on the average number of animals at all of New Jersey’s animal shelters at the beginning and the end of 2014, only 53% of dog and 65% of cat capacity was used. Given December is a low intake month, I also increased these populations to an average intake month. This adjustment only raised the dog and cat capacity utilization to 62% and 85%. These estimates likely overestimate the average capacity utilized as many facilities kill animals once they reach a certain population level. Many animal shelters with low kill rates failed to rescue animals with their excess space. Additionally, other shelters used little of their available space and still killed a large percentage of their animals. Some examples after increasing the population (and therefore capacity utilization) based on the adjustment discussed above are as follows:

Space usage dogs 2014

Space usage Cats 2014

Thus, many New Jersey animal shelters are killing dogs and cats despite having ample space to house these animals.

New Jersey’s animal shelters continue to fail the state’s animals. The state’s animal shelters only impound 9.0 dogs and cats per 1,000 New Jersey residents. If we just count animals originating from New Jersey, the state’s animal shelters only impound 7.9 dogs and cats per 1,000 people. As a comparison, the average community in the country impounds anywhere from 14-30 animals per 1,000 residents based on estimates from Animal People Newspaper and the Humane Society of the United States. Despite New Jersey shelters impounding a fraction of the animals other no kill communities take in on a per capita basis, the state’s animal control facilities continue to kill and allow animals to die under their care. Even worse, many of these shelters can’t even properly keep track of how many animals leave their facilities dead or alive. Our state’s animals deserve far better treatment than this. Contact your local city council members and mayor and demand better from the animal shelter serving your community. We can do so much better and it is time our shelters operate this way.