Has Humane Rescue Alliance truly become a progressive shelter? Did its involvement with HASS and its hiring of Maddie’s Fund and Austin Pets Alive supported executives help Washington DC’s animals?
Animals Left to Rotin Crates
DCist/WAMU wrote a scathing article about volunteer allegations against Humane Rescue Alliance’s Washington DC shelters. Ten volunteers assert that the shelter is failing to provide humane care to its animals. Specifically, the volunteers state Humane Rescue Alliance understaffs its shelters and is relying too heavily on unpaid volunteers. Volunteers allege the shelter isn’t even taking care of the animals’ basic needs:
The very fact that there isn’t a system in place to ensure that the dogs are taken out in regular intervals is really problematic. I would say that the volunteers are starting to be the primary caretakers for a lot of the dogs in terms of enrichment and outside kennel time.
Humane Rescue Alliance’s spokesperson wanted the reporter not to worry. The spokesperson insinuated these conditions occur at shelters nationwide due to increased animal intake this year. While dog intake is higher this year, it is still significantly below the levels prior to the pandemic. The spokesperson also claimed it employed enough staff to provide the animals 30 minutes of care a day and hired a cleaning company.
However, one volunteer stated Humane Rescue Alliance’s staffing numbers are below the levels from before the pandemic and are insufficient to care for the animals. She stated staffing levels to feed, walk and medicate 70-80 dogs at the New York Avenue shelters decreased from 12-14 in pre-pandemic times to four currently. Volunteers at the Ogelthorpe shelter said sometimes only one worker was around to let out 60 dogs to go to the bathroom before their 7 pm bedtimes.
Volunteers stated the kennels are filthy. In fact, the volunteers said Humane Rescue Alliance would pursue “a neglect case” if the average person kept animals in these conditions and then try to fundraise off of it:
If we go to New York Avenue tomorrow morning, the kennels would be filthy, and it would be the volunteers that are running around trying to clean kennels and take dogs out.
If HRA found this somewhere out in the community, it would be a neglect case,” said one long-time volunteer, who asked not to be named because they want to continue volunteering with the organization “Like, [HRA] would be talking about it in the media, they would be fundraising around it.
While Humane Rescue Alliance denies it keeps animals in these poor conditions or fails to let animals go to the bathroom on a timely basis, volunteer photos taken over the last couple of weeks prove the shelter wrong:
Similarly, a volunteer video of the dogs warehoused in crates backup the allegations.
The volunteers allege the dogs in this video are in windowless warehouse, are sick and housed within feet of each other. While the DCist article states HRA’s crating policy says adopters should only keep dogs in crates for four hours at a time and for a maximum of 14 hours a day, volunteers allege the shelter has dogs in crates for days and they are only getting out about once per day. One long-term volunteer stated the following things about these conditions:
It is heartbreaking – some of the dogs can’t turn around in their crates, some of them have no linens in them. The ones that have a washcloth or a hand towel, it’s usually soaked in urine. It’s covered in feces, they don’t have water. It is impossible to take them outside on hot days because they’re surrounded by the parking lot.
So what was the esteemed Humane Rescue Alliance spokesperson’s response? Basically, don’t worry its part of our business.
We’re often over capacity, which means that we’ve had dogs living in crates, which is heartbreaking,” the spokesperson said. “And so one of the big problems that happens is that disease spreads the more animals you have.
Volunteers disputed that being at capacity necessitates cruelty:
It used to be, when I started…a much better-organized location,”Dogs were taken out regularly, they received behavioral treatment. Today, dogs do not leave their kennels. Maybe they get out once a week. These kennels are disease-ridden, they often live in their own filth.
Humane Rescue Alliances Kills on a Whim
The DCist/WAMU article also describes volunteer allegations about the shelter quickly killing its neglected dogs. One volunteer describes how the shelter uses its poor conditions as a reason to kill:
Not only is it a health issue – they completely deteriorate mentally, and they’re immediately euthanized because they’re deteriorating. That is the pattern that we’ve seen consistently.
One volunteer stated the shelter kills dogs for simply looking at a staff member the wrong way:
There have been dogs who have been euthanized for no bite incident, just for giving a behavioral manager a hard stare or growling.
In response, the esteemed Humane Rescue Alliance spokesperson, who appears to haven’t walked into the shelter for a very long time, denied the shelter killing for space and called itself “progressive” and better than most facilities:
We are really progressive when it comes to life-saving,” the spokesperson said. “We’re just going through what most shelters are going through in the country, and I would say we’re well-resourced enough that it’s not nearly as excruciating.
The spokesperson stated the shelter has a “rigorous” process for making “tough choices” (i.e. killing):
If a dog is struggling, we have a rigorous decision-making process to determine what interventions are needed,” the spokesperson said. “Most dogs who are struggling see improvements as a result of these interventions and we’re able to find them an adoptive home. For a very small number of dogs, our team must make extremely tough choices for the health and safety of community members and their pets.
While the DCist/WAMU article was excellent, it mislead readers about Humane Rescue Alliance’s live release rate. The 94.7% live release rate cited for 2021 is incorrect for the following reasons:
It combines dog and cat live release rates that obscure dog killing
The figure excludes owner-requested euthanasia (which Humane Rescue Alliance has used to coerce owners into agreeing to) and animals who died in the shelter
The figure counts animals rescued from other shelters, including the many St. Hubert’s transports in
The figure counts animals St. Hubert’s transports in and quickly transports out to other shelters
My prior blog showed Humane Rescue Alliance killed massive percentages of Washington DC animals in 2020 and 2019. 29% of all dogs, 33% of pit bulls, 15% of all cats and 19% of cats 1 year and older lost their lives over those two years. When only looking at animals not reclaimed by an owner or neutered and released, 38% of all dogs, 41% of pit bulls, 18% of all cats and 22% of adult cats lost their lives. For dogs and cats 10 years and older, these death rate and nonreclaimed death rate figures were even more frightening: all dogs (63% and 76%), pit bulls (77% and 88%), cats (61% and 67%). To make matters worse, Humane Rescue Alliance killed most of its animals almost immediately: 64% of the dogs, 90% of the senior dogs, 76% of the cats and 87% of the senior cats lost their lives within two days of arriving at the facility.
HASS Fails the Animals
Austin Pets Alive and other shelter directors, including Humane Rescue Alliance’s Lisa LaFontaine, created the HASS sheltering model at the start of the COVID-19 pandemic to drastically reduce shelter intake. Under the model, shelters only take in emergency case animals (dangerous dogs, severely injured pets, etc.) and demand the public save all other animals (including strays). Austin Pets Alive claims HASS shelters support the public in these efforts on its website.
The DCist/WAMU article proves HASS shelters do virtually nothing to help the public save animals. One former employee stated Humane Rescue Alliance cut back on both its community cat and pet owner support programs, such as veterinary care assistance for impoverished pet owners, free vaccine and spay-neuter clinics and dog training assistance:
It was all designed to make sure that animals are happier, healthier, and staying in their homes – preventing them from needing to ever get returned to the shelter for behavior issues, for having too many puppies,” Cochran said. “These were awesome, progressive programs… and all of that has been cut back.
Humane Rescue Alliance’s spokesperson admitted HASS social services program do not work by stating the initiatives aren’t sufficient to offset increased animal intake at the shelter. While Humane Rescue Alliance has not made 2022 or 2023 data available, Humane Rescue Alliance and St. Hubert’s combined cat and dog intake from the local community was 25% lower in 2021 (7,479 dogs and cats) than in 2019 (9,941 dogs and cats). National animal sheltering data suggests animal intake increases in 2022 and 2023 do not come close to reaching 2019 levels.
Even if Humane Rescue Alliance’s animal intake truly is higher than ever, its actions prove it is not serious about saving Washington DC’s animals. In 2022, Humane Rescue Alliance’s St. Hubert’s-Madison facility brought in 2,132 dogs (1,470 out of state transports) and 169 cats (119 transported in from out of state) from other shelters. Since St. Hubert’s other New Jersey shelters did not report 2021 data, these numbers could be even higher. While its possible some of St. Hubert’s out of state transports came from Humane Rescue Alliance in Washington DC, it is unlikely to be significant based on St. Hubert’s transport oriented business model.
At the beginning of this month, Humane Rescue Alliance’s St. Hubert’s shelters transported in 50 dogs and cats from the south on a flight. In other words, Humane Rescue Alliance was allowing its Washington DC shelter dogs to live in squalor at the same time it was transporting dogs and cats into its St. Hubert’s shelters. Thus, Humane Rescue Alliance tried to make money off transports (fundraising and high adoption fees) while its own dogs live in tiny crates with feces and are killed for looking at people the wrong way.
One Humane Rescue Alliance volunteer describes the Washington DC shelter situation as preventable:
This is just not the type of thing I would imagine in some place like D.C., where there is a lot of money, there are a lot of resources. There’s no way this should be happening.
In fact, the volunteers blame Humane Rescue Alliance’s management for the shelter’s problems:
But the management, the very senior management, I think are unfortunately pretty detached from what’s happening on a day-to-day basis in the shelter. If you were to look at [HRA’s] social media, you would think that every dog is just living a great life in there. It’s just not true.
Humane Rescue Alliance’s embrace of HASS and hiring of the new executives are political cover to maintain its current money making business model. At the end of 2022, Humane Rescue Alliance had $45 million of net assets ($26 million excluding its facilities) that could be deployed to help its animals. Instead, it skimps on animal care and key programs to save lives and wastes money on overpaid and inept executives. Simply put, Humane Rescue Alliance is a money making scam designed to enrich its executives while failing to adequately serve Washington DC’s animals and its people.
Washington DC officials must force Humane Rescue Alliance to fire Lisa LaFontaine or terminate its contract with the organization. The sooner the city moves on Ms. LaFontaine leadership, the sooner Washington DC’s animals and its people can get the service they deserve.
In 2013, the ASPCA and St. Hubert’s announced the opening of a “Behavioral Rehabilitation Center” at the St. Hubert’s-Madison shelter to rehabilitate abused dogs from cruelty cases. At the time, the ASPCA stated:
Dogs admitted to the Center will undergo an intensive rehabilitation regimen, with the goal of improving their well-being and helping them become suitable for adoption.
St. Hubert’s stated the following at the same time:
“St. Hubert’s is proud and thrilled to work with the ASPCA on this groundbreaking initiative to help the neediest victims of animal cruelty and the untold numbers of animals in the future who will benefit from the lessons learned through this program”
The ASPCA announced it would publish a research study about its work at this “Behavioral Center” at the time. On June 30, 2022, the ASPCA published its study.
What did the ASPCA study show? Did the ASPCA and St. Hubert’s do right by these victims of animal cruelty?
Scared and Abused Dogs Slaughtered
The ASPCA and St. Hubert’s program severely restricted the types of dogs it took in. The dogs were victims of animal cruelty or neglect who were fearful or exhibited such behavior. The program would not accept the following types of dogs:
Physically unhealthy dogs
Dogs with other behavior problems, such as resource guarding, dog aggression and separation anxiety
Dogs with offensive aggression
From 2013 to 2016, the study took place at the St. Hubert’s-Madison shelter. In 2018, the Behavioral Rehabilitation Center moved to Weaverville, North Carolina. However, the results did not significantly differ between the two facilities and the authors pooled both locations for their study.
Despite the ASPCA taking in physically healthy dogs and those who didn’t display serious aggression (i.e. offensive as opposed to defensive aggression) and other behavior issues, the organization still killed 61 out of 441 or 14% of these scared and abused dogs (two additional dogs were killed by organizations receiving them from the ASPCA).
Death Panel Kills Traumatized Dogs
The Behavioral Rehabilitation Center’s protocol was limited. For five days each week, the organizations provided a mere 15 minutes of “treatment” a day. In fact, dogs on average only spent 93 days (St. Hubert’s) and 108 days (North Carolina) in the program. Therefore, dogs only received on average 4 hours and 39 minutes and 5 hours and 24 minutes of total “treatment” at the St. Hubert’s and North Carolina facilities. During the the other two days a week, dogs received unspecified in-kennel enrichment. The dogs also received a combination of medicines (selected dogs at St. Hubert’s and all dogs at the North Carolina facility). Specifically, a veterinarian prescribed the anti-depressant, Prozac, and the ant-seizure and sedating pain control medicine, Gabapentin. Thus, the dogs received very little rehabilitation.
Each week, the “Outcome Decisions Panel” decided whether dogs lived or died. Specifically, the study stated the following:
If a dog did not show positive behavior change in response to treatment to meet Adoptability Guidelines and/or continued to suffer from a poor quality of life for behavioral reasons, medical problems that arose while the dog was in treatment, or both, the Panel made the decision to humanely euthanize the dog.
In other words, the ASPCA and St. Hubert’s consistently made killing a viable solution.
Killing Sad and Depressed Dogs
The ASPCA and St. Hubert’s death panel used a “Quality of Life Assessment Scale” as one of the two primary criteria for deciding the fates of dogs. Shockingly, the organizations’ instructions explicitly state this life or death tool determines if the dogs are currently experiencing mental anguish and not for predicting whether such mental issues would persist outside of the facility. In other words, the ASPCA and St. Hubert’s could kill a dog who is mentally distressed at their “Behavioral Rehabilitation Center”, but would be fine in a home.
At the BRC, this tool is used to help determine if a dog is experiencing a good quality of life based on actual observations in the dog’s current environments. It is not to be used to predict quality of life in another time or context.
The “Quality of Life Assessment Scale” is a tool designed to kill dogs by claiming the animals are “mentally suffering.” If a dog doesn’t play on their own, with other dogs, toys or people, the dog has a “poor quality” of life. If the dog doesn’t socialize with other living beings, the animal must be “mentally suffering.” Dogs that don’t urine mark, chew, dig or roll around must have a poor quality of life that makes killing the only “humane” option. If a dog makes the wrong decision about a fear inducing stimuli, we must kill the dog to put him or her out of their misery. Dogs that exhibit repetitive behavior or are scared and anxious must be killed due to their “poor quality” of life. As a result, the ASPCA and St. Hubert’s created a pseudo scientific tool to justify killing dogs for absurd reasons.
“Adoptability Guidelines” Designed to Kill Scared Dogs
The ASPCA and St. Hubert’s provided “guidelines” to its death panel to help them determine the fates of dogs. While the organizations state these are “flexible guidelines”, the instructions explicitly state “dogs should exhibit interest/excitement at best and mild to moderate fear at worst in each category” to “graduate from the program.”
The following serve as flexible guidelines, not criteria, to help the Outcome Decisions Panel determine each dog’s outcome. In general, in order to graduate from the program, dogs should exhibit interest/excitement at best and mild to moderate fear at worst in each category.
The “Kennel Presence” standards doom scared dogs who are experiencing kennel stress. The general guidelines require dogs to act nice in their kennels when a person walks by and approaches their kennels:
The dog can tolerate unfamiliar people walking past his or her kennel.
The dog can tolerate an unfamiliar person approaching the front of his or her kennel and pausing for up to 30 seconds to look at the dog.
Additionally, dogs who show barrier reactivity fail the test and presumably are destined for killing:
Lunging and barking, charging the front of the kennel, growling, and showing teeth in the kennel are not acceptable.
In reality, barrier or kennel aggression has no relationship to aggression in the real world. It is shelter specific behavior relating to the stress dogs, especially abused and traumatized ones, experience in an unnatural environment. During my times volunteering at shelters, I knew countless dogs with kennel aggression that were perfectly fine in a normal setting. In fact, Dogs Playing for Life, which is an expert at providing enrichment to shelter dogs, states barrier aggression should not be used to assess a dog’s aggression:
Staff will learn that a dog’s behavior on-leash or in their kennel (such as leash reactivity and barrier reactivity) is not an accurate indicator of a dog’s social skills. A dog that may be labeled aggressive because of kennel behavior may exhibit healthy social skills in play group.
The ASPCA’s and St. Hubert’s “Social Behavior/Interaction with People” guidelines require abused dogs to be social butterflies. Dogs should eat out of a familiar person’s hand and follow them around or greet them. One has to to ask, how many people, let alone those experiencing several emotional trauma, could pass such tests?
The dog can eat from a familiar person’s hand.
The dog can eat in the presence of an unfamiliar person. The unfamiliar person can toss treats on the ground/floor.
The dog exhibits behavior indicating that he or she has developed a social relationship with at least one person. Behavior may be subtle: positioning the body near the familiar person, following the familiar person around a room or pen, wagging at or approaching the person to sniff/greet when he or she enters a room, etc. Demonstrative social behavior is not required (e.g., jumping up on the person, play bowing, licking the person’s face).
In fact, the ASPCA and St. Hubert’s explicitly state dogs who move away from their owner more than 50% of the time or urinate or try to escape exhibit “unacceptable” behavior (i.e. code word for deserve to die).
Mild fear when interacting with a familiar person in other ways is acceptable. However, moving away 50% of the time or more when a familiar person attempts to come into close proximity (within arm’s reach) of the dog is not acceptable unless the dog immediately returns to the person after the initial move away.
Extreme fear is not acceptable (e.g., loss of bladder or bowel control, escape behavior).
The guidance for putting on a dog’s leash sentences many abused animals to death. Dogs have to let both familiar and unfamiliar people put a leash on. If it takes more than 5 seconds to put the dog’s leash on, the dog is doomed.
The dog allows a familiar person to leash and unleash him or her using a slip lead and clip lead in a variety of environments, including the dog’s kennel, a “Real Life Room”, and an outdoor play yard. The use of a drag line to facilitate leashing is acceptable if the dog is in a larger room or outdoor space.
The dog also allows an unfamiliar person to leash and unleash him or her using a slip lead and a clip lead in a variety of environments without the presence of a familiar person or a helper dog.
A person shouldn’t need to use “stealthy,” skillful handling techniques to apply the leash. The dog doesn’t have to stay in one place during the leashing process, but it doesn’t take more than 5 seconds to apply the leash.
If the dog pees, shakes, tries to get away or bites the leash, the dog fails these tests and is destined for killing:
Moderate fear and extreme fear are not acceptable (e.g., loss of bladder or bowel control, escape behavior, violent trembling, catatonia).
Aggression directed toward a person or the leash (snapping or biting at the slip lead during leashing) is unacceptable
The ASPCA’s and St. Hubert’s “Leash Walking” guidance is designed to kill traumatized dogs. If a dog is even the slightest bit reactive, the dog fails. Specifically, the guidance states a “dog can tolerate both a familiar person and an unfamiliar person walking him or her on-leash in the following contexts”:
The dog can walk on-leash past at least one unfamiliar person without a helper dog present.
The dog can walk on-leash in an unfamiliar area without a helper dog present.
The dog can walk up and down stairs, both indoors and outdoors.
The dog can walk through thresholds without balking, panicking, or fleeing.
The dog can walk on-leash in a park-like setting and in a neighborhood with moderate distractions, like occasional passing cars and foot traffic.
In fact, a dog fails and is likely sentenced to death if he or she gets scared for more than a minute by a car or a sudden sound. If the dog panics, chews on the leash or stops walking, the dog fails and the ASPCA and St. Hubert’s will likely kill them.
Mild fear throughout is acceptable. Moderate fear (e.g., startling or stopping when hearing a sudden sound or when a car drives past) is acceptable if the dog recovers, showing a decrease in fearful body language/behavior, within one minute.
Extreme fear is not acceptable (e.g., panic, escape behavior, “gator rolling,” chewing on the leash, becoming completely immobile, and refusing to continue walking).
The “Handling” guidance dooms even dogs who don’t come from abuse cases. Abused dogs must allow strangers to touch them. Furthermore, traumatized dogs have to allow “familiar” people to grab their paws, ears and muzzles and allow those people to give them a bear hug for 10 seconds. If the person has to work to do these things, the dog fails.
The dog tolerates both a familiar person and an unfamiliar person gently handling non-sensitive areas of the dog’s body (chest, shoulders, back, etc.). The dog does not have to appear to actively enjoy or solicit petting.
The dog tolerates a familiar person gently handling sensitive parts of the dog’s body (e.g., paws, ears, muzzle).
Touching the dog shouldn’t require the use of “stealthy,” skilled handling techniques or forced proximity (confining the dog to a small space in order to corner him or her).
The dog tolerates a familiar person gently restraining him or her (picking up the dog or performing a vet hold) for 10 seconds.
The dog doesn’t need to stay completely still when the person attempts to pick up or restrain him or her. However, the handler shouldn’t need to reposition the dog more than one time to accomplish the task.
If the animal shakes, tries to get away or urinates during these trauma-inducing actions, the dog fails and likely faces a death sentence.
Moderate and extreme fear are not acceptable (e.g., loss of bladder or bowel control, escape behavior, violent trembling, catatonia).
If the dog growls or muzzle punches when someone touches a sensitive area, the dog fails and is likely slated for death.
Growling, snapping, muzzle punching, attempting to bite, or biting during gentle, pain-free handling of non-sensitive or sensitive areas is not acceptable.
If a dog resists in anyway when putting on a muzzle for a veterinary appointment or won’t wear the muzzle for more than three minutes, the dog fails and likely faces being poisoned to death by the ASPCA and St. Hubert’s.
If restraint or handling sensitive areas in a veterinary context provoke an aggressive response, the dog can tolerate wearing a muzzle for a minimum of 3 minutes. A familiar person can easily apply the muzzle, and the dog does not panic, paw at the muzzle, or thrash around after it is secured.
The ASPCA and St. Hubert’s even slate dogs who don’t like being in crates for potential death. According to these organizations’ “guidelines”, dogs must go into a crate within 10 seconds or resist being put into a crate for three seconds or less. If a dog barks or whines in their crate for more than a minute during their first 30 minutes in a crate, the animal doesn’t meet these ridiculous guidelines.
The dog can go into an airline or wire crate within 10 seconds. He or she may do so by following a tossed treat, responding to a cue (verbal cue or hand signal), or moving into the crate when gently guided by the collar. If guided by the collar, the dog does not balk or attempt to back up for more than 3 seconds.
The dog can be left alone inside a crate for at least 30 minutes without barking or whining for more than a total of 1 minute at a time. The dog does not paw at the crate, bite at the crate, or attempt to escape from the crate.
The guidance dooms dogs who shake, pant heavily, “excessively” drool” or attempt to escape from their crates. If a dog barks for more than five seconds while in their crate after a person startles them, the animal fails the test. In other words, the ASPCA and St. Hubert’s view these as capital offenses worthy of the death penalty.
Moderate and extreme fear are not acceptable (e.g., trembling, panting heavily, excessively drooling, attempting to escape).
If a person suddenly enters the room and startles the dog, alarm barking alone is acceptable if the dog stops barking within 5 seconds.
The guidelines for how the dogs respond to getting into and riding in cars is deeply disturbing. The ASPCA and St. Hubert’s expect traumatized dogs to allow people to boost them or pick them up to put the animals in cars. Also, dogs must be able to ride in a car restrained by a seat belt, inside a crate or behind a barrier. Apparently, dogs who don’t like to ride in cars are worthy of the death penalty in the ASPCA’s and St. Hubert’s eyes.
The dog can get into a car by jumping up into it, by jumping up partway and then allowing a handler to “boost” him or her into it, or by allowing a handler to pick him or her up.
The dog can ride in a car, restrained by a dog seatbelt, inside a crate or behind a barrier.
Dogs who are scared in cars get no empathy from these kill first organizations. If a dog becomes startled for more than 30 seconds when a loud truck passes or when the car makes a sudden movement, the animal fails the test. If the dog shakes, attempts to escape or bites the leash when getting near or into a car, the dog is deemed unfit. Similarly, if a dog barks for more than five seconds after someone suddenly appears and startles the dog in a car, the dog fails. If a scared dog lunges, barks, growls and shows teeth while being scared in the car, the dog fails. Thus, the ASPCA’s and St. Hubert’s guidance sentences dogs to potential death for the mere crime of being scared to ride in cars.
Moderate fear (e.g., startling when a loud truck passes by or when the car makes sudden movements) is acceptable if the dog recovers (shows an obvious decrease in fearful body language/behavior) within 30 seconds.
Showing extreme fear (trembling, attempting to escape, biting at the leash, etc.) when approaching a car, getting into a car, or riding in a car is not acceptable.
If a person suddenly appears and startles the dog while he or she is in the car, alarm barking alone is acceptable if the dog stops barking within 5 seconds.
Lunging and barking, growling, and showing teeth at any time are not acceptable.
Dogs who are scared of other dogs get no reprieve from the behavior Nazis at the ASPCA and St. Hubert’s. If a dog shakes a lot, urinates, tries to escape or becomes frozen in fear when seeing another dog, the dog fails the test and likely faces a death sentence. Dogs that bark for more than 10 seconds when seeing a dog off-leash fail the test. If the dog is on leash, the dog fails if the handler can’t lead the barking dog away in five seconds or less. Upon greeting another dog, the dog fails the test if the dog growls, barks and shows teeth for more than five seconds. If the scared dog lunges forward and barks and growls at another dog, the dog fails and is slated for death. Even if another dog attacks the scared dog, the dog fails if it defends itself and continues after the aggressor dog backs down. Thus, the ASPCA and St. Hubert’s expect traumatized and abused dogs to be perfect with other dogs or face a death sentence.
Extreme fear is not acceptable (e.g., loss of bladder or bowel control, escape behavior, violent trembling, complete immobility).
Alarm barking alone may be acceptable when the dog sees another dog from a distance (8 feet away or more) or when another dog comes into view, as long as he or she stops vocalizing in under 10 seconds, and, if the dog is on-leash, an average handler can lead him or her in another direction within 5 seconds or less.
Lunging or charging forward toward another dog, along with barking, growling, and/or showing teeth, are not acceptable in any context.
When greeting another dog, growling, barking, showing teeth, and snapping are acceptable as long as these behaviors are brief (under 5 seconds) and inhibited: the dog stays in place or moves away from the other dog. Appropriate “corrections,” such as loudly barking and snapping at another dog that jumps on the dog or persistently solicits play, are acceptable. Biting (causing one or more puncture wounds) is not acceptable.
All aggressive behavior is acceptable if the dog is responding to aggressive behavior initiated by another dog—unless the dog continues to aggress after the aggressor stops (lies down, tries to move or run away, rolls over, yelps, and shows fearful body language, etc.).
Most disturbing, the ASPCA and St. Hubert’s killed dogs with “moderate” fear who improved. According to the ASPCA guidance, these dogs were not “extremely fearful” during the majority of their evaluations, showed brief social behaviors with a familiar person and did not bite or attempt to bite. Specifically, the dogs the ASPCA and St. Hubert’s killed on average improved from having “severe” to “moderate” fear. Thus, the ASPCA and St. Hubert’s killed dogs who progressed and clearly were capable of living their lives without harming anyone.
Program Utilizes Scientifically Invalid Temperament Tests
The ASPCA’s and St. Hubert’s “rehabilitation” program is based off flawed temperament testing. While the tests were more expansive than those in the ASPCA’s SAFER program, many of them are still based on behavior in an unnatural shelter setting. Scientific studies show these tests are inaccurate. In fact, the authors of a 2019 study in the Journal of Veterinary Behavior concluded:
This argues against use of any behavior evaluation to make important decisions for shelter dogs, especially if the behavior(s) of concern were only observed during provocative testing.
In fact, the ASPCA itself wrote a “Position Statement” in 2018 arguing against using its SAFER test in most circumstances:
For these reasons, the ASPCA recommends that, unless aggressive behavior during an assessment is egregious*, shelters should consider it valid only if corroborated in another environment.
*”Egregious” aggression should be defined by the individual shelter, but some defining characteristics could be (a) a bite that requires medical treatment, (b) an injurious bite that the dog could have avoided inflicting but opted to bite rather than retreat, (c) an injurious bite delivered without obvious warning, or (d) an attack in which repeated injurious bites are delivered.
The authors of the Journal of Veterinary Behavior study criticized the ASPCA’s limited use of temperament tests:
However we would argue that even if used in such a fashion, it must still be recognized that the clinical importance of the behavior(s) remains subjective and should not be interpreted as a scientifically validated indicator of future behavior.
Despite this, the ASPCA continued using scientifically invalid temperament tests at its Behavioral Rehabilitation Center even after it wrote its position statement arguing against using such tests. Specifically, the ASPCA published it position opposing temperament tests in 2018 and continued to enroll dogs into its study using such tests through 2020.
ASPCA and St. Hubert’s Hypocrisy
The ASPCA’s killing of more than 60 abused and traumatized dogs contradicts its TV ads about the organization saving abused animals. When one considers the ASPCA and St. Hubert’s deliberately did not accept dogs who displayed serious aggression (i.e. offensive) and those animals with concerning medical issues, these killings become even more disgusting. Simply put, the ASPCA dupes its donors into thinking it is saving abused dogs when it is in fact killing significant numbers of these creatures.
The ASPCA’s killing becomes more abhorrent when we consider the immense wealth this organization has. According to the ASPCA’s most recent year Form 990, it took in $325 million of revenue. At the end of its most recent fiscal year, the ASPCA had $407 million of net assets. The ASPCA’s CEO received $966,004 of total compensation in its most recent reported year. As a result, the ASPCA killed scared and abused dogs after short periods of time while it had massive amounts of money available and paid its CEO exorbitantly.
The ASPCA’s corruption is consistent with a CBS News expose last summer. The news organization found the ASPCA only spent 40% of its money on the animals despite its TV ads portraying that is where the money goes. Additionally, the organization took advantage of the public belief that the ASPCA and local SPCA shelters are the same organization, when they are not, to garner fundraising dollars for itself.
Unfortunately, the ASPCA seeks to kill more dogs who are “mentally suffering” under proposed New York legislation. While vaguely worded, the bill would essentially force shelters to kill mentally or emotionally ill dogs they couldn’t treat. When we couple this with the ASPCA’s and St. Hubert’s pet seizing cost of care bill, we can see shelters seizing innocent pet owners dogs, fundraising off them and then killing them because they couldn’t “treat” them. In other words, these bills would codify the ASPCA’s and St. Hubert’s abhorrent practice of killing scared dogs.
The ASPCA authors of this study stated the following:
This program represents a significant investment of time and expertise; we acknowledge that only well-resourced animal welfare agencies can provide a comparable program for moderately to extremely fearful dogs.
AND
Although the treatment time required was not insubstantial, we hope this report will encourage well-resourced organizations to invest in the recovery of homeless animals who fit this population’s behavioral profile.
Frankly, no organization, wealthy or poor, should implement a “program” that kills more than five dozen scared and abused dogs. Imagine if you were an abused dog in a facility with people looking for ways to kill you? How much fear would you experience when behavior Nazis were provoking you to become more fearful and lash out? People who sought to make you so scared you urinated or defecated on the ground, trembled and became catatonic. Simply put, these are sociopathic actions and no organization who cares about animals should ever replicate them.
Cats are losing their lives at an alarming rate in New Jersey animal shelters. New Jersey animal shelters killed 7,255 cats or 17% of those cats having known outcomes in 2019. Additionally, a number of other cats died or went missing. This blog explores the reasons why this tragedy is occurring and whether we can end the massacre.
Model Assesses New Jersey Animal Shelters’ Life Saving Performance
In order to assess how good of a job New Jersey animal shelters are doing, I’ve developed an analysis I call the “Life Saving Model.” While shelter performance is dependent on many variables, such as finances, facility design, local laws, etc., the most critical factor impacting potential life saving is animal holding capacity. Without having enough physical space and foster homes, a shelter might not have enough time to find loving homes for its animals. Shelters can overcome financial limitations through creative fundraising or recruiting more volunteers. Similarly, organizations can save their cats despite having run down facilities if these groups enthusiastically implement policies to get animals into loving homes quickly. As a result, my analysis focuses on making the best use of space to save the maximum number of New Jersey and nearby areas cats.
The Life Saving Model measures the number of local animals a shelter should adopt out, rescue from other facilities, send to rescues or other shelters and euthanize to achieve no kill level live release rates. The targeted outcomes take into account each facility’s physical capacity plus the amount of foster homes it should use and the number of cats the organization receives from its community (i.e. strays, owner surrenders, cruelty cases, etc.). I assume a target euthanasia rate, take the number of cats actually returned to owners and then estimate how many community cats a shelter should adopt out. To the extent space runs out, I then calculate how many cats must be sent to rescue. If the shelter has excess space after properly serving its local community, the facility uses that room to rescue and adopt out cats from nearby areas. The targeted results calculated from this model are compared to the actual results from each shelter below.
The model expands shelter capacity to include the number of foster homes shelters should use. Based on a target I obtained from Target Zero’s now defunct “Humane Dash” tool, which I confirmed is appropriate with American Pets Alive leadership, shelters should have 7.5% of their annual cat intake in foster homes at any one time. These estimates are based on what several no kill animal control shelters already accomplish. Given fostering increases capacity and provides more humane care to animals, it is critical shelters have large scale foster programs. Therefore, I added 7.5% of each shelter’s annual cat intake to the shelter’s physical capacity.
The Life Saving Model requires a more complex analysis for cats than dogs in New Jersey. Generally speaking, New Jersey animal shelters receive few litters of young puppies who are vulnerable to disease. On the other hand, local shelters receive lots of young kittens, particularly during the April to October kitten season. These young kittens are highly vulnerable to disease and those without mothers require bottle feeding every 1-2 hours. Therefore, animal welfare organizations should not hold these kittens in a traditional shelter setting and instead should send these animals to foster homes or a kitten nursery at or outside of the facility. During the months outside of kitten season (i.e. November-March), my model assumes shelters will be able to place young kittens into their volunteers’ foster homes and/or in a kitten nursery run by the animal shelter. In kitten season with many young animals coming in, I assume a certain percentage of the cat intake will need to go to rescues or other shelters. For shelters who rescue cats, I assume a small percentage of the cats are young kittens who are hopelessly suffering and will require humane euthanasia. Thus, my Life Saving Model is a bit more complicated than the analysis I did for dogs.
To read specific details and assumptions used in the model, please see the Appendix at the end of this blog.
My analysis puts a cap on the targeted numbers of cats rescued from other shelters and adoptions. While my unmodified targeted numbers of rescued and adopted animals is achievable, I wanted to provide very conservative goals for New Jersey animal shelters.
My modified analysis capped cat adoptions at 6.2 cats per 1,000 people within each New Jersey county. In the past I used 8 cats per 1,000 people, but I decided to make the target more lenient this year as more shelters practice shelter/neuter return. In other words, the targeted numbers of cats rescued from other shelters and adopted below are the lesser of
Number predicted by model
Number determined by capping adoptions at 6.2 cats per 1,000 people in the county
In simple terms, a shelter is expected to achieve this per capita adoption rate unless the facility lacks enough space and foster homes. If a shelter does not have sufficient room, it won’t have the time to reach all the potential adopters and requires assistance from rescues and/or other facilities.
My model assumes shelters are doing the proper thing and practicing TNR and placing the reasonable number of feral cats received as barn cats. You can read a more detailed explanation of my rationale in the 2018 cat report cards blog.
New Jersey Animal Shelters Contain Enough Space to Save Most of New Jersey’s Healthy and Treatable Cats and Many More from Other States
New Jersey’s animal shelter system has enough space to save the state’s healthy and treatable cats. The table below details the targeted numbers of cat outcomes the New Jersey animal shelter system should achieve. Out of the 43,592 New Jersey cats coming into the state’s animal shelters in 2019, 27,985 and 8,716 cats should have been adopted out and sent to other shelters/rescues by the facilities originally taking the cats in. However, other New Jersey animal shelters had enough capacity to rescue 25,778 cats or about three times the number of cats needing rescue from space constrained facilities. Unfortunately, some of the cats needing rescue, such as very young kittens, should not stay in a shelter and still must go to either kitten nurseries or foster homes. That being said, many adult cats are in fact killed in New Jersey animal shelters and many facilities with excess space could save these cats.
New Jersey animal shelters have enough excess space and potential foster homes to save many cats from out of state as well. Specifically, New Jersey animal shelters had enough physical capacity to rescue 17,063 cats from out of state shelters or New Jersey’s streets after achieving a 92% live release rate for cats coming into the state’s animal shelters. In reality, the New Jersey shelter system could rescue more than 17,063 cats from out of state shelters or from New Jersey’s streets given the 17,063 figure assumes all cats needing rescue from space constrained New Jersey shelters are sent to other New Jersey shelters as opposed to rescue groups. As explained above, some of the cats needing rescue from New Jersey shelters with a shortage of space are young kittens which should not go to most animal shelters. To put this number into perspective, New Jersey animal shelters contain enough space to make both New York City and Philadelphia no kill cities for cats and increase those cities’ cat live release rates to 92% as follows (per 2019 data):
New York City – 619 additional cats need saving
Philadelphia – 917 additional cats need saving
Certainly, some New Jersey animal shelters do pull some cats from New York City and Philadelphia animal control shelters. While some of the 409 cats New Jersey animal shelters rescued from out of state facilities may have come from New York City and Philadelphia shelters, its likely many came from other states since transporting shelters, such as St. Hubert’s, pulled a sizable number of these cats. Even though some of these cats from New York City and Philadelphia animal control shelters are young kittens, which should not go to a normal animal shelter, many other cats could go to New Jersey animal shelters and be adopted out. As a result, the additional number of cats New Jersey animal shelters could save from New York City and Philadelphia is not much lower than the figures above. Thus, New Jersey animal shelters could make New Jersey a no kill state for cats and help other states reach that goal as well.
These adoption goals are quite achievable when comparing the performance of well-run animal control shelters across the country. New Jersey animal shelters would only need to adopt out 5.9 cats per 1,000 people in the state (4.1 cats per 1,000 people if no cats were rescued from out of state and all cats sent to rescue were rescued by other New Jersey animal shelters and adopted out). As a comparison, recent per capita cat adoption numbers from several high performing no kill open admission shelters are as follows:
Charlottesville-Albemarle SPCA (Charlottesville and Albemarle County, Virginia area) – 11.0 cats per 1,000 people
Longmont Humane Society (Longmont, Colorado area) – 8.9 cats per 1,000 people
Kansas City Pet Project (Kansas City, Missouri) – 7.6 cats per 1,000 people
Lake County Animal Shelter (Lake County, Florida) – 5.9 cats per 1,000 people
Thus, many communities are already adopting out as many or significantly more cats than the number I target for New Jersey animal shelters.
Cat Deaths Vary Widely at New Jersey Animal Shelters
The goal of any properly managed animal shelter is to save all of its healthy and treatable animals. In some cases, such as selective admission rescue oriented shelters, it is pretty easy to not kill animals. In addition, other animal shelters with easy to service animal control contracts (i.e. few animals impounded) can avoid unnecessary killing due to having lots of extra space. As a result, some shelters may have an easier time than others in preventing killing at their shelters.
The tables below detail how many cats should lose their lives at each state animal shelter per my model and the actual numbers of cats that did. All missing or lost cats are assumed “dead” based on the assumption they died or went to a very bad place. Based on my review of a number of shelters’ underlying documents, virtually all of the cats in the “Other” outcome category died or went missing. While a small numbers of shelters could have included some live releases in the “Other” outcome category, it would be misleading to not count these deaths for the overwhelming majority of shelters. The “targeted” numbers in the table are based on the shelter’s actual cat intake rather than targeted cat intake to ensure an apples to apples comparison with the actual cats losing their lives. Shelters having the number of cats losing their lives at or below my targets and above my targets are highlighted in green and red in the tables below.
The overall results show too many cats are unnecessarily losing their lives at New Jersey animal shelters. New Jersey animal shelters had 6,364 cats needlessly lose their lives in 2019 (i.e. the sum of all shelters with too many cats needlessly losing their lives in the table below).
The largest number of cats unnecessarily dying occurred at a relatively small number of shelters. 11 out of 90 or 12% of the shelters accounted for 80% of the cats unnecessarily losing their lives under the model’s assumptions. Most of these shelters had negative stories reported in the press and/or on my blog or Facebook page over the last several years. Shelters with the greatest numbers of unnecessary cat deaths are as follows:
Atlantic County Animal Shelter (936)
Gloucester County Animal Shelter (881)
Burlington County Animal Shelter (773)
Northern Ocean County Animal Facility (561)
Vorhees Animal Orphanage (410)
South Jersey Regional Animal Shelter (390)
Bergen County Animal Shelter (287)
Associated Humane Societies-Newark (255)
Liberty Humane Society (244)
Homeward Bound Pet Adoption Center (189)
Southern Ocean County Animal Facility (176)
Associated Humane Societies-Tinton Falls (161)
Hamilton Township Animal Shelter (144)
Rescue oriented shelters generally had fewer cats lose their lives than targeted. While saving large numbers of cats is what we all want, some of these shelters may have achieved this result by taking in easier cats. Austin Pets Alive, which is a rescue oriented shelter in Texas, has developed some of the most innovative cat programs and only had a cat live release rate of 87% in 2019. This was due to Austin Pets Alive taking in many cats requiring significant treatment, such as neonatal kittens, from the city animal control shelter. As a result, some of the rescue oriented shelters with significantly fewer cats euthanized than targeted may have avoided taking in many of the more difficult cases.
On the bright side, some medium to large size animal control shelters euthanized fewer cats than targeted. Specifically, Cape May County Animal Shelter, Common Sense for Animals, Parsippany Animal Shelter, Paterson Animal Control, Randolph Regional Animal Shelter, St. Hubert’s-Madison, St. Hubert’s-North Branch and West Milford Animal Shelter performed well. Many of these shelters have TNR programs.
Space Constrained Facilities Not Receiving Enough Support from Rescues and Other Animal Shelters
Some animal shelters will require more support from rescues and animal shelters with excess space than others. If a shelter has relatively high intake and very limited space, it will need more help than other shelters. While sending animals to rescues is a good thing, we do want shelters most needing rescue support to receive that help given rescues have limited resources. The tables below compare the number of cats a shelter should transfer to other organizations per the model and the number of cats actually sent to other animal welfare groups. Shelters marked in green are receiving less than the expected rescue support while facilities marked in red are receiving too much rescue help.
Overall, New Jersey shelters are not receiving enough help from other animal welfare organizations. While New Jersey animal shelters sent more cats to rescues and other shelters than my model targeted, many cats were rescued from facilities which did not require so much rescue assistance. Only 41 out of the 69 facilities needing rescue assistance received the required support. In other words, only 59% of the animal shelters needing rescue help received the amount these facilities require.
We truly need to understand the reasons for this rescue shortfall. While poor data collection (i.e. shelters classifying rescues as adoptions) may explain part of this rescue deficit, the large size of this number points to other causes as well. For example, New Jersey shelters as a whole significantly exceeded their dog rescue needs and a much smaller number of shelters failed to receive enough rescue support, but just 59% of shelters needing cat rescue assistance received the needed support. Certainly, some of these cats are feral and not candidates for most rescues. However, many other cats surely are home-able. Many high kill facilities may not reach out to rescues for cats, such as during kitten season, as much as they do for dogs. This data supports the need for New Jersey to pass shelter reform bill S1834 which requires shelters to contact rescues and other facilities at least two business days before killing animals. On the other hand, shelters with excess capacity may not be doing their part to save cats from space constrained facilities.
Several shelters received too much rescue help. Rescues may want to help these organizations due to rescue friendly policies. Alternatively, these shelters may be relying too heavily on rescues to save their animals. Shelters receiving the most extra rescue support were as follows:
Associated Humane Societies-Newark – 710 more cats transferred than necessary
Gloucester County Animal Shelter – 571 more cats transferred than necessary
Paterson Animal Control – 325 more cats transferred than necessary
Trenton Animal Shelter – 269 more cats transferred than necessary
Elizabeth Animal Shelter – 165 more cats transferred than necessary
Woodbridge Animal Shelter – 160 more cats transferred than necessary
Associated Humane Societies-Tinton Falls – 157 more cats transferred than necessary
Byram Township Animal Shelter – 144 more cats transferred than necessary
Northern Ocean County Animal Facility – 131 more cats transferred than necessary
On the other hand, many space constrained shelters received far less rescue help than needed. Facilities receiving the lowest amount of rescue support in relation to their needs were as follows:
Homeward Bound Pet Adoption Center – 695 fewer cats transferred than necessary
Vorhees Animal Orphanage – 503 fewer cats transferred than necessary
Monmouth SPCA – 222 fewer cats transferred than necessary
Atlantic County Animal Shelter – 215 fewer cats transferred than necessary
South Jersey Regional Animal Shelter – 187 fewer cats transferred than necessary
St. Hubert’s-Madison – 180 fewer cats transferred than necessary
Liberty Humane Society – 78 fewer cats transferred than necessary
Parsippany Animal Shelter – 75 fewer cats transferred than necessary
SAVE, A Friend to Homeless Animals – 41 fewer cats transferred than necessary
Franklin Township Animal Shelter – 37 fewer cats transferred than necessary
The million dollar question is why do these shelters receive very little rescue help? Some shelters may report no cats sent to rescues and incorrectly count these animals as adopted. As you will see below, Homeward Bound Pet Adoption Center, Vorhees Animal Orphanage, St. Hubert’s-Madison and Parsippany Animal Shelter adopted out many cats and are doing a pretty good job. On the other hand, Franklin Township Animal Shelter killed many cats for absurd reasons, broke state law and does not do a good job of reaching out to the public for help. Similarly, local advocates have long complained about regressive shelter management at Atlantic County Animal Shelter and South Jersey Regional Animal Shelter. As a result, shelters receiving too little rescue help may or may not be doing their part to get that assistance.
Rescue groups and shelters with extra space should pull cats from kill shelters with the highest rescue “target” numbers and deficits in the tables below. If shelters not needing rescue support get that extra help, these shelters will not take the steps necessary to properly run their facilities. As a result of enabling poorly performing shelters and not pulling cats from truly space constrained facilities, rescuing cats from shelters with enough space leads to less lifesaving.
Shelters receiving less than needed rescue support should also examine their own policies and performance. Are the shelter’s operating processes allowing too many animals to get sick and therefore discouraging organizations to rescue their animals due to subsequent medical costs? Does the shelter actively reach out to rescues/other shelters and treat them with respect? Does the shelter make it convenient for other organizations to pull their animals?
Given killing animals for space is intolerable, the space-constrained shelters need to expand their effective cat capacity. These facilities could use extra space in their buildings to house cats on a short-term basis. These shelters can enter into arrangements with local veterinarians and local pet stores to house and adopt out some cats. Furthermore, shelters can create or expand foster programs to increase the number of cats cared for. Additionally, creating a pet owner surrender prevention program and an appointment system for owners willing to delay surrendering their cats could free up space in these shelters. Finally, space-constrained shelters with multiple animal control contracts should terminate some of these arrangements to bring their capacity for care in line with the number of cats they take in. Similarly, many shelters can use their bargaining power to require municipalities to allow TNR. As a result, space constrained shelters still need to take active steps to reduce killing rather than simply solely relying on rescue support.
Most New Jersey Animal Shelters Fail to Come Close to Reaching Their Cat Adoption Potential
We can assess each shelter’s contribution to making New Jersey and nearby areas no kill. While a shelter may be able to avoid killing healthy and treatable animals, it still may not live up to its potential for adopting out cats. On the other hand, a space constrained shelter may kill healthy and treatable cats, but still do a good job adopting animals out.
The tables below compare the number of cats from New Jersey and nearby states each animal shelter should adopt out with the number of cats actually adopted out.
Rescue oriented organizations may look better than they actually are. Many rescue oriented shelters likely pull much easier to adopt cats than the bulk of cats needing to get rescued from local facilities.
Few organizations reached or exceeded their adoption targets. Specifically, only 12 out of 90 shelters met the cat adoption goals computed by the Life Saving Model. Thus, the overwhelming number of New Jersey animal shelters need to step up their adoption efforts.
Several rescue oriented shelters reached their adoption targets. Animal Welfare Association exceeded its adoption target by the most of any shelter in terms of total adoptions. This shelter runs reduced and no adoption fee promotions. Animal Welfare Association also waives fees for certain cats who may take longer to adopt out, such as cats who are older or have behavior or health issues. Furthermore, the shelter’s “Best Friends” program allows people who adopt a cat to pay just $25 for a second cat who is 1 year or older. Animal Welfare Association also waives cat adoption fees for active military personnel and veterans in its Pets for Vets program. The shelter also waives adoption fees for senior citizens adopting certain senior pets. Additionally, Animal Welfare Association uses an open adoption process focused on properly matching animals and people rather than an overly judgmental procedure based on black and white rules. To aid its open adoptions process, Animal Welfare Association uses the ASPCA’s Feline-ality program. Animal Welfare Association’s adoption rate increased by 20% and its cat length of stay decreased by 23 days after the shelter implemented the Feline-ality program. Finally, Animal Welfare Association installed perches in their cat enclosures to provide cats more vertical space which keeps the cats happier and more adoptable. Beacon Animal Rescue also exceeded its adoption target and charges a reasonable $75 fee for adult cats and offers military personnel and veterans discounted adoption fees. While Mt. Pleasant Animal Shelter and Tri-Boro Animal Welfare also exceeded their adoption targets, this is likely due to my model’s adoption target cap mechanism in Morris County (see explanation below). Overall, Mt. Pleasant Animal Shelter’s cat adoptions decreased 35% from its 2018 levels likely due to well documented problems at the shelter. Thus, several rescue oriented shelters exceeded their cat adoption targets and Animal Welfare Association used a variety of innovative strategies to adopt out many cats.
Several Morris County shelters exceeded their adoption targets, but this may partially be due to my method of capping adoptions in the county. Since Morris County has many shelters that collectively have a very large capacity (i.e. very high adoption potential), my model reduces all Morris County animal shelters’ target adoptions to my county adoption cap. Thus, some of the shelters, particularly the small ones, had relatively low adoption targets.
Rescues should focus on pulling animals from Homeward Bound Pet Adoption Center and Vorhees Animal Orphanage. These shelters’ cat kill rates are too high and their need for rescues greatly exceeds the amount of animals actually pulled from these organizations. While some of these cats may be feral and therefore not adoptable, many other cats surely could be rescued from these shelters. Given these shelters are adopting cats out at a good rate, rescues and other other shelters should help these facilities out by pulling more cats.
Some municipal animal control shelters may be doing a better job with cats than the numbers below indicate. In some cases, municipalities may frown on government run shelters using taxpayer funds to rescue cats from elsewhere (i.e. leaving empty cat cages). My suggestion to these shelters is to find ways to use more of their capacity to expand their lifesaving work to other areas. For example, these shelters should consider taking in animals from other shelters for a fee or even contracting with other municipalities.
Shelters having the largest cat adoption shortfalls are as follows:
Associated Humane Societies-Newark (2,741)
Bergen County Animal Shelter (2,478)
Gloucester County Animal Shelter (1,567)
Plainfield Area Humane Society (1,310)
Woodbridge Animal Shelter (974)
Liberty Humane Society (969)
Monmouth SPCA (904)
Associated Humane Societies-Tinton Falls (892)
Burlington County Animal Shelter (872)
Montclair Township Animal Shelter (808)
Associated Humane Societies-Popcorn Park (768)
Atlantic County Animal Shelter (759)
Northern Ocean County Animal Facility (728)
Old Bridge Animal Shelter (716)
Hamilton Township Animal Shelter (600)
Unsurprisingly, every one of these shelters with the highest adoption shortfalls killed too many cats. Clearly, these shelters’ inability to properly implement strong adoption programs leads to unnecessary cat killing.
Associated Humane Societies performance is particularly disappointing. Specifically, Associated Humane Societies has the physical capacity to significantly reduce the killing of healthy and treatable cats. Associated Humane Societies’ adoption shortfall of 4,401 cats represented nearly 70% of the 6,364 cats who unnecessarily lost their lives in New Jersey animal shelters in 2019. Associated Humane Societies has the funding to reach these adoption targets as the organization took in $9.0 million of revenue for the fiscal year ending 6/30/19. This works out to $863 of revenue per dog and cat I project the shelter should take in per my Life Saving Model. As a comparison, Florida’s Lake County Animal Shelter exceeded the Life Saving Model’s dog adoption target and met its cat adoption target with just $430 of revenue per dog and cat. Given many no kill animal control shelters like Lake County Animal Shelter take in significantly less revenue per dog and cat impounded, Associated Humane Societies could achieve these adoption targets and end the killing of healthy and treatable cats in its facilities and in many of the state’s shelters. Activists wanting to increase life saving in New Jersey should focus on changing Associated Humane Societies’ policies given the lifesaving potential of this organization and its recent dismal performance.
Shelters Fail to Use Excess Space to Save Cats
To further examine New Jersey animal shelters’ performance in saving homeless cats, I compared the targeted number of cats each shelter should pull from nearby shelters to the number actually rescued from local facilities. I assume all cats rescued from out of state came from nearby areas, such as Philadelphia and New York City. While some of the out of state rescued cats may have comes from far away areas, I believe this is a small number and does not significantly impact the results.
Virtually all New Jersey animal shelters are failing to rescue the number of cats they should. 78 of the 90 shelters should rescue some cats from other local shelters. In fact, 36 of the 78 shelters with targeted excess capacity failed to rescue even a single cat from other animal shelters. Only two shelters with significant amounts of space to rescue cats from nearby shelters met or exceeded their cat rescue targets. Thus, nearly all New Jersey animal shelters with targeted excess capacity are failing to do their share in ending the killing of healthy and treatable cats.
TNR Is Essential, But Should Not Be An Excuse to Do Nothing
TNR must be instituted to end the killing of healthy and treatable cats. While many shelters may potentially come close to or reach a 90% live release rate, feral cats may still be killed. Simply put, New Jersey cannot become a no kill state without TNR becoming the law of the land. The Companion Animal Protection Act (“CAPA”) prevents shelters and municipalities from taking actions to hinder TNR, such as banning feral cat colony caretakers from feeding cats and lending traps out to the public for catching and killing feral cats. Even without an explicit law allowing TNR, the New Jersey Department of Health should encourage municipalities to implement TNR by changing its neutral stance on TNR to an endorsement of the practice. Furthermore, shelters, especially private facilities with animal control contracts, should refuse to take feral cats from places where TNR is prohibited and the shelters cannot place these feral cats as barn cats or send these animals to reputable sanctuaries per recommendations of many national animal welfare groups.
Shelters should not use anti-feral cat laws as an excuse for failing to institute innovative programs. Too many times shelters blame anti-feral cat ordinances for their outrageously high cat kill rates. However, my analysis proves cats are not dying in New Jersey’s shelter system due to too many cats coming in. While TNR certainly would reduce cat intake and make saving lives easier, our state’s shelter system has more than enough space to handle the number of cats that come in. Shelters need to implement key programs, such as foster care, high volume adoptions and vaccination upon intake. Additionally, shelters need to stay open weeknights and weekends when working people can adopt. Similarly, shelters should use innovative marketing, customer friendly open adoption processes, multiple off-site adoption locations, and frequent discounted adoption promotions to quickly move cats into good homes. Furthermore, implementing a program where fearful and aggressive cats are touched gently and spoken to softly likely will significantly reduce the number of cats labeled as “feral” and increase adoptions. Thus, anti-TNR ordinances do not prevent shelters from implementing other life saving policies.
Shelters Do Not Need to Leave Friendly Cats on the Street
Shelters do not need to neuter and release friendly cats or refuse to take these cats in given enough capacity exists within the New Jersey shelter system. In 2013, a group of animal welfare leaders, which included the Humane Society of the United States (“HSUS”) and the ASPCA, prepared a white paper stating a shelter should not impound cats if those cats or other cats in the shelter would subsequently be killed. The evidence supporting this policy, such as cats being more likely to find homes on the street than in traditional shelters, is quite strong. Subsequently, many shelters across the nation implemented these policies. However, my analysis shows the entire New Jersey shelter system does have enough space to handle friendly cats. While certain shelters are space constrained and could benefit from refusing to admit healthy and friendly cats, other shelters in the state have more than enough capacity to step in and find these cats homes. Thus, New Jersey shelters do not need to resort to refusing to take in friendly cats or neutering and releasing friendly cats to avoid killing cats provided these shelters work together and follow best practices.
Kitten Nurseries and Ringworm Wards Key to Saving Vulnerable Cats
Orphaned kittens are typically automatically killed in traditional animal shelters due to the time commitment required to care for these animals. Unweaned kittens require bottle feeding as frequently as every 1-2 hours. As a result, kittens not placed into foster care are typically killed in most animal shelters.
Kitten nurseries or bottle baby wards radically increase the save rate for orphaned kittens still requiring milk. While foster care and rescue programs can save unweaned kittens, kitten nurseries are more efficient and make the job easier. Austin Animal Services, which is the animal control shelter in Austin, Texas, killed 1,200 plus kittens a year before Austin Pets Alive created a bottle baby program. Volunteers work in two hour shifts to feed and care for the kittens. Additionally, nursing mothers are pulled from the city shelter and used to help nurse highly vulnerable young kittens who are orphaned. Kittens are put on antibiotics and treated for fleas and worms immediately to help prevent complications from transitioning from breast milk to formula. Austin Pets Alive pulled 100% of unweaned kittens from the city shelter since 2011. Best Friends created a kitten nursery in South Salt Lake City, Utah and saved more than 1,400 kittens from Salt Lake City area shelters in 2016. Thus, kitten nursery programs can save young and vulnerable kittens.
Ringworm ward programs easily save cats with this skin fungus. In traditional animal shelters, cats with ringworm are killed due to the risk that other animals and humans will catch this skin fungus. Austin Pets Alive created a specific “Ringworm Ward” program to treat and adopt out these cats. These cats are treated both topically and orally in an isolated area. After the cats are no longer contagious, the cats are sent to foster homes to complete their treatment and regrow their hair. Austin Pets Alive uses steeply discounted adoption fees of only $15 along with catchy slogans like “Adopt a Fun Guy (Fungi)”, “Lord of the Ringworm”, and “Hairy(less) Potter” to quickly place these cats and open up space for additional cats with ringworm. 100% of cats entering this program are saved. Thus, shelters can save cats with ringworm.
Regional kitten nurseries and ringworm wards are the practical solution to saving these vulnerable cats. Given the New Jersey shelter system has significant excess capacity to care for cats, certain shelters should convert some of that excess space for use as kitten nurseries and ringworm wards. Creating regional centers to care for unweaned kittens and cats with ringworm would allow the programs to run at a large enough scale to work efficiently. Shelters, such as Animal Welfare Association, Associated Humane Societies-Popcorn Park and Monmouth SPCA appear to have the space and financial resources to implement these programs and should join St. Hubert’s-Madison in this effort. Furthermore, the Animal Welfare Federation of New Jersey (“AWFNJ”) should take the steps needed to create kitten nurseries and ringworm wards in regional centers throughout the state. Surely, the AWFNJ has the connections to convince key decision makers to implement these programs and obtain any necessary funding. Thus, New Jersey shelter leaders must immediately take the steps needed to save the large numbers of treatable kittens and cats with ringworm in our state’s shelters.
Results Require New Jersey Animal Shelters to Take Action
The findings from this analysis mandate New Jersey animal shelters change their ways. While TNR remains a significant issue, most shelters are clearly not taking steps to save large numbers of healthy and treatable cats. Many shelters are not vaccinating upon intake, charging excessive adoption fees, making it too difficult to adopt, not being open when working people can go to shelters, leaving cat enclosures empty, not trying to rehabilitate fearful and aggressive cats and not using barn cat, foster care, kitten nursery and ringworm ward programs. Simply put, too many shelters are not doing what it takes to save lives. With New Jersey’s shelters killing around one in six cats, our state’s shelters are failing these animals.
New Jersey shelters have a cat crisis and it is time for the killing to stop. We have the information and even the blueprints from numerous communities which stopped killing and started saving their cats. It is time the excuses end and action begins. The public is fed up with the killing and demands shelters save their animals. Our state’s animal welfare organizations need to get on board the lifesaving wagon or risk getting run over by it. Which will they choose?
Daily capacity or population = Daily animal intake x average length of stay
Average length of stay = Daily capacity or population/daily intake
Each shelter’s community cat intake (i.e. owner surrenders, strays, cruelty cases), number of cats returned to owners, and maximum cat capacity were taken from its 2019 “Shelter/Pound Annual Report” submitted to the New Jersey Department of Health. Additionally, I added 7.5% of each shelter’s annual cat intake to account for foster capacity shelters should use based on my discussions with American Pets Alive leadership. Thus, total cat capacity equaled the shelter’s capacity plus foster capacity. You can see the full data set I compiled from these reports here.
Community cat intake and cats returned to owners were initially estimated for each month by dividing the annual figures by 12. In order to take into account the extra space in low intake months and reduced space in high intake months, we multiply that number by each month’s percentage of the average month. For example, assume 240 cats were taken in during the year and the average month equals 20 cats (240/12). In July, the cat intake is 120% higher than the average month and we therefore multiply 20 cats by 1.2 to equal 24 cats. If 120 cats were returned to owners during the year, the estimated number of cats returned to owners in July would equal 12 cats (120/12 = 10; 10*1.2). The monthly intake percentages were based off the average of the 2019 cat intake data on New York Animal Care & Control’s and ACCT Philly’s web sites.
The estimated number of community cats returned to owners each month are then assumed to stay 5 days on average at shelters based on data from other shelters across the country.
The number of community cats euthanized (including animals who died or are missing) is set to equal 8% of intake. 8% is a reasonable standard euthanasia rate to use given other open admission animal shelters, such as Austin Animal Services, equal or exceed this target and New Jersey’s much lower per capita cat intake makes it easier to save lives. The average length of stay for euthanized cats is assumed to equal 8 days. I assume these cats have severe and untreatable health issues and are euthanized immediately after their required 7 day hold period.
The average length of stay used for adopted community cats was 42 days. This estimate was roughly halfway between the average cat length of stay figures for a number of no kill animal control shelters. For example, the average length of stay for cats in recent years was 12 days at Texas’s Williamson County Animal Shelter, less than two weeks at Nevada Humane Society 15 days at Montana’s Flathead County Animal Shelter, 24 days at Colorado’s Longmont Humane Society, 32 days at Kansas City Pet Project and 61 days for adopted cats only at New York’s Tompkins County SPCA. While the average length of stay of adopted cats at these shelters other than Tompkins County SPCA may have been slightly higher since this data is for all cats and not just those adopted, the difference is not likely significant given adoptions represent most of the outcomes at these shelters. Unfortunately, I was not able to break down the adoption length of stay figures by age or breed for New Jersey’s shelters like I did in my analysis on dogs due to a lack of detailed cat intake data at New Jersey animal shelters. Upon reviewing cats up for adoption at several New Jersey animal control shelters and a few of the high performing facilities above, I did not see any significant differences in types of cats taken in. In the future, I hope to refine this analysis further.
The average length of stay used for community cats adopted out from rescue oriented shelters was 30 days. Rescue oriented animal shelters typically carefully select animals taken into their shelters. Based on the San Francisco’s SPCA’s 22 day and Tony La Russa’s Animal Rescue Foundation’s 23 day average length of stay figures reported a number of years ago, I used a shorter length of stay for community cats adopted from New Jersey animal shelters without animal control contracts. I chose 30 days as a conservative estimate.
Cats transferred to rescue or other facilities are assumed to stay at shelters 8 days on average based on the assumption strays can’t be released until the 7 day hold period elapses.
Community cats not returned to owners or euthanized are initially assumed as adopted for each month outside of kitten season (i.e. November-March). However, if the calculated length of stay exceeds the shelter’s required length of stay, cats are moved from adoption (i.e. with a longer length of stay) to rescue (i.e. shorter length of stay) until the calculated length of stay each month approximately equals the required length of stay.
During kitten season (April-October), animal control shelters are assumed to send a certain percentage of cats to rescues even if they have excess space. Due to the large numbers of kittens coming into shelters during these months, I assume shelters will not be able to place all of them into foster homes or a kitten nursery at this time. As a result, I assume animal control shelters will send 10% of their annual community cat intake to rescues based on the shelters’ estimated relative cat intake each month. For example, if a shelter took 100 cats in during the year and August made up 50% of the total cat intake from April to November, 5 cats would go to rescue in August (i.e. 100*10% = 10 cats; 10*50% = 5 cats). I used 10% based off the rescue percentage of cat intake in 2014 (it was only 2% in 2018) at Kansas City’s KC Pet Project. KC Pet Project is a no kill open admission shelter with an inadequate facility and is a good comparison for some of our state’s run down shelters. Shelters requiring rescue support due to space constraints are assumed to send these additional cats to rescues during kitten season.
Shelters are not expected to use the excess space created by fosters taking kittens to rescue and adopt out additional cats. This is based on the assumption that the kittens will return to shelters once old enough to safely stay at the facilities.
Required length of stay = Shelter’s reported capacity/adjusted daily intake for the month. Adjusted daily intake for month = Adjusted monthly intake per first bullet above/the number of days in the month.
Shelters with excess capacity are assumed to use the extra space to rescue and adopt out cats from other New Jersey animal shelters. Given some of these cats will be young and highly vulnerable kittens, I assume 5% of these rescues will be euthanized for humane reasons. I used 5% based off Austin Pets Alive’s and Austin Humane Society’s weighted average cat euthanasia rate in 2014. These two shelters pull many cats from Austin Animal Services, which is the city’s animal control shelter, and their cat euthanasia rate is a reasonable proxy for the percentage of hopelessly suffering cats rescued from animal control shelters. To the extent all healthy and treatable New Jersey animal shelter cats are saved, I assume additional cats are pulled from nearby states. The average length of stay for rescued and adopted cats is the same as the cats taken in by animal control shelters (i.e. 42 days). Similarly, I used 8 days as the average length of stay for rescued and euthanized cats from other shelters.
Each month’s targeted outcomes are added to determine how many cats New Jersey animal shelters should adopt out, send to rescue and rescue from other nearby animal shelters.
Space constrained shelters were assumed to adopt out their easiest to adopt animals first until they run out of space. To estimate the average adoption length of stay, I used cat adoption length of stay data from Perth Amboy Animal Shelter from 2014 and the first half of 2015. I broke the adoption length of stay data into 5 groups that each made up 20% of the data. The average adoption length of stay for each of these 5 groups was calculated. The average adoption length of stay of each group was divided by the average length of stay for all of the adopted cats in the Perth Amboy Animal Shelter data set. Those percentages were then multiplied by the average cat adoption length of stay determined in the model above and used to determine the adoption lengths of stay used for space-constrained shelters.
The targeted number of cats adopted were capped at 6.2 cats per 1,000 people in each county. If the model yielded a higher result than this cap, the targeted numbers of cats adopted were equal to this cap. For shelters in these counties (except Passaic County), I calculated the cap at the county level and then reduced the number of cats adopted for the county to equal the cap. I excluded West Milford from Passaic County due the town’s large distance from the population centers in the rest of the county. Each shelter’s percentage of total targeted adoptions in the county from the unmodified model were applied to the the total reduction in the number of cats adopted in the county to yield the targeted numbers of cats adopted in the modified model. Rescued and euthanized cats for these shelters were reduced based on the modified model’s assumption that shelters adopted out and euthanized 95% and 5% of rescued cats.
In a blog from earlier this year, I disclosed New Jersey’s depressing animal shelter statistics. This blog explains why so many dogs are losing their lives in the state’s animal shelters and whether these facilities can end the killing.
Successful organizations set measurable goals and regularly monitor their performance. Examples include financial budgets, customer and employee satisfaction surveys, and product reliability metrics. Unfortunately, many animal shelters for far too long have failed to set lifesaving goals and standards. Municipalities, donors and volunteers need to know where their resources will be best utilized. Time and money are scarce resources and people should allocate these assets to organizations who will best utilize them. As a result, animal shelters need to set goals and hold their leadership and staff accountable for achieving these objectives.
Model Assesses New Jersey Animal Shelters’ Life Saving Performance
In order to assess how good of a job New Jersey animal shelters are doing, I’ve developed an analysis I call the “Life Saving Model.” While shelter performance is dependent on many variables, such as finances, facility design, local laws, etc., the most critical factor impacting potential life saving is animal holding capacity. Without having enough physical space and foster homes, a shelter might not have enough time to find loving homes for its animals. Shelters can overcome financial limitations through creative fundraising or recruiting more volunteers. Similarly, organizations can save their dogs despite having run down facilities if these groups enthusiastically implement policies to get animals into loving homes quickly. As a result, my analysis focuses on making the best use of space to save the maximum number of New Jersey and nearby states dogs.
The Life Saving Model measures the number of local animals a shelter should adopt out, rescue from other facilities, send to rescues or other shelters, and euthanize. The targeted outcomes take into account each facility’s physical capacity plus the amount of foster homes it should use and the number and types of dogs the organization receives from its community (i.e. strays, owner surrenders, cruelty/bite cases). I assume a target euthanasia rate, take the number of dogs actually returned to owners and then estimate how many community dogs a shelter should adopt out. To the extent space runs out, I then calculate how many dogs the shelter must send to rescues. If the shelter has excess space after properly serving its local community, the facility uses that room to rescue and adopt out dogs from nearby areas. The targeted results calculated from this model are compared to the actual or estimated actual results from each shelter below.
The model expands facility capacity to include the number of foster homes shelters should use. Based on a target American Pets Alive and other progressive shelter directors communicated at the 2019 American Pets Alive Conference, shelters should have 3% of their annual dog intake in foster homes at any one time. These estimates are based on what several no kill animal control shelters already accomplish. Given fostering increases capacity and provides more humane care to animals, it is critical shelters have large scale foster programs. Therefore, I added 3% of each shelter’s annual dog intake to the shelter’s physical capacity.
For shelters with animal control contracts, I place 10% of all dogs that are not reclaimed by owners into the targeted sent to rescue category. Austin Pets Alive used data from Austin Animal Center, which is the local municipal shelter, to determine large dogs with behavioral challenges are part of the last 10% of animals losing their lives. While shelters can save most of these dogs through behavioral rehabilitation and/or foster programs, I decided to put an estimate of these dogs into the sent to rescue category since that is another good outcome for these dogs.
This year I modified the model to have shelters euthanize 1% of the dogs rescued from other shelters. While I believe my model in prior years accurately reflected the New Jersey animal shelter system as a whole, the model’s euthanized dog targets for shelters who primarily rescue animals from other shelters may have been a bit too strict.
My analysis caps pit bull adoptions at 2 pit bulls per 1,000 people within each New Jersey county. In other words, the targeted numbers of dogs rescued from other shelters and adopted below are the lesser of
Number predicted by model
Number determined by capping pit bull adoptions at 2 pit bulls per 1,000 people in the county
In simple terms, a shelter is expected to achieve this per capita adoption rate unless the facility lacks enough space. If a shelter does not have sufficient room, it won’t have the time to reach all the potential adopters and requires assistance from rescues and/or other facilities. Given my model assumes 80% of rescued dogs are pit bull like dogs, my targeted numbers of dogs rescued and adopted are quite low as detailed in the section below. For example, shelters in counties where dog adoptions are capped have extra space that they do not use to adopt out other dog breeds.
To read specific details and assumptions used in the model, please see the Appendix at the end of this blog.
New Jersey Animal Shelters Contain Enough Space to Save All of New Jersey’s Dogs and Many More from Other States
New Jersey’s animal shelter system has enough space to save all of the state’s healthy and treatable dogs. The table below details the targeted numbers of dog outcomes the New Jersey animal shelter system should achieve. Out of the 20,531 New Jersey dogs coming into the state’s animal shelters in 2019, 9,834 and 1,092 dogs should have been adopted out and sent to other shelters/rescues by the facilities originally taking the dogs in. However, other New Jersey animal shelters had more than enough capacity to rescue the 1,092 dogs from space constrained facilities. Thus, New Jersey animal shelters should be able to able to adopt out every single healthy and treatable dog taken in from the state and not require any support from rescue organizations without physical facilities from a space perspective.
New Jersey animal shelters have enough excess space to save many dogs from out of state as well. Specifically, New Jersey animal shelters had enough physical capacity to rescue at least 12,429 dogs from out of state after achieving a 95% live release rate for New Jersey dogs. To put this number into perspective, New Jersey animal shelters could make both New York City and Philadelphia no kill cities for dogs and increase those cities’ dog live release rates to 95% in 2019 as follows:
New York City – 1,047 additional dogs need saving
Philadelphia – 417 additional dogs need saving
Additionally, New Jersey animal shelters could pull at least another 10,965 dogs from other locations outside of the state. Of course, some New Jersey animal shelters do pull some dogs from New York City and Philadelphia animal control shelters. However, most of these dogs are likely easy to adopt and therefore have short lengths of stay. As a result, the additional number of dogs New Jersey animal shelters could save from New York City, Philadelphia and elsewhere is probably not much lower than the figures above. Thus, New Jersey animal shelters could make New Jersey a no kill state for dogs as well as many other places.
These adoption goals are quite achievable when comparing the performance of well-run animal control shelters across the country. New Jersey animal shelters would only need to adopt out 2.6 dogs per 1,000 people in the state (1.2 dogs if no dogs rescued from out of state). As a comparison, recent per capita dog adoption numbers from several high performing no kill open admission shelters are as follows:
Lynchburg Humane Society (Lynchburg, Virginia) – 14.3 dogs per 1,000 people
Longmont Humane Society (Longmont, Colorado area) – 9.0 dogs per 1,000 people
Lake County Animal Shelter (Lake County, Florida) – 4.6 dogs per 1,000 people
Williamson County Animal Shelter (Williamson County, Texas) – 4.6 dogs per 1,000 people
Thus, many communities are already adopting out around two to six times as many dogs as the goal set for New Jersey animal shelters.
Some naysayers may claim New Jersey would have a more difficult time due to the state’s shelters taking in many pit bulls. However, this is a myth. My model estimates New Jersey animal shelters would need to adopt out roughly 0.4 pit bulls per 1,000 people to save 95% of New Jersey’s dogs. Our shelters would only need to adopt out around 1.5 pit bulls per 1,000 people if New Jersey shelters also rescued and adopted out the targeted number of pit bulls from other states. As a comparison, Florida’s Lake County Animal Shelter adopted out 1.32 pit bulls per 1,000 people in 2019. However, the shelter director believes the number is actually higher since the facility adopts out a good number of pit bull like dogs without a pit bull label. Furthermore, the pit bull adoption targets are even more reasonable given the model assumes there are roughly 1/3 of the number of dogs from other breeds to compete with in the New Jersey adoption market compared to Lake County, Florida.
Animal Deaths Vary Widely at New Jersey Animal Shelters
The goal of any properly managed animal shelter is to save all of its healthy and treatable animals. In some cases, such as selective admission rescue oriented shelters, it is pretty easy to not kill animals. In addition, other animal shelters with easy to service animal control contracts (i.e. few animals impounded, most strays quickly returned to owners) can avoid unnecessary killing due to having lots of extra space. As a result, some shelters may have an easier time than others in preventing killing at their shelters.
The tables below detail how many dogs should lose their lives at each state animal shelter per my model and the actual numbers of dogs that did. The model’s targets have shelters euthanizing 5% of community dogs (strays, owner surrenders, cruelty/bite cases, etc.) and 1% of dogs rescued from other shelters. All missing or lost dogs are assumed “dead” based on the assumption they died or went to a very bad place. Based on my review of a number of shelters’ underlying documents, virtually all of the dogs in the “Other” outcome category died or went missing. Shelters having the number of dogs losing their lives at or below my targets and above my targets are highlighted in green and red in the tables below.
The largest number of dogs unnecessarily dying occurred at a relatively small number of shelters. Overall, 880 dogs needlessly lost their lives at New Jersey animal shelters in 2019 (i.e. the sum of all shelters killing too many dogs). 13 out of 92 or 14% of the shelters accounted for 81% of the dogs unnecessarily losing their lives under the model’s assumptions. Associated Humane Societies’ three shelters needlessly killed 87 dogs per the model or 10% of the total dogs unnecessarily dying in the state’s shelters. Trenton Animal Shelter, Gloucester County Animal Shelter, Bergen County Animal Shelter and Paterson Animal Control, which all broke state law in recent years, needlessly killed 177 dogs per the model or 20% of the total dogs unnecessarily dying in the state’s shelters. Shelters with the greatest number of unnecessary dog deaths are as follows:
St. Hubert’s – Madison (104)
Gloucester County Animal Shelter (90)
Associated Humane Societies – Newark (69)
Toms River Animal Facility (62)
Atlantic County Animal Shelter (58)
Bergen County Animal Shelter (56)
Trenton Animal Shelter (51)
Humane Society of Atlantic County (48)
Homeward Bound Pet Adoption Center (41)
Liberty Humane Society (40)
Burlington County Animal Shelter (34)
Paterson Animal Control (31)
South Jersey Regional Animal Shelter (25)
Thus, the bulk of the dogs unnecessarily dying at New Jersey animals shelters occurs at a small number of facilities.
Most New Jersey Animal Shelters Require Little Rescue Assistance
Some animal shelters will require more support from rescues and animal shelters with excess space than others. If a shelter has relatively high intake, very limited space, and few stray dogs returned to owners, it will need more help than other shelters. In an ideal world, rescues would take all shelter animals. However, due to limited numbers of foster homes, lesser ability to find foster homes due to many rescue organizations’ small sizes, and most rescues’ restrictive adoption policies, all shelters cannot heavily rely on rescues. The tables below compare the number of dogs a shelter should transfer to other organizations per the model and the number of dogs actually sent to other animal welfare groups. Shelters marked in green are receiving less than the expected rescue support while facilities marked in red are receiving too much rescue help.
Overall, most New Jersey animal shelters require little rescue support if space-constrained facilities fast-track their most highly adoptable dogs. Shelter medicine experts advocate prioritizing the processing of highly adoptable animals to make the best use of space and reduce disease. For example, making sure these animals are the first to get spayed/neutered and vaccinated and receive microchips to ensure they can leave as soon as the shelter finds a good home.
46 shelters received too much help, 26 facilities received just enough assistance and 20 shelters received too little help from other animal welfare organizations. However, the excess dogs rescued (1,653 dogs) at shelters receiving too much assistance was far higher than the rescue deficits at other shelters (173 dogs) resulting in the state’s shelters sending 1,480 more dogs than needed to rescues and other animal welfare organizations. Some shelters, such as Elizabeth Animal Shelter and Paterson Animal Control, report transfers to rescues and other shelters as adoptions. While I made adjustments for these facilities based on my reviews of these facilities underlying records in past years, its certainly possible other shelters incorrectly reported their data (i.e. counting animals sent to rescues as adoptions). Nonetheless, the New Jersey shelter system as a whole is receiving enough rescue assistance, but some shelters are hurt by rescues pulling animals from less needy facilities.
Rescue groups and shelters with extra space should pull dogs from kill shelters with the highest rescue “target” numbers and deficits in the tables below. If shelters not needing rescue support get that extra help, these shelters will not take the steps necessary to properly run their facilities. As a result of enabling poorly performing shelters and not pulling dogs from truly space constrained facilities, rescuing dogs from shelters with enough space leads to less lifesaving.
Shelters receiving less than needed rescue support should also examine their own policies and performance. Are the shelter’s operating processes allowing too many animals to get sick and therefore discouraging organizations to rescue their animals due to subsequent medical costs? Does the shelter actively reach out to rescues/other shelters and treat them with respect? Does the shelter make it convenient for other organizations to pull their animals?
Given killing animals for space is intolerable, the space-constrained shelters need to expand their effective dog capacity. These facilities could use extra space in their buildings to house dogs on a short-term basis. These shelters can enter into arrangements with local veterinarians to house and adopt out some dogs. Additionally, creating a pet owner surrender prevention program, implementing a proper managed intake policy (i.e. where animals are impounded when in danger and waiting periods for owner surrenders are relatively short) and making serious efforts to return lost dogs to owners could free up space in these shelters. Finally, space-constrained shelters with multiple animal control contracts should terminate some of these arrangements to bring their capacity for care in line with the number of dogs they take in. As a result, space constrained shelters still need to take active steps to reduce killing rather than simply solely relying on rescue support.
In certain circumstances, it may make sense for shelters with excess space to send dogs to rescues. For example, a unique breed or a dog needing very specialized behavioral or medical rehabilitation. However, these cases are accounted for in my targeted sent to rescue figures for animal control shelters.
Most New Jersey Animal Shelters Fail to Come Close to Reaching Their Local Dog Adoption Potential
We can assess each shelter’s contribution to making New Jersey and nearby areas no kill. While a shelter may be able to avoid killing healthy and treatable animals, it still may not live up to its potential for adopting out local dogs. On the other hand, a space constrained shelter may kill healthy and treatable dogs, but still do a good job adopting animals out.
The tables below compare the number of dogs from New Jersey and nearby states each animal shelter should adopt out with the estimated number of local dogs actually adopted out.
Many rescue oriented shelters likely pull much easier to adopt dogs than the bulk of dogs needing to get rescued from local facilities. Thus, the results from rescue oriented shelters may look better than they actually are.
Few organizations reached or exceeded their adoption targets. Specifically, only 7 out of 92 shelters met the adoption goals computed by the Life Saving Model. Thus, the overwhelming number of New Jersey animal shelters need to step up their adoption efforts.
Common Sense for Animals exceeded its adoption target, but this may at least partially be due to inaccurate records. While this organization exceeded its adoption targets, the shelter’s figures were off by 69 dogs using the methodology outlined in another blog.
Morris County animal shelters’ higher than targeted local dog adoption results are a bit misleading. These facilities benefited from the method I used to cap adoptions in the county and reduce adoption targets. For example, St. Hubert’s Noah’s Ark’s actual adoptions percentage of its targeted adoptions figures dropped from 159% to 64% when I looked at the unadjusted model. Similarly, Pequannock Animal Shelter’s and Denville Animal Shelter’s actual adoptions percentage of their targeted adoptions figure dropped from 240% to 100% and 100% to 40% when I looked at the unadjusted method. Since Morris County has many shelters that collectively have a very large capacity (i.e. very high adoption potential), my model reduces all Morris County animal shelters’ target adoptions to my county adoption cap. In addition, Pequannock Animal Shelter lists a dog capacity of just one dog at its shelter that is significantly less than the number of dog kennels I’ve seen at the facility in the past. Also, Tri-Boro Animal Welfare lists an unusually small dog capacity of just four dogs which lowered their adoption target. Therefore, these shelters have relatively low dog adoption targets. Additionally, St. Hubert’s-Noah’s Ark may rescue a number of dogs from other St. Hubert’s facilities and those dogs may come from out of state. Thus, these shelters really didn’t do an excellent job adopting out local dogs.
Similarly, Humane Society of Atlantic County and Humane Society of Ocean County also benefited from my model capping adoptions in their counties. Since much larger shelters exist in those counties, these smaller shelters had their adopting targets capped at a relatively low level. Humane Society of Atlantic County’s and Humane Society of Ocean County’s actual adoptions percentage of their targeted adoptions figures dropped from 106% to 91% and 125% to 44% when I looked at the unadjusted method.
Shelters adopting out the fewest animals in total relative to their targets were as follows:
Associated Humane Societies-Newark – 1,241 fewer dogs adopted than targeted
Monmouth SPCA – 529 fewer dogs adopted than targeted
Associated Humane Societies-Popcorn Park – 506 fewer dogs adopted than targeted
Plainfield Area Humane Society – 494 fewer dogs adopted than targeted
Tyco Animal Control – Paramus – 433 fewer dogs adopted than targeted
Bergen County Animal Shelter – 428 fewer dogs adopted than targeted
Gloucester County Animal Shelter – 388 fewer dogs adopted than targeted
Burlington County Animal Shelter – 358 fewer dogs adopted than targeted
Atlantic County Animal Shelter – 335 fewer dogs adopted than targeted
Paterson Animal Control – 311 fewer dogs adopted than targeted
Shake a Paw-Union – 310 fewer dogs adopted than targeted
Greyhound Angels – 290 fewer dogs adopted than targeted
New Jersey Humane Society – 275 fewer dogs adopted than targeted
Hamilton Township Animal Shelter – 274 fewer dogs adopted than targeted
Several shelters’ poor performance is quite predictable. Associated Humane Societies-Newark, Paterson Animal Shelter, Shake a Paw-Union, New Jersey Humane Society, Gloucester County Animal Shelter, Monmouth SPCA, Hamilton Township Animal Shelter and Bergen County Animal Shelter had troublesome stories involving the shelters and/or prominent people affiliated with these organizations in recent years. Tyco Animal Control performed poorly due to this for profit company having a regressive view of animal sheltering. Shake a Paw-Union’s low local adoption numbers are not surprising since it also operates a for profit pet store. Monmouth SPCA and Montclair Township Animal Shelter transported in many dogs from outside of New Jersey during 2019 that reduced their ability to save local dogs.
Shelters Fail to Use Excess Space to Save Local Dogs
To further examine New Jersey animal shelters’ performance in saving the state’s homeless dogs, I compared the targeted number of dogs each shelter should pull from nearby shelters and compared it to the number actually rescued from local facilities. I assume all reported out of state rescued dogs came from southern states or other far away places. While some of the out of state rescued dogs may have comes from nearby areas, I believe this is a small number and does not significantly impact the results.
Virtually all New Jersey animal shelters are failing to rescue the number of local dogs they should. 90 of the 92 shelters should rescue some dogs from other local shelters. In fact, 43 of the 90 shelters with targeted excess capacity failed to rescue even a single dog from a New Jersey animal shelter. Of the 90 shelters that should have rescued dogs, only four shelters met or exceeded their local dog rescue targets. However, two of those shelters, Humane Society of Atlantic County and St. Hubert’s-Noah’s Ark, may not have truly helped the number of medium to large size local dogs they should based on these shelters taking easier to adopt animals and possibly out of state animals (i.e. St. Hubert’s-Noah’s Ark may have rescued out of state transported dogs from other St. Hubert’s facilities that originally came from the south).
As mentioned above, many shelters local rescue numbers are inflated due to these organizations cherry picking highly adoptable animals to rescue. Thus, nearly all New Jersey animal shelters with targeted excess capacity are failing to do their share in ending the killing of local healthy and treatable dogs.
Shelters can overcome challenges in rescuing dogs from outside their service area. In some cases, municipalities may frown on government run shelters using taxpayer funds to rescue dogs from elsewhere. However, shelter directors at these facilities can encourage individuals to form a non-profit or raise money on their own to pay for these rescued dogs. Additionally, shelters with limited capacity or even some of the well-off private shelters could contribute funding for each dog rescued. For example, Maddie’s Fund paid an approximate $160 subsidy to rescues pulling dogs from New York Animal Care & Control. Similarly, private shelters with excess space, but limited financial resources, could expand their fundraising efforts to save more local dogs. Thus, perceived obstacles to rescuing local dogs can and should be overcome.
New Jersey Animal Shelters Need to Form Life-Saving Coalitions
The improper allocation of space within the state’s animal shelter system requires organizations to form coalitions. While putting a competent and compassionate director in every shelter would likely be even more effective, that will likely take time to do. No kill coalitions between animal control facilities and selective admission shelters have been used in places, such as Portland, Oregon, Reno, Nevada, Jacksonville, Florida and Austin, Texas to radically increase life saving. Maddie’s Fund, which has supported using coalitions for over a decade, has many resources for organizations seeking to collaborate with each other. Thus, New Jersey animal shelters need to formally work together, develop quantifiable and measurable goals (such as the targeted outcomes in this blog), and hold each organization accountable for meeting these benchmarks.
Sobering Results Require Shelter Leaders to Critically Examine Themselves
Shelters should examine the reasons why their adoption numbers fall far short of these benchmarks. In some cases, shelters need to expand the hours they are open for adoptions. Many shelters should switch from an overly judgmental adoption process based on black and white rules to a conversational one focused on educating the adopter. Organizations will need to radically increase their off-site events and do same day adoptions. Similarly, many shelters must reduce adoption fees and run frequent promotions. Executive Directors should monitor the latest life-saving programs on Maddie’s Fund’s, American Pets Alive Conference’s, and the Best Friends National Conference’s web sites and put some of these policies into place. Shelter management teams will need to ensure their facilities are clean and customers are treated with respect (this can be measured by encouraging the public to complete surveys). Thus, poorly performing shelters need to stop making excuses and do what it takes to reach their adoption potential.
We can turn New Jersey, New York City and Philadelphia into no kill communities. It is time we give our money and volunteer efforts to organizations who raise their performance to help us reach that goal. To do otherwise, would betray all the animals whose lives are on the line.
Appendix – Life Saving Model Assumptions
The Life Saving Model utilizes the following basic animal shelter population equations to calculate the targeted dog outcomes for each facility:
Daily capacity or population = Daily animal intake x average length of stay
Average length of stay = Daily capacity or population/daily intake
Each shelter’s community dog intake (i.e. owner surrenders, strays, cruelty bite cases), number of dogs returned to owners, and maximum dog capacity were taken from its 2019 “Shelter/Pound Annual Report” submitted to the New Jersey Department of Health. Additionally, I added 3% of each shelter’s annual dog intake to account for foster capacity shelters should use based on American Pets Alive guidelines. Thus, total dog capacity equaled the shelter’s capacity plus foster capacity.
My model revised Tom’s River Animal Facility’s and Pennsville Township Pound’s community intake due to errors in their Shelter/Pound Annual Reports resulting in owner reclaims exceeding the beginning population plus 2019 community intake. Therefore, I increased the 2019 community intake to ensure the beginning population plus 2019 intake equaled the ending population.
Harmony Animal Hospital’s number of dogs returned to owners in community intake were reduced since the shelter had no beginning population or 2019 community intake. The model assumed these dogs were returned to the facilities the shelter rescued the animals from in 2019.
This data was then used as follows:
Community dog intake and dogs returned to owners were initially estimated for each month by dividing the annual figures by 12. In order to take into account the extra space in low intake months and reduced space in high intake months, we multiply that number by each month’s percentage of the average month. For example, assume 240 dogs were taken in during the year and the average month equals 20 dogs (240/12). In July, the dog intake is 120% higher than the average month and we therefore multiply 20 dogs by 1.2 to equal 24 dogs. If 120 dogs were returned to owners during the year, the estimated number of dogs returned to owners in July would equal 12 dogs (120/12 = 10; 10*1.2). The monthly intake percentages were based off the average of the 2019 dog intake data on New York Animal Care & Control’s and ACCT Philly’s web sites.
The estimated number of community dogs returned to owners each month are then assumed to stay 5 days on average at shelters based on data from other shelters across the country. If anything, this estimate is conservative (i.e. average length of stay for dogs returned to owners may be less than 5 days and therefore frees up more shelter space for adoptions) based on some shelters returning the bulk of their dogs to owners within 3 days.
The number of community dogs euthanized (including animals who died or are missing) is set to equal 5% of intake. 5% is a reasonable standard euthanasia rate for shelters in New Jersey to meet given few vulnerable stray puppies (i.e. who could die or require euthanasia) arrive in the state’s animal shelters. The average length of stay for euthanized dogs is assumed to equal 14.5 days. Half of dogs are assumed euthanized for untreatable aggression towards people and 21 days is the time estimated to make that determination. The other half of dogs are assumed euthanized for severe and untreatable health issues and I estimate these dogs are euthanized after 8 days (subsequent to the end of the stray hold and owner surrender protection periods).
Adopted dogs are assumed to stay at shelters for varying lengths of time. Adoption length of stay was based on data from a study in the Journal of Applied Animal Welfare and the figures used (except for space-constrained shelters) are located in a prior blog on pit bull adoption. The data primarily comes from Tompkins County SPCA during a time it saved over 90% of its dogs. This was a fairly conservative data set to use as other no kill open admission shelters’ average length of stay are substantially shorter. Specifically, the following assumptions were made:
80% and 20% of each communities dogs (including pit bulls) were adults 1 year and older and under 1 year.
Pit bulls were assumed to comprise 50%, 35% and 25% of community dog intake at poor, middle/upper middle class, and wealthy area animal control shelters. While some shelters may have pit bulls comprising more than 50% of their shelter dog population at a given time, this is due to pit bulls longer average length of stay. For example, a shelter with pit bulls making up 50% of their dog intake and pit bulls having an average length of stay three times longer than other dogs will have pit bulls constituting 75% of the dog population. Shelters without animal control contracts were assumed to only have pit bulls make up 10% of their community dogs (i.e. strays and owner surrenders) based on most of these shelters’ highly selective admission practices.
Pit bull adoption length of stay was taken directly from the Journal of Applied Animal Welfare study. The average adoption lengths of stay for other breeds from this study were averaged and used for dogs other than pit bulls in the analysis
Space constrained shelters were assumed to adopt out their easiest to adopt animals first until they ran out of space. To estimate the average adoption length of stay, I used pit bull adoption length of stay data from Greenhill Humane Society from March 2013 through May 2015. I broke the adoption length of stay data into 5 groups that each made up 20% of the data. The average adoption length of stay for each of these 5 groups was calculated. The average adoption length of stay of each group was divided by the average length of stay for all of the adopted pit bulls in the Greenhill Humane Society data set. Those percentages were then multiplied by the average dog adoption length of stay determined in the previous bullet and used to determine the adoption lengths of stay used for space-constrained shelters.
Dogs transferred to rescue or other facilities are assumed to stay at shelters 8 days on average based on the assumption strays can’t be released until the 7 day hold period elapses.
Community dogs not returned to owners or euthanized are initially assumed as adopted for each month. However, if the calculated length of stay exceeds the shelter’s required length of stay, dogs are moved from adoption (i.e. longer length of stay) to rescue (i.e. shorter length of stay) until the calculated length of stay each month approximately equals the required length of stay.
Animal control shelters have a minimum of 10% of unclaimed dogs go to rescues. To the extent shelters transfer 10% of unclaimed dogs to rescues despite having space (i.e. reclassifying dogs from adoptions with a longer length of stay to rescues with a shorter length of stay), I do not require these facilities to use that space to rescue additional dogs.
Required length of stay = Shelter’s total capacity/adjusted daily intake for the month. Adjusted daily intake for month = Adjusted monthly intake per first bullet above/the number of days in the month.
Shelters with excess capacity are assumed to use the extra space to rescue and adopt out dogs from other New Jersey animal shelters. To the extent all healthy and treatable New Jersey animal shelter dogs are saved, I assume additional dogs are pulled from nearby states with similar types of dogs. The model assumes shelters adopt out 99% of rescued dogs and euthanize 1% of them. Based on pit bull type dogs having longer lengths of stay at shelters, I assume 80% of dogs rescued from local animal shelters are pit bulls and 20% are non-pit bulls. 80% and 20% of pit bull and non-pit bull type dogs are considered 1 year and older and under 1 year. The average length of stay for rescued pit bulls and other dogs are the same as the adoption length of stay figures above. Due to immateriality, I assumed the dogs rescued and euthanized stayed at the shelter the same amount of time as the dogs adopted out.
Each month’s targeted outcomes are added to determine how many local dogs New Jersey animal shelters should adopt out, send to rescue, rescue from other nearby animal shelters and euthanize.
The targeted number of dogs rescued and adopted were capped at 2 pit bulls per 1,000 people in each county. If the model yielded a higher result than this cap, the targeted numbers of dogs adopted were set to equal to this cap using the pit bull percentage assumptions above. For shelters in these counties (except Passaic County), I calculated the cap at the county level and then reduced the number of dogs adopted for the county to equal the cap. I excluded West Milford from Passaic County due the town’s large distance from the population centers in the rest of the county. Each shelter’s percentage of total targeted adoptions in the county from the unmodified model were applied to the the total reduction in the number of adoptions in the county to yield the targeted numbers of dogs adopted in the modified model. If the shelter also rescued animals from other shelters, the rescued numbers were also reduced since I assume rescued animals are adopted.
After the October 20, 2017 New Jersey Department of Health inspection, the state health department stopped inspecting AHS-Newark. As I documented at that time, the City of Newark and its health department inadequately inspected the shelter for years and tried to sweep the problems under the rug. In fact, the Newark Department of Health and Community Wellness reported few to no issues around the same times the state health department found massive problems in the past and in 2017.
Ultimately, the City of Newark did not pursue operating its own shelter. After Newark and AHS-Newark had a significant contract dispute in March 2018, AHS-Newark stopped providing any services during a second dispute in November 2018. Subsequently, AHS-Newark contracted with St. Hubert’s for around six months. St. Hubert’s terminated its arrangement with Newark citing “financial hardship” in April 2019 and the City of Newark contracted again with AHS-Newark at around a 50% higher monthly cost than its previous arrangement with the shelter.
Has AHS-Newark improved since this time? Is the New Jersey Department of Health and Newark Department of Health and Community Wellness ensuring AHS-Newark follows state law and treats animals properly?
Data Reviewed
To get a better understanding of the job the Newark Department of Health and Community Wellness did at inspecting AHS-Newark, I submitted an Open Public Records Request for all AHS-Newark inspection reports conducted from January 1, 2019 until early September 2020. The City of Newark sent me a number of inspection reports, emails and AHS-Newark records. You can see all the records at this link.
Overall, the inspection reports were of poor quality. Specifically, the inspectors frequently reacted to complaints and did not proactively inspect the shelter for other problems. Additionally, the inspectors did not even take the time to type out their findings. Instead, they appeared to just quickly write down a few notes that were often difficult to read. Additionally, it was often impossible to determine which set of inspection report notes related to which specific inspection. Thus, the Newark Department of Health and Community Wellness continued to do a poor job at inspecting AHS-Newark.
City of Newark’s Poor Quality Inspections Still Find Problems in 2019
Michael Wilson inspected AHS-Newark on April 15, 2019 and gave the shelter a Conditional A grade. As you can see, the inspection only took a mere one hour and 15 minutes and noted an isolation room violation. Unfortunately, I could not find any accompanying notes detailing the nature of the violations.
While I could not determine if the inspection notes below were from the April 15, 2019 inspection, they did lay out some serious issues. AHS-Newark again had food debris, which can lead to rodent infestations, a broken baseboard, an unsanitary isolation room in the shelter’s infamous basement, had a dirty area with dead animals and also failed to finish the required painting in the facility. Thus, even the inept Newark Department of Health and Community Wellness found serious problems.
Miraculously, Michael Wilson came back to the shelter eight days later and gave the shelter a “Satisfactory” grade with no comments in the inspection report provided to me.
Newark Health Department Finds Massive Problems in 2020
After receiving a complaint on January 6, 2020, Michael Wilson inspected the shelter three days later. The complaint alleged the shelter had a foul odor, unsanitary conditions and cats having upper respiratory infections. During the inspection, the Newark Department of Health and Community Wellness found the shelter had a “strong animal odor”, all the main dog kennels required painting/stripping and pigeons inside the facility. Mr. Wilson ordered the shelter to separate dogs and cats to reduce stress (i.e. cats are a prey to dogs and cats understandably are scared in such an environment) and get more volunteers to provide mental stimulation to the animals.
In February 2020, the New Jersey Department of Health received multiple complaints about a serious disease in a dog that died at AHS-Newark and the shelter imposing a quarantine in part of the facility. Instead of inspecting AHS-Newark, the New Jersey Department of Health inspector, Linda Frese, told the Newark Department of Health and Community Wellness to investigate and ensure there was no outbreak at the shelter and in the community.
Once again, Michael Wilson conducted a reactionary and low quality inspection on February 19, 2020. In the report, Mr. Wilson noted AHS-Newark had 284 dogs and 359 cats at the facility. This was a dramatic increase from the 117 dogs and 49 cats the shelter had in the April 15, 2019 inspection report. Therefore, the risk of a disease outbreak was much greater. Despite this, the inspector only noted a fire inspection violation. Mr. Wilson did not even provide an inspection grade nor write down when he completed the inspection to let us know how long this inspection was.
The inspection report comments raise serious question about the job Michael Wilson did. Mr. Wilson obtained an “Interim Report” from Cornell University that showed the deceased dog had a “Moderate Positive” result for Coronavirus PCR and “High Positive PCR, Beta” for Mycoplasma cynos. The report stated these were preliminary results and additional testing was in progress. While Michael Wilson’s inspection report comments stated he was waiting for final results, the City of Newark did not provide them to me. Thus, the Newark Department of Health and Community Wellness did not appear to obtain the final report.
The inspection report comments also showed no proactive efforts in this inspection. Basically, Mr. Wilson reiterated the Cornell University preliminary report’s findings. Additionally, he wrote some quick notes about cleaning protocols, but they seemed more like what the shelter told him rather than him actually observing the staff. For example, the report states the shelter cleaned daily, but then cleaned more after receiving the preliminary report. However, Mr. Wilson could not obtain a cleaning log to verify that claim. Also, I also found it a bit unusual that the shelter stated it got a new supervising veterinarian on the very day this sick dog died in his cage. Thus, I did not get a warm fuzzy feeling after reading this shoddy inspection report.
Massive Problems Emerge Recently
The Newark Department of Health and Community Wellness inspected AHS-Newark after receiving a complaint about cats at the shelter on August 10, 2020. During this inspection, Michael Wilson, who apparently got a promotion to Chief REHS, assigned another person to inspect the shelter. Based on the inspector’s report and email to Michael Wilson, the inspector simply talked with Assistant Executive Director, Ken McKeel, and the shelter manager, reviewed “some med records” and hardly did anything else.
Despite this being an inadequate inspection, the report noted 60 under 8 week kittens died of Feline panleukopenia. According to the UC Davis Koret Shelter Medicine Program, Feline panleukopenia is a devastating disease that “causes vomiting, diarrhea, and can cause sudden death in cats”, is transmitted through cat feces or poop and can last in a shelter for months or even years without proper disinfection. The virus is transmitted primarily by the fecal-oral route (including through exposure to objects/clothing/hands contaminated with virus from feces). FPV is very durable and can persist in the environment for months or even years unless inactivated by an effective disinfectant. However, the UC Davis Koret Shelter Medicine Program also states its very preventable through common sense measures:
Although panleukopenia can be a scary and potentially devastating disease in a shelter, reliable vaccination on intake, effective routine cleaning with a parvocidal disinfectant, and housing that minimizes fomite transmission will greatly reduce the risk of spread. With new tools for diagnosis and risk assessment, even outbreaks can generally be managed without resorting to depopulation.
Even though AHS-Newark was clearly not following these disease prevention and control guidelines, the wonderful Newark Department of Health and Community Wellness inspector simply stated management was doing things to minimize this disease. The inspector made some general comments about vaccination protocols, cleaning and isolating animals. Nothing in the report indicates they observed the shelter doing these things, obtained the specific detailed protocols from the supervising veterinarian and observed all the shelter’s cats for signs of disease. However, the report noted AHS-Newark had over 400 cats (up from 49 cats and 284 cats from other inspections) and 589 other animals in the building. Based on AHS-Newark’s 2019 Shelter/Pound Annual Report, the shelter’s cat capacity is 300 cats and 275 dogs and other animals. In other words, the shelter exceeded its cat capacity by over 33% and its dog and other animal capacity by almost 100%. Thus, AHS-Newark was at high risk of disease outbreaks.
The Newark Department of Health and Community Wellness inspection did little to reduce AHS-Newark’s issues as complaints poured into the New Jersey Department of Health. In a September 2, 2020 email from New Jersey Department of Health inspector, Linda Frese, Ms. Frese stated the shelter received “a few extensive complaints regarding the current conditions at the Associated Humane Societies in Newark.” Specifically, Ms. Frese mentioned cats dying from Feline panleukopenia, animals not being properly identified, the shelter cleaning with animals in their cages that resulted in chemical burns, animals not receiving proper medical care and the shelter possibly not having a required supervising veterinarian. Additionally, AHS-Newark was alleged to not have air conditioning in its ACO vans that potentially caused a dog to die last August.
At the end of the email, Linda Frese requested they have a conference call to discuss the complaints. What was Michael Wilson’s response just twenty minutes later? Three words: “Will investigate ASAP.”
Clearly, Linda Frese was alarmed at this response as she laid out a detailed email stating all the things the Newark Department of Health and Community Wellness should look for. Additionally, Ms. Frese asked Michael Wilson to have his inspectors check “all the hidden rooms throughout the facility.” After reading this email, I got the impression Linda Frese did not trust Michael Wilson’s inspectors to do the job correctly.
In response, Michael Wilson sent one of his inspectors in and they once again did a reactive and poor quality inspection. First, the inspector did not even complete an inspection report. Instead, they just listed out the New Jersey Department of Health’s areas to investigate and wrote mostly one or two sentence responses. Once again, the inspector often relied on AHS-Newark’s assertions. For example, the inspector simply accepted management’s word that 1) animals are removed from cages during deep cleaning, 2) all the animal control vans have air conditioning despite multiple allegations that these vehicles don’t and one dog died and another dog became seriously ill in one of these vehicles and 3) that animals are euthanized humanely. Thus, this was another inadequate inspection.
Despite the poor quality inspection, the report still found numerous violations of state animal shelter laws. The shelter admitted more kittens died the night before which could indicate violations of N.J.A.C. 8.23A-1.9 (c) that requires animals be observed daily for illness and receive prompt treatment. AHS-Newark also didn’t know the amount of water and disinfectant used in its solutions to clean cages. Obviously, the correct ratio of water to disinfectant in these solutions is critical to ensure proper disinfection and safety for the animals (i.e. avoid chemical burns, breathing in chemicals, etc.). Clearly, the shelter violated N.J.A.C. 8.23A-1.8 (c) that states shelters must clean with “all soiled surfaces with a detergent solution followed by a safe and effective disinfectant.” The shelter also violated N.J.A.C. 8.23A-1.6 and N.J.A.C. 8.23A-1.8 by not taking animals out of their cages during cleaning and allowing the animals to be in the enclosures while they were still wet. Also, AHS-Newark did not have hand drying paper which also violates N.J.A.C. 8.23A-1.8 (d) that states “Premises (buildings and grounds) shall be kept clean and in good repair in order to protect the animals from injury and disease, to facilitate the prescribed sanitary practices as set forth in these rules, and to prevent nuisances.” AHS-Newark also had numerous cats with no identification cards (i.e. how can the shelter know the medical history of animals and provide treatment if it can’t tell which cats are which). This violates N.J.A.C. 8.23A-1.13 which requires the shelter have accurate records of each animal.
The inspection report indicates AHS-Newark may have violated the humane euthanasia regulations in N.J.A.C. 8.23A-1.11. AHS-Newark records did not show it weighing animals to ensure it gave sufficient sedatives and euthanasia drug doses. Similarly, the euthanasia records did not indicate the shelter used the required humane injection method (typically intravenous). Additionally, the shelter provided no documentation that individuals who were not veterinarians were properly certified to humanely euthanize animals. Finally, AHS-Newark provided no documentation that it confirmed euthanized animals lacked a heartbeat, pulse, respiration and eye movement to ensure the animals were in fact dead before they was disposed of or cremated. Thus, AHS-Newark’s records indicate it may have violated N.J.A.C. 8.23A-1.11.
Subsequently, Michael Wilson stated AHS-Newark had several of these violations. In addition, Mr. Wilson said AHS-Newark broke the law by not reporting bites to the Newark Department of Health and Community Wellness.
Miraculously, Michael Wilson’s inspectors visited AHS-Newark the next day and jotted down a few messy handwritten sentences stating the shelter fixed the violations. Furthermore, the inspectors gave AHS-Newark a “Satisfactory” grade despite the report indicating the inspectors did not do a full inspection. Does anyone in their right mind believe AHS-Newark should have a “Satisfactory” rating?
Subsequently, the New Jersey Department of Health’s Deputy State Public Health Veterinarian (i.e. Linde Frese’s boss) told Michael Wilson to investigate a case of a Shih-tzu dog alleged to have its coat matted with maggots and to not have received medical care for days. In fact, the complaint alleged the infection was bad enough that it could require a veterinarian to amputate the leg. This dog allegedly arrived at AHS-Newark on the very day the Newark Department of Health and Community Wellness last inspected AHS-Newark and gave it a “Satisfactory” grade. Interestingly, Michael Wilson forwarded this email to two of his inspectors stating he wanted them to jointly inspect AHS-Newark. In my opinion, this seems like he lacked confidence in his inspectors to individually do the job right.
The Newark Department of Health and Community Wellness inspected AHS-Newark the very next day and found everything hunky dory. Specifically, the inspectors saw the dog and the animal had his/her wound treated with pain medicine and an antibiotic. The shelter’s records indicated the dog came in on September 11, 2010, which was a day after the September 10, 2020 date the person making the complaint stated. While the inspector did review the shelter’s intake records for September 10, 2020, I don’t think the inspector can rely on such records given AHS-Newark’s repeated inability to keep accurate records. In other words, if the dog really came in on September 10, 2020 (i.e. if AHS-Newark did not enter the animal into its records until September 11, 2020) and did not receive treatment until the next day, AHS-Newark would have violated N.J.A.C. 8.23A-1.9(d) 1 that requires prompt veterinary care to relieve pain and suffering. Thus, the Newark Department of Health and Community Wellness once again relied on AHS-Newark’s assertions instead of thoroughly inspecting the shelter.
New Jersey Department of Health Fails to Do its Job
Twenty one years ago the New Jersey Commission of Investigation’s first report on the state and county SPCAs analyzed the animal shelter inspection system. You can read this report starting on page 126 of this link. In summary, the report found local health departments did not properly inspect animal shelters.
The rules and regulations governing the operation and conditions of shelters are contained in a document entitled Sanitary Operation of Kennels, Pet Shops, Shelters and Pounds, which was promulgated by the state DOH. Generally, it is acknowledged that the rules and regulations are adequate, but that they are not enforced vigorously. It is evident that the thoroughness of the inspection, the findings of deficiencies and the ultimate rating of the facility are dependent upon the discretion, thoroughness and skill of the inspector. As candidly admitted by one local inspector who had not conducted thorough and probing inspections, he simply had lacked the training and experience to perform anything more than a perfunctory visit. Based upon an examination of the inspection system, inspections and the effectiveness of the system vary greatly.
The New Jersey Commission of Investigation clearly described how the state health department did much better inspections than local health departments.
There were also differences in the types of inspections that were conducted by state officials versus state inspectors and by state versus local personnel. With rare exception, the inspections conducted by state DOH officials were more thorough and more likely to cite violations than those conducted by state DOH inspectors. Examples appear below in the inspections of the Cape May County and Hudson County SPCA shelters. Where SPCA shelters were problematic, the inspections conducted by the state DOH were more thorough and consistent than those conducted by the local authorities. As evidenced by the inspection findings for the Cape May County and Hudson County SPCA shelters, more thorough inspections were performed and significant violations cited when state officials visited the shelters.
Furthermore, the New Jersey Commission of Investigation explained how local health departments (e.g. the Newark Department of Health and Community Wellness) often did not want to identify problems due to the difficulty in finding an alternative shelter. In fact, they cited Jersey City’s Hudson County SPCA. Subsequent to the New Jersey Commission of Investigation’s report, Jersey City did find a facility for the newly formed Liberty Humane Society to operate and handle the city’s homeless animals.
The Commission was told that the dilemma perceived by local inspecting authorities in dealing with any shelter that is constantly in violation is that there is no realistic alternative facility if the shelter is shut down. Clearly, this was the situation with the licensing of the Hudson County SPCA shelter, despite the persistent and serious problems found there.
In the early 1990s, the state health department had more staff and was more focused on animal shelter inspections. As the New Jersey Commission of Investigation report explains, the state health department inspected every animal shelter once every two years. Based on the number of animal shelters in New Jersey today, that would amount to around 45 to 50 inspections each year. Additionally, the New Jersey Department of Health would spend time going over the issues with the local health departments.
The role of the state DOH in conducting shelter inspections has changed dramatically over the past decade. At the beginning of the 1990s, the department’s Infectious and Zoonotic Diseases Program had more staff and its focus was considerably more narrow than it is today. There were four field veterinary technicians who inspected shelters once every two years, in addition to a coordinator who occasionally conducted inspections. Typically, joint inspections with the local health official were conducted, and the DOH inspector spent time reviewing procedures and pertinent issues with the local authority.
Beginning in the mid-1990s, the New Jersey Department of Health conducted far fewer inspections. As a result of budget cuts, the department had fewer staff and were responsible for more things. The state health department stopped inspecting shelters proactively and only responded to certain complaints. In fact, just as the New Jersey Department of Health is currently doing with AHS-Newark and other shelters, it often just referred the problems to incompetent local health departments. Nonetheless, the state health department’s animal shelter inspection function, which had three people, conducted six shelter inspections in 1999. As a comparison, the New Jersey Department of Health’s animal shelter inspection team has two members currently, and hasn’t inspected a single shelter in almost two years. In fact, the New Jersey Department of Health has not inspected any shelter other than Hamilton Township Animal Shelter since October 21, 2017 (i.e. about three years). Thus, the New Jersey Department of Health is doing an even worse job now than it did twenty one years ago when the New Jersey Commission of Investigation wrote its scathing criticism of the agency.
Commencing in about 1994, as department budgets were cut throughout state government and positions were eliminated through attrition, the program’s staff was reduced drastically. Currently, the program is not only responsible for many more areas of the public health, but its staff consists merely of the State Public Health Veterinarian, the Senior Public Health Veterinarian and one field veterinary technician. The routine, biannual inspection has been replaced by a reactive inspection, which occurs only when substantive complaints are received. The DOH, which is besieged by numerous complaints daily, dismisses many complaints because it lacks jurisdiction over the matter alleged and routinely refers complainants to the local health office even when it has jurisdiction. In 1999, the DOH conducted approximately six shelter inspections and only three as of August 2000.
The New Jersey Commission of Investigation report also criticized the state health department for failing to fine shelters for violations. While the individual fines of $5-$50 per violation are small, they can add up if the infractions involve many animals and exist for many days. At a minimum, fines can send the message the shelter must improve. As in the past, the New Jersey Department of Health failed to fine AHS-Newark for its repeated violations or even pressure the Newark Department of Health and Community Wellness to close AHS-Newark down. Given the New Jersey Department of Health did fine the East Orange Animal Shelter $4,000 in 2015 (the shelter has significantly improved since then) and asked and got the Linden Health Department to close Linden Animal Control in 2014, the state health department can take positive action. However, the New Jersey Department of Health has simply chose to do nothing in recent years.
However, the DOH does possess the statutory authority to institute enforcement proceedings to assess fines against a shelter. According to DOH officials, this remedy is reserved for only the most egregious cases. The department’s clear preference has been to bring a facility into compliance through recommendations, technical assistance and frequent reinspections. Its reluctance to institute enforcement proceedings is reflected in the facts that it has imposed sanctions only twice in the past 15 years or more and that both cases were instituted in 2000, the first at the insistence of the Attorney General’s Office and the second on DOH’s initiative.
The New Jersey Commission of Investigation severely criticized the state and local health departments coddling approach to regressive shelters twenty one years ago. Specifically, the New Jersey Commission of Investigation stated the health departments, who were doing far more then than now, must issue large fines to regressive shelters and close those facilities if they choose to not fix their problems. Most notably, the New Jersey Commission of Investigation clearly said municipalities must take over these shelters or find other ones to use.
The approach of the state Department of Health to counsel and advise a shelter’s management on how to remedy the violations and improve the conditions is admirable. However, such an approach is effective only when the management is amenable to making the improvements. When it becomes clear that such an approach is unsuccessful, then the department must be aggressive in pursuing legal proceedings. The language threatening enforcement proceedings, which typically appears in letters from the department to a shelter’s management, must be more than mere words. The failure to follow through leads to a loss of credibility for the department and reinforces the cavalier attitude of the shelter’s management. The inspecting and licensing authorities on the local level must conduct themselves in similar fashion. In the event of mounting fines and continued lack of responsiveness by shelter management, the municipality must be prepared to assume control of the shelter or entrust its operation to a suitable alternative.
The New Jersey Commission of Investigation repeated its conclusions about the inspection system in a scathing report on AHS-Newark in 2003. You can read that report here. The report made the following conclusion:
The history of AHS’s shelter operation has been dominated by deplorable kennel conditions, inhumane treatment of animals by workers, mismanagement and nonexistent or inadequate medical care. The problems were neither singular nor occasional. The accounts and descriptions provided by members of the public and former and current staff members, including veterinarians, paint a bleak picture of shelter life. The reality for the animals belied AHS’s propaganda that its “sole purpose” has been “the care and welfare of animals” and that it has “a high adoption rate.”
As a result of the New Jersey Commission of Investigation’s reports on the SPCAs and AHS, the state formed the Office of Animal Welfare and a large group of stakeholders, which was formed by an Executive Order from Governor McGreevey, issued the Animal Welfare Task Force Report in 2004. The report recommended local health authorities conduct at least two annual inspections (not counting those relating to complaints) of shelters. Additionally, the Animal Welfare Task Force report said the state health department should inspect every animal shelter at least once a year.
Local health departments should inspect each animal facility a minimum of two times per year (inspections conducted in response to complaints should not count for this purpose). DHSS should supplement local oversight by inspecting each facility at least once each year
As a result of the report’s recommendations, the Office of Animal Welfare had a staff of five people to inspect animal shelters that was in addition to the New Jersey Department of Health’s inspection staff. After a couple of years, the Office of Animal Welfare only had two staff left and they were merged into the New Jersey Department of Health’s inspection team. Based on conversations with a knowledgeable person, the two remaining Office of Animal Welfare staff conducted significantly more inspections of shelters, pet stores, etc. each year than the state health department does today. Sadly, the New Jersey Department of Health did not replace these inspectors when they left a number of years later.
Despite the New Jersey Department of Health having less personnel, I found the state health department was somewhat responsive to complaints when I began NJ Animal Observer in 2014. The New Jersey Department of Health’s inspections over this time and the results are listed below.
August 2015 – North Jersey Humane Society (Bloomfield ended its agreement with the organization to run its shelter and the state health department revoked the ACO license of the organization’s leader)
Even with the limited actions the state health department took, the inspections often had some positive impact on shelters (i.e. closing regressive facilities down and/or getting rid of bad management). With the strong animal advocacy community in New Jersey and the power of social media, these terrible inspection reports became known to many people. In addition, print and/or television media also often ran stories on these inspections. Thus, even with the New Jersey Department of Health doing little more than inspecting animal shelters, the impact often was significant.
As the timeline of state health department inspections shows, the New Jersey Department of Health started inspecting far fewer shelters after the 2017 AHS-Newark inspections and stopped inspecting altogether after its January 2019 Hamilton Township Animal Shelter inspection. In the last two years, numerous people have asked the New Jersey Department of Health to inspect shelters after making serious allegations. Also, staffing cannot explain the state health department’s refusal to inspect as it has the same number of inspectors over the entire time period above (i.e. 2014 to 2020). Thus, there is no substantive reason why the New Jersey Department of Health stopped inspecting animal shelters.
Clearly, the New Jersey Department of Health’s refusal to inspect animal shelters has had dire results for the animals at AHS-Newark and other regressive shelters. As the information above shows, AHS-Newark’s problems not only remain, they may be getting worse. The inspection reports indicate animals piling up in the shelter and rampant disease outbreaks. As of the time I’m writing this blog, AHS-Newark stopped adopting out dogs and sending dogs to rescues due to canine parvovirus at the shelter. In fact, the public’s frustration has grown to the point where shelter reform bill S636 includes a provision requiring the state health department to inspect every animal shelter three times a year. Given the ongoing problems at one of the state’s largest animal shelters, Governor Murphy and New Jersey Department of Health Commissioner Persichilli must provide an explanation as to why the state health department has not performed its job, make the New Jersey Department of Health inspect animal shelters, particularly those with repeated major problems, and take the actions the New Jersey Commission of Investigation and Animal Welfare Task Force demanded they do in 1999, 2003 and 2004.
Recently, I wrote a blog discussing decreased killing at New Jersey animal shelters in 2019. This blog will explore the 2019 statistics in more detail and assess the current status of the state’s animal shelters.
Most New Jersey animal shelters voluntarily report detailed data to state authorities. Earlier this year, I shared the 2019 summary statistics for New Jersey animal shelters on my Facebook page. Each year, the New Jersey Department of Health requests each licensed animal shelter in the state to submit animal shelter data for the previous year. Animal shelters voluntarily submit this data in the “Shelter/Pound Annual Report.” The New Jersey Department of Health takes these Shelter/Pound Annual Reports and compiles the number of dogs, cats and other animals impounded, redeemed, adopted and euthanized to prepare its Animal Intake and Disposition report. However, the Shelter/Pound Annual Reports include additional information on how animals were impounded (i.e. strays, owner surrenders, rescued from in-state facilities, rescued from out of state shelters, and cruelty/bite cases/other) and disposed of (i.e. returned to owner, adopted, sent to rescue/another shelter, and died/missing/other outcome). Additionally, the Shelter/Pound Annual Reports include the number of animals in shelters at the beginning and end of the year as well as the maximum number of animals facilities can hold. Thus, the Shelter/Pound Annual Reports include very important data not found in the New Jersey Department of Health’s summary report.
I compiled the data from these reports and analyze the results in this blog. 2019 statistics for each New Jersey animal shelter are listed at this link. You can also view each “Shelter/Pound Annual Report” at this link.
Garbage Data Raises Serious Questions About New Jersey Animal Shelters’ Statistics
Most New Jersey animal shelters do not properly account for their animals. Simple math dictates the number of animals at a facility at the beginning of the year, plus all animals coming in during the year, less all animals leaving for the period, should equal the number of animals a shelter has at the end of the year. Stunningly, 47 out of 91 shelters reporting these dog statistics and 50 out of 89 facilities submitting this cat data failed to get this right. This raises serious questions about the accuracy of these shelters’ reported statistics. 31 of the 47 shelters with flawed dog statistics and 32 of the 50 facilities with incorrect cat statistics should have had more animals at the end of the year than reported. While these errors could have been due to incorrect counts of the number of animals at facilities, these shelters may have not recorded outcomes, such as animals who were killed, died, or went missing. To put it another way, 1,934 cats and dogs should have had outcomes reported and did not. Thus, there is the potential that as many as 1,934 additional dogs and cats were killed, died or went missing from New Jersey animal shelters than were reported in 2019.
Even worse, a number of animal shelters reported having a different number of animals at the end of 2018 and at the beginning of 2019. Obviously, shelters should report the same number of animals at the end of the prior year and the start of the current year. However, 32 of 88 shelters reported different numbers of dogs at the end of 2018 and the beginning of 2019. Similarly, 37 of 87 shelters reported different numbers of cats at the end of 2018 and the beginning of 2019. The worst offenders are listed in the tables below:
Shelters may have failed to classify animals adopted out and sent to rescues properly. Both Paterson Animal Control and Elizabeth Animal Shelter reported no animals were sent to rescues and all dogs and cats leaving their facilities alive were owner reclaims or adoptions. However, intake and disposition records I reviewed at both of these shelters in recent years revealed almost all “adopted” animals are actually rescued. One has to wonder how many other facilities failed to properly classify adoptions and rescues properly. This data is very important as it provides details on the burden rescues and other shelters are taking on from these facilities.
We need better oversight of New Jersey animal shelters’ data reporting. Currently, these statistics are voluntarily reported and most shelters are not taking this seriously. For example, I noticed a large number of reports were submitted many months after the end of the year. This data should be easy to compile since facilities can utilize animal shelter software programs, some of which are free, to do this task. Furthermore, New Jersey animal shelter laws mandate facilities maintain much of the raw data found in the Shelter/Pound Annual Report. Unfortunately, New Jersey Department of Health inspections routinely find shelters do not properly keep records on animals. We need to make the data reporting mandatory for animal shelters as the shelter reform bill, S636, does along with serious penalties for significant errors (especially if deliberate). In order for animal shelters to take data reporting seriously, we may also need to require audits of these reports. Thus, these results show we need stronger laws and the New Jersey Department of Health to play a greater role in ensuring reported animal shelter statistics are in fact accurate.
Despite the errors in these reports, the data provided still reveals important information.
More Animals Losing Their Lives in New Jersey Animal Shelters Than Disclosed in Summary Report
The more detailed data in the Shelter/Pound Annual Reports allows one to more critically examine the percentage of locally impounded animals dying in New Jersey’s animal shelters. The following table summarizes my analysis of the kill rate calculated from the New Jersey Department of Health’s summary report and the data reported in the Shelter/Pound Annual Reports.
The statistics include an estimate to remove animals St. Hubert’s transfers in and quickly transfers out through its Sister Shelter WayStation program. Since St. Hubert’s is effectively acting as a middle man and not holding these animals very long, it makes sense to exclude these dogs and cats from the various kill rate statistics. If I did not exclude these animals, I would understate the dog and cat kill rates due to inflated intakes and outcomes numbers. Therefore, I removed all of St. Hubert’s dogs transferred out from the intake and outcomes figures in the metrics. Since St. Hubert’s primarily uses the Sister Shelter Waystation program to quickly transfer in cats and send them to out of state facilities, I only backed out the cats St. Hubert’s transferred to out of state organizations in the various kill rates. This adjustment increased the dog kill rate (intake) from 5.1 to 5.7% and the cat kill rate (intake) from 15.2% to 15.4%.
The Animal Intake and Disposition report prepared by the New Jersey Department of Health only allows one to calculate the number of animals killed as a percentage of total animals impounded or intake. I prefer calculating the kill rate as a percentage of outcomes rather than intake as this metric directly compares positive and negative outcomes. Using intake may depress the kill rate since shelters can simply hold animals for a long time to the point of overcrowding. Calculating the kill rate based on outcomes rather than intake caused the dog kill rate to decrease from 5.7% to 5.6% and the cat kill rate to increase from 15.4% to 15.6%.
To calculate the statewide kill rate, we must also back out transfers from one New Jersey animal shelter to another state facility to avoid counting animals still in the state’s shelter system or registering two outcomes for the same animal (i.e. one New Jersey animal shelter transfers a dog or cat to another state facility which then adopts out the animal). This adjustment increases the dog kill rate from 5.6% to 6.0% and the cat kill rate from 15.6% to 16.6%.
In addition, we should increase the kill rate for animals who died or went missing in shelters. In the past, I’ve labeled this metric the death rate as these animals are likely dead or in a very bad situation. Unfortunately, the Shelter/Pound Annual Report includes animals who died or went missing in the “Other” outcome category. The “Other” category contains positive live releases, such as TNR for cats, at a few shelters. While including the “Other” category in the death rate for most shelters is appropriate (i.e. those facilities that don’t do TNR or don’t include cats released through TNR programs in “Other” outcomes), I’m no longer doing this due to an increasing number of shelters implementing TNR. Instead, I calculated the kill rate by subtracting out “Other” outcomes from total outcomes. If a shelter specifies the number of animals included in “Other” that left the shelter alive, I count this as “Other Live Release” and do not back these amounts out of total outcomes. After making this adjustment, the dog kill rate increased from 6.0% to 6.1% and the cat kill rate stayed at 16.6%. For those interested in seeing the estimated death rates, you can find them in the supporting spreadsheet.
Also, many shelters transport easy to adopt animals from out of state which artificially increases live release rates. To properly calculate the percentage of New Jersey animals losing their lives, we need to adjust for transports. Unfortunately, shelters don’t break out their kill rates by local and out of state animals. However, most likely nearly all of the out of state animals (primarily puppies and easy to adopt dogs and cats) make it out of shelters alive. Therefore, I back out the number of out of state transports from total outcomes to estimate the local kill rate. This adjustment increases the New Jersey dog kill rate from 6.1% to 7.7% and the state’s cat kill rate from 16.6 to 17.8%.
Also, I estimate a maximum local kill rate by including the number of unaccounted for animals described in the section above. Making this adjustment increases the maximum potential New Jersey dog kill rate from 7.7% to 10.2% and the maximum potential state cat kill rate from 17.8% to 20.7%.
Some animal shelters quickly return large percentages of their animals to owners. At these shelters, the populations served are typically well-off and animals are licensed and have microchips. To account for the animals facilities actually have to shelter, I calculated a kill rate for non-reclaimed animals and a maximum potential kill rate for non-reclaimed local animals. The non-reclaimed kill rate and maximum potential kill rate for dogs is 9.0% and 17.8%. Non-reclaimed cats had a 18.8% kill rate and a 22.1% maximum potential kill rate. Thus, the percentage of New Jersey animals losing their lives in our state’s animal shelters may be much higher than the state summary report suggests.
Kill Rates Extremely High at a Number of New Jersey Animal Shelters
Dogs and cats are likely to lose their lives at a number of New Jersey animal shelters. Shelters with the highest kill rates for dogs and cats (excluding very low intake facilities) are listed in the following tables:
Thus, both dogs and cats have a very good chance of leaving many New Jersey animal shelters dead rather than alive.
In terms of raw numbers, the following shelters killed the most animals:
Many shelters fail to account for large numbers of their animals. As discussed above, a shelter’s number of animals at the end of the year should be calculated as follows:
Beginning number of animals + animals impounded – animals leaving the shelter
Unfortunately, a large number of shelters take in far more animals than they can explain where they went. Shelters having the highest numbers of unaccounted for dogs and cats are listed in the following tables:
Dog and cat kill rates at many shelters may be even higher if these unaccounted for animals are counted as killed. If we only consider animal shelters which reported transporting few or no animals in 2019, facilities with the highest dog and cat kill rates considering the unaccounted for animals described above are as follows:
Thus, the plight of dogs and cats may be far worse in New Jersey animal shelters when we consider the unaccounted for animals.
Shelters Turn Their Backs on New Jersey’s Animals
New Jersey animal shelters rescue far more dogs from out of state than from other New Jersey animal shelters. Specifically, New Jersey animal shelters transferred in 8,197 dogs from out of state animal shelters and only rescued 2,308 dogs from other New Jersey animal shelters. However, St. Hubert’s frequently transfers a substantial number of its transports quickly to its partners in New Jersey and other states. If I back out St. Hubert’s transfers of dogs to out of state organizations, the number of transports decreases from 8,197 dogs to 5,269 dogs. While the state’s local kill rate decreased in 2019, it is likely the local kill rate would have decreased by more if not for the massive number of out of state transports.
While perhaps some shelters take animals from nearby New York or Pennsylvania animal control shelters, the overwhelming majority of these dogs most certainly came from down south. In fact, New Jersey animal shelters transported more dogs from out of state than dogs who were killed in New Jersey animal shelters. This number does not include additional out of state dogs transported into New Jersey by rescues operating without a physical facility. Shelters transporting the most dogs from out of state were as follows:
Shelters Do Far Worse with Animals Requiring New Homes
Since dogs reclaimed by their owners typically have licenses and/or microchips and quickly leave the shelter, its informative to look at dogs shelters have to find new homes for. To get a better idea of how organizations are doing with animals they actually have to shelter, I also examined what percentage of non-reclaimed dogs lose their lives at each facility. Shelters with the highest non-reclaimed dogs kill rates are as follows (excluding shelters taking few unclaimed dogs in):
Shelters with the highest maximum non-reclaimed dogs kill rates are as follows (excluding facilities that reported transporting many dogs in and taking very few unclaimed animals in):
Shelters Leave Animal Enclosures Empty While Dogs and Cats Die
New Jersey animal shelters fail to use their space to save animals. Based on the average number of animals at all of New Jersey’s animal shelters at the beginning and the end of 2019, only 57% of dog and 75% of cat capacity was used. Given December is a low intake month, I also increased these populations to an average intake month. This adjustment only raised the dog capacity utilization to 62%. While this adjustment did increase the cat capacity utilization to over 100%, it is highly unlikely this happened in reality. Shelter inspection reports I’ve reviewed often did not reveal significantly larger dog and cat populations in the summer and winter months. This is likely due to the influx of highly adoptable kittens having short lengths of stay and shelters killing cats with empty cages.
Many animal shelters with low kill rates failed to rescue animals with their excess space. Additionally, other shelters used little of their available space and still killed a large percentage of their animals. Some examples after increasing the population (and therefore capacity utilization) based on the adjustment discussed above are as follows:
Thus, many New Jersey animal shelters are killing dogs and cats despite having ample space to house these animals.
New Jersey’s animal shelters continue to fail the state’s animals. The state’s animal shelters only impound 8.9 dogs and cats per 1,000 New Jersey residents. If we just count animals originating from New Jersey, the state’s animal shelters only impound 7.2 dogs and cats per 1,000 people. As a comparison, Florida’s Lake County Animal Shelter took in 15.1 dogs and cats in 2019 and saved 99% of its dogs, 98% of its pit bull like dogs and 91% of its cats due to it fully implementing the No Kill Equation. Despite New Jersey shelters impounding a fraction of the animals many no kill communities take in on a per capita basis, the state’s animal control facilities continue to kill and allow animals to die under their care. Even worse, many of these shelters can’t even properly keep track of how many animals leave their facilities dead or alive. Our state’s animals deserve far better treatment than this. Contact your local city council members and mayor and demand better from the animal shelter serving your community. We can do so much better and it is time our shelters operate this way.
In 2018, New Jersey animal shelter statistics significantly improved. This decrease in killing was driven by decreased dog intake and increased numbers of cats returned to owners, adopted out, sent to rescues and released through TNR programs.
How did New Jersey animal shelters perform in 2019 compared to 2018? What caused these changes? What shelters had positive and negative impacts on the state’s kill rates in 2019?
Killing Decreased Modestly in 2019
The tables below summarize the statewide dog and cat statistics in 2019 and 2018. To see how I calculate the various metrics, please review the footnotes in this link and my blog analyzing the 2015 statistics. You can view the full 2019 statistics here and the statistics 2018 here.
The statistics reflect adjustments to remove dogs and cats quickly transported in and out of St. Hubert’s through its transport program. In the organization’s Sister Shelter WayStation program, the shelter effectively acts as a middle man between source and destination shelters. Therefore, it makes sense to exclude these dogs and cats from the various kill rate statistics below. If I did not exclude these animals, I would understate the dog and cat kill rates due to inflated numbers of intakes and outcomes. As a result, I removed all of St. Hubert’s dogs transferred out from the intake and outcome figures in the data below. Since St. Hubert’s primarily uses the Sister Shelter Waystation program to quickly transfer in cats and send them to out of state facilities, I only backed out the cats St. Hubert’s transferred to out of state organizations in the data below.
The dog statistics improved in 2019 with some metrics improving at a slower and faster rate. The dog kill rates decreased, but at about one third to two thirds the rate those kill rates decreased in 2018 verses 2017. On the other hand, the local kill rate metrics, which exclude out of state transported dogs, decreased by around 15% to 100% more in 2019 verses 2018 compared to 2018 verses 2017.
The cat statistics improved in 2019, but at a much slower rate than the prior year. Overall, the kill rate metrics decreased in 2019 verses 2018 around 15%-60% as much as the decreases in 2018 verses 2017.
While we’d like the kill rate decreases in 2019 verses 2018 to equal or exceed the decreases in 2018 verses 2017, I would note as shelters kill fewer animals, the remaining animals become more challenging to save. That being said, this data may suggest shelters need to invest more efforts in programs to get animals out of their facilities alive.
Decreased Intake Results in Fewer Killed Dogs
The statewide dog kill rate decreased due to New Jersey animal shelters taking fewer dogs in. New Jersey animal shelters reported killing 320 fewer dogs (208 dogs if we assume the animals in “Other” outcomes died). However, New Jersey shelters’ live outcomes, with the exception of owner reclaims, decreased significantly. Given New Jersey animal shelters fell far short of my dog adoption targets I set for 2018, these results are deeply disappointing. Therefore, New Jersey animal shelters killed fewer dogs due to these facilities taking fewer dogs in rather than saving more dogs.
The following shelters contributed most to the decrease in the statewide dog kill rate.
The table below provides insight as to why these shelters decreased the statewide dog kill rate the most. As you can see, the shelters, which are relatively large, had kill rates much greater than the state average in 2018 and those kill rates decreased significantly in 2019. All the shelters had fewer outcomes primarily due to decreased dog intake, but the decrease was not much different than the statewide decrease in intake.
The following table explains why most of these shelters’ kill rates decreased. All the shelters increased owner reclaims. While all the shelters, except for Trenton Animal Shelter, increased adoptions, these increases were more than offset by decrease in transfers to other shelters and rescues. Trenton Animal Shelter transferred more dogs, but its decrease in adoptions more than offset this. Overall, live outcomes went down in 2019 at these shelters, but the decrease was small enough relative to the decrease in total outcomes to reduce the statewide dog kill rate.
Other Shelters Increased the Statewide Dog Kill Rate
While the statewide dog kill rate dropped in 2019, several shelters partially offset this decrease. Specifically, the following shelters increased the dog kill rate, but this was more than offset by the facilities above.
The following table provides more details on these shelters. All three shelters’ kill rates increased in 2019 from levels that were under 10% in 2018
The table below explains why several of these shelters’ dog kill rates increased. Burlington County Animal Shelter transferred significantly fewer dogs to other shelters and rescues. Atlantic County Animal Shelter reported significantly fewer adoptions. While Liberty Humane Society’s live outcomes remained unchanged, total outcomes increased and live outcomes therefore made up a smaller percentage. Thus, these shelters inability to generate enough live outcomes led to increased kill rates.
Cat Killing Drops Due to Lower Intake
New Jersey animal shelters killed fewer cats in 2019 than in 2018. Overall, New Jersey animal shelters killed 696 less cats. If we count cats that died or went missing, the decrease in the number of cats who lost their lives in 2019 would probably not be as great. While the Shelter/Pound Annual Reports shelters fill out do not include a separate category for animals who died or went missing, shelters include these animals in the “Other” outcomes line. If we take out the cats from “Other” outcomes that certain shelters separately disclosed as TNR, “Other” outcomes (which should mostly represent cats who died or went missing) increased by 346 cats. Thus, shelters killed fewer cats in 2019, but more cats may have died or went missing.
The decrease in killing was driven by decreased cat intake. With the exception of owner reclaims, which increased modestly, live outcomes decreased. However, this decrease was outpaced by the large decrease in total outcomes that reduced the cat kill rate.
The following shelters decreased the statewide cat kill rate the most.
The following table provides insight as to why these shelters decreased the statewide cat kill rate the most. As you can see, all the shelters had high kill rates, which were 21% to 50%, in 2018, and all reported decreases in those kill rates during 2019. All the shelters had fewer outcomes, which was greater on a percentage basis than the decrease statewide, primarily due to decreased cat intake. Therefore, these higher kill shelters made up a smaller portion of cat outcomes in the state and that partially decreased the statewide cat kill rate in 2019.
The table below explains why these shelters’ kill rates decreased. Overall, all the shelters either modestly increased their live outcomes (i.e. Gloucester County Animal Shelter and Southern Ocean County Animal Facility) or reported fewer live outcomes. AHS-Newark did adopt more cats out, but this were more than offset by reduced transfers. As a result, these shelters decreased their kill rate by reducing cat intake rather than generating more live outcomes.
We must also be highly skeptical of AHS-Newark’s data. As the shelter’s data shows, AHS-Newark had 229 unaccounted for cats in 2019 and its kill rate decrease was less than half as great when we look at the metric taking these unaccounted for cats into account. Given serious allegations of mismanagement have been raised again recently, we should scrutinize the shelter’s data.
Other Shelters Increased the Statewide Cat Kill Rate
While the statewide cat kill rate decreased in 2019, several shelters partially offset this decrease. Specifically, the following facilities increased the cat kill rate, but this was more than offset by the shelters above.
The following table provides more details on these shelters. All the shelters had higher cat kill rates in 2019 compared to 2018. In addition, Burlington County Animal Shelter’s and Vorhees Animal Orphanage’s kill rate rates increased by 6% and 5% and were over 20% in 2019.
The table below explains why these shelters’ kill rates increased. Burlington County Animal Shelter adopted out and transferred significantly fewer cats in 2019. While Homeward Bound Pet Adoption Center and Vorhees Animal Orphanage generated more live outcomes in 2019, this did not keep up with the significant increase in animal outcomes/intake.
Shelters Impound Less Dogs and More Cats
The tables below detail the change in dog and cat intake at New Jersey shelters in 2019 verses 2018. I removed all St. Hubert’s transfers out from the out of state dog rescue figures and St. Hubert’s out of state transfers out from its in state cat rescue figures based on the reasoning discussed above.
Overall, New Jersey animal shelters took in 2,583 less dogs during 2019 than in 2018. New Jersey animal shelters took in over 850 fewer stray dogs during 2019 than in 2018. The state’s shelters took 3% fewer dogs in as owner surrenders and 6% fewer stray dogs. While managed intake programs can decrease owner surrenders, they do not affect stray numbers. Therefore, the decrease in stray dog intake may be related to decreased animal control efforts, animal control officers returning dogs to owners in the field (not counted as shelter intake) or simply fewer stray dogs. If ACOs really are not impounding dogs that need help or ones that are a public safety threat, that does not help people or animals. As a result, we should monitor this number in the future and determine why stray dog intake is decreasing.
New Jersey animal shelters rescued far fewer dogs after making the St. Hubert’s adjustment described above. While rescues from New Jersey shelters decreased, the decrease was less than the overall dog intake decrease. On the other hand, out of state transports into New Jersey shelters decreased by 18%.
While New Jersey animal shelters took in 16% fewer dogs due to cruelty cases, bite cases and other reasons in 2019, shelters still took in more dogs for these reasons than in any of the five prior years. On August 1, 2018, county prosecutors along with local police took control over animal cruelty law enforcement. While we can’t definitively state this caused the increase in this other category of dog intake, it seems like this may be the case. Typically, other sources of intake in this category, such as bite cases and puppies born in shelters, are not large and do not vary much. Thus, animal advocates should monitor this figure to see how the new animal cruelty law enforcement system is working.
New Jersey animal shelters impounded slightly fewer cats in 2019 than in 2018. With the exception of a slight increase in strays, all other types of cat intake significantly decreased. In particular, cats rescued from both New Jersey and out of state shelters significantly decreased. As with dogs, the other types of cat intake in 2019 decreased from the 2018 level, but was in the upper part of the range of the amounts from 2013 through 2017 after removing Bergen County Animal Shelter’s other intake figure (this shelter appeared to classify many cats brought in for TNR in this category in several years). As a result, the new animal cruelty law enforcement system may also be having a positive effect.
Advocacy Works
Clearly, growing animal advocacy efforts are pressuring shelters to improve. Individuals contacting their elected representatives puts pressure on shelters to do better. Similarly, donors communicating their concerns to privately run facilities also makes it difficult for these organizations to not make positive changes. Most importantly, this pressure provides strong incentives to these shelters to work with boots on the ground animal advocates, such as TNR groups, rescues and shelter volunteers. Thus, the synergistic efforts of no kill advocates and people working directly with animals helped drive the state’s improved animal sheltering statistics.
That being said, the reduced positive outcomes for dogs and cats is a troubling sign. Shelters can’t permanently rely on fewer animals coming in to reduce killing. Instead, they must enact the 11 No Kill Equation programs to generate more live outcomes. Specifically, New Jersey animal shelters must invest in behavioral programs to treat dogs who need help and do a much better job adopting out dogs. Additionally, these shelters must enact better medical protocols for cats and implement large scale TNR and Return to Field programs. Otherwise, shelters will reach a plateau and not increase their live release rates anymore.
March 11, 2020 Update: I revised this blog for additional data I had received. While the dog statistics improved slightly, the overall conclusions remain the same. The additional cat data suggests St. Hubert’s had a good cat live release rate as opposed to my previous uncertain conclusion. However, St. Hubert’s cat live release rate was largely driven by a very high amount of rescue assistance.
Newark and Large Animal Welfare Organizations Exclude Animal Advocates from Process to Replace AHS-Newark
After AHS-Newark decided to stop taking in Newark’s homeless animals, Newark officials scrambled for a solution. During October 2018, Newark officials considered sites to build a city owned shelter. Two of those sites are listed below.
Additionally, Newark’s then Deputy Mayor and Director of Economic and Housing Development, John Palmieri, stated a shelter would cost $15 million, which would be funded by municipal bonds. Furthermore, the Newark official said the city could get the shelter built within 15-18 months. However, Mr. Palmieri noted finding an operator was an issue given Best Friends declined to run a city owned shelter.
On October 31, 2018, Newark held a meeting with large animal welfare organizations. As you can see below, the attendees included two St. Hubert’s executives, the Humane Society of the United States New Jersey Director, Best Friends Northeast Regional Director, Liberty Humane Society’s Executive Director, New York City Mayor’s Office Animal Welfare Liasion and several members of the Newark Department of Health and Community Wellness. Most notably, the meeting did not include a single animal advocate.
What kind of job did St. Hubert’s do with Newark’s homeless animals? Did St. Hubert’s live up to the progressive ideals it portrays to the public? What effect will the St. Hubert’s and other animal welfare organizations’ arrangement have on Newark’s homeless animals in the future?
Data Reviewed
In order to get a better understanding of the job St. Hubert’s did with Newark’s homeless animals, I requested the intake and disposition records for each individual dog and cat the shelter took in from Newark during its contract term. Unfortunately, the City of Newark did not give me records for every animal. However, I did get records for a significant number of animals that gave me an understanding of how St. Hubert’s handled the Newark contract. You can see those records here and here.
St. Hubert’s Kills Large Number of Newark’s Homeless Dogs
St. Hubert’s had large percentages of their Newark dogs lose their lives. Overall, 35% of all dogs who had known outcomes lost their lives. If we just look at dogs who were not reclaimed by owners, 54% of all these dogs lost their lives. As a comparison, Austin Animal Center only had 1% of its dogs and 2% of its nonreclaimed dogs lose their lives in 2018. Thus, St. Hubert’s had its Newark dogs lose their lives at 35 times and 27 times Austin Animal Center’s rates for all dogs and nonreclaimed dogs.
St. Hubert’s also had too many small dogs and other medium to large size breeds from Newark lose their lives. Overall, the shelter had 18% of small dogs and 25% of other medium to large size breeds with known outcomes lose their lives. Frankly, shelters should be able to save nearly all small dogs due to the fact such animals cannot seriously injure dog savvy adult owners. Even the Elizabeth Animal Shelter, which is far from a progressive facility, only had 1% of small dogs lose their lives in 2017. Austin Animal Center only had 1% of small dogs and 1% of other medium to large size breeds lose their lives in 2018. Thus, St. Hubert’s had both small dogs and other medium to large size breeds lose their lives at 18 times and 25 times Austin Animal Center’s rates.
Since St. Hubert’s did not have known outcomes in many of the records provided to me, it is useful to do an adjusted analysis assuming some of the ending population animals were adopted out. The table below assumes all dogs placed into foster homes or dogs adopted on a trial basis were adopted out. Under these assumptions, the death rates for all dogs, pit bulls, small dogs and other medium to large size dogs were 29%, 39%, 14% and 21%. The nonreclaimed death rates using these assumptions were 40%, 53%, 17% and 38% for all dogs, pit bulls, small dogs and other medium to large size dogs. Thus, St. Hubert’s Newark dog statistics were still terrible even when assuming large numbers of dogs were adopted out.
The final dog analysis assumes St. Hubert’s adopted out all Newark dogs in the ending population. While I believe this is unrealistic, it is useful to see how St. Hubert’s performed using the most generous assumption. Under this assumption, the death rates for all dogs, pit bulls, small dogs and other medium to large size breeds were 16%, 20%, 9% and 13%. The nonreclaimed death rates using these assumptions were 19%, 23%, 11% and 17%. Thus, St. Hubert’s Newark dog statistics were still awful even when the shelter received the most favorable assumption.
Cat Data Suggests Good Performance Due to Rescue Assistance
St. Hubert’s overall Newark cat statistics indicated death rates were slightly high. Overall, 11% of all cats, 11% of adult cats and 13% of kittens with known outcomes lost their lives. The nonreclaimed death rate was 13% for all cats, adult cats and kittens.
St. Hubert’s Newark cat statistics assuming live releases for all cats who were adopted out on a trial basis or placed into foster homes were good. Overall, the death rates using these assumptions for all cats, adult cats and kittens were 8%, 10% and 4%. The nonreclaimed death rates were 9% for all cats, 12% for adult cats and 4% for kittens.
The data suggests transfers to rescues and/or other shelters played a significant role. Overall, transfers to other organizations exceeded adoptions for both all cats and adult cats. For adult cats, transfers exceeded adoptions by nearly a 3 to 1 margin. If some of the trial adoptions and animals sent to foster homes ultimately were transferred and not adopted out, transfers to rescues and/or other shelters would have played an even larger role. Thus, St. Hubert’s seemed to disproportionately rely on other organizations to save the cats it took in from Newark.
St. Hubert’s cat statistics assuming all cats with no known outcomes were adopted out were very good. Overall, the death rates using this assumption for all cats, adult cats and kittens were 5%, 6% and 4%. The nonreclaimed death rates were 6% for all cats, 7% for adult cats and 4% for kittens. However, this generous assumption likely is not right since shelters frequently kill cats who stay at shelters for longer periods.
St. Hubert’s Absurd “Community Outreach” Claim
St. Hubert’s asserted Newark had a “pet overpopulation” problem and the organization was “dedicated to getting to the root cause” of it in its Spring 2019 newsletter. Newark Animal Control’s data showed AHS-Newark impounded 3,281 dogs and cats from Newark or 11.6 dogs and cats per 1,000 people during a 12 month period in 2017-2018. As a comparison, no kill communities in Kansas City, Missouri, Lake County, Florida and Austin, Texas took in 21.8, 17.4 and 15.1 dogs and cats per 1,000 people in 2019. Thus, St. Hubert’s claim that Newark has a “pet overpopulation” problem is not true since communities taking in significantly more animals on a per capita basis and in total achieved no kill.
St. Hubert’s attempt to solve this so-called “pet overpopulation” problem was inadequate. In that same newsletter, St. Hubert’s stated it provided free spay/neuter to 238 cats (who they said were mostly outdoor or community cats) and 33 dogs during a one time event. While I’m happy St. Hubert’s offered this service, these numbers would never make a dent in the dog or community cat population in Newark. Based on the methodology from St. Hubert’s own analysis from May 2014, the City of Newark should have between 20,896 and 47,015 community cats and 22,311 dogs. Therefore, St. Hubert’s spay/neuter effort would have sterilized 0.5% to 1.1% of Newark’s community cats and 0.1% of the city’s dogs. While a St. Hubert’s press release stated a slightly higher number of dogs and cats received free spay/neuter services (375 animals), this would only modestly increase these percentages. Based on a recent study showing sterilization rates of 60%-80% of a community cat population being needed to make a substantial reduction in the population, St. Hubert’s spay/neuter efforts clearly were not sufficient. Similarly, the low percentage of the Newark dog population sterilized at the clinic also shows this will have no real effect on dog intake at AHS-Newark. While St. Hubert’s claimed they would do more clinics if they got funding, I’ve not seen the organization make a substantial effort at doing this. Thus, St. Hubert’s spay/neuter effort is a public relations ploy rather than an effective no kill strategy.
Dog Data Consistent with St. Hubert’s Killing “Rescued” Newark Dogs
Recently, St. Hubert’s shocked animal advocates after it killed four dogs it “rescued” from AHS-Newark. St. Hubert’s killed the four dogs, Avery, Sumo, Bowser and Andy, after holding the animals for just 18 days. While St. Hubert’s claimed these dogs were severely dog aggressive, all the dogs were Associated Humane Societies-Newark “event” dogs. When I was a volunteer at AHS-Newark, we typically took the best behaved dogs to adoption events due to the obvious behavior challenges these events posed (i.e. many people, other dogs, etc.). As you can see in the pictures below, and by the fact these dogs participated well in these events, St. Hubert’s reasoning makes no sense. Additionally, AHS Assistant Executive Director, Ken McKeel, also came to the conclusion that these dogs could have been placed. Furthermore, animal welfare groups saved nearly every dog from the Michael Vick dog fighting case (i.e. proving organizations can even safely place many dogs used for fighting). Given St. Hubert’s operates a huge dog training facility, this organization had more than enough resources to do great things for these dogs.
The reality is St. Hubert’s did virtually nothing, but poison these dogs to death. How do I know? The shelter killed ALL four dogs on the same exact day after less than three weeks in their so-called shelter. In fact, the AHS Assistant Executive Director stated St. Hubert’s would not place these dogs after just nine days. Frankly, it defies logic that St. Hubert’s would conclude ALL four dogs were beyond help at the exact same time and after such a short period.
Clearly, New Jersey legislators, animal advocates and animal welfare organizations should not consider St. Hubert’s an authority on any animal sheltering issues. Simply put, St. Hubert’s is controlled by an out of state organization looking to make itself, and its CEO who made $335,698 in fiscal year ending September 30, 2018, rich rather than helping New Jersey animals.
Simply put, St. Hubert’s views large dogs, particularly pit bulls, as expendable. St. Hubert’s own data from its Newark contract, its treatment of Avery, Sumo, Bowser and Andy prove that.
St. Hubert’s and National Animal Welfare Groups Enable AHS-Newark to Continue Doing Business as Usual
While I believe the national organizations involved in getting St. Hubert’s the Newark animal sheltering contract had good intentions, the end result made things worse for the city’s homeless animals. In November 2018, the City of Newark faced immense pressure to replace AHS-Newark. Given the very public and heated dispute between the City of Newark and AHS-Newark at this time, the City of Newark was unlikely to continue contracting with AHS-Newark. In other words, the City of Newark would likely have had to come up with an alternative, including running the shelter itself. Thus, the national organizations and St. Hubert’s brokered a deal that allowed the City of Newark to avoid taking this necessary action.
Unfortunately, St. Hubert’s own data and actions prove it never wanted to solve Newark’s animal sheltering crisis. Instead, it got some good news headlines and gave the City of Newark and AHS-Newark the political cover to continue contracting. After six months and St. Hubert’s abruptly walking away from its arrangement, the City of Newark made the case AHS-Newark changed and could be a viable sheltering solution:
The Associated Humane Societies (AHS) has a new board and both a vision and approach to achieving its mission to support the health and welfare of animals at risk,” said Dr. Wade. We are looking forward to a progressive relationship with them as we continue to canvass the city for a facility and location that would be appropriate for animal sheltering and in turn provide us with a long term solution.
As with past promises to build a new shelter, the City of Newark is unlikely to act without a sheltering crisis. Based on the New Jersey Department of Health’s refusal to inspect any animal shelters in over a year, we will probably not get the state health department to inspect AHS-Newark anytime soon. Since bad inspections historically drove media coverage of failing shelters, the City of Newark will face no pressure to replace AHS-Newark.
“I can unequivocally state that I was disappointed with my expectations of support, and an ongoing antiquated culture by certain members of the board,” Russotti said. “I did meet with internal resistance and undermining to my progressive initiatives which were supported by respected animal welfare organizations and the community.”
Not allowing rescues to pull more adoptable pets will lead to these animals staying at the shelter longer and cause less resources to go towards saving the harder to adopt animals.
It will increase the shelter’s average length of stay (since AHS-Newark does a poor job with adoptions) and that will result in more sick animals and pets with behavior issues.
Rescues are not likely to pull more hard to adopt animals just to get some easier to adopt pets. These rescues will simply go to other shelters.
AHS-Newark is destroying its relationship with rescues who it will desperately need when the shelter becomes full.
Many rescues will likely not pull animals since they have to make an appointment with an organization that is notoriously difficult to deal with.
With Roseann Trezza’s two year probation period barring her from officially running AHS-Newark expiring this spring, AHS-Newark will likely continue its decades long practice of regressive sheltering. Furthermore, AHS-Newark now receives around 50% more money from the City of Newark than before the St. Hubert’s contract. As such, AHS-Newark will surely feel emboldened to do whatever it wants.
Clearly, the St. Hubert’s debacle proves the animal shelter establishment in New Jersey and the United States cannot implement real shelter reform. Instead, as in most no kill communities, no kill advocates must engage in a long political campaign to force Newark and the other AHS-Newark contracting municipalities to create a real no kill shelter.
In a blog from earlier this year, I disclosed New Jersey’s depressing animal shelter statistics. This blog explains why so many dogs are losing their lives in the state’s animal shelters and whether these facilities can end the killing.
Successful organizations set measurable goals and regularly monitor their performance. Examples include financial budgets, customer and employee satisfaction surveys, and product reliability metrics. Unfortunately, many animal shelters for far too long have failed to set lifesaving goals and standards. Municipalities, donors and volunteers need to know where their resources will be best utilized. Time and money are scarce resources and people should allocate these assets to organizations who will best utilize them. As a result, animal shelters need to set goals and hold their leadership and staff accountable for achieving these objectives.
Model Assesses New Jersey Animal Shelters’ Life Saving Performance
In order to assess how good of a job New Jersey animal shelters are doing, I’ve developed an analysis I call the “Life Saving Model.” While shelter performance is dependent on many variables, such as finances, facility design, local laws, etc., the most critical factor impacting potential life saving is animal holding capacity. Without having enough physical space and foster homes, a shelter might not have enough time to find loving homes for its animals. Shelters can overcome financial limitations through creative fundraising or recruiting more volunteers. Similarly, organizations can save their dogs despite having run down facilities if these groups enthusiastically implement policies to get animals into loving homes quickly. As a result, my analysis focuses on making the best use of space to save the maximum number of New Jersey and nearby states dogs.
The Life Saving Model measures the number of local animals a shelter should adopt out, rescue from other facilities, send to rescues or other shelters, and euthanize. The targeted outcomes take into account each facility’s physical capacity plus the amount of foster homes it should use and the number and types of dogs the organization receives from its community (i.e. strays, owner surrenders, cruelty/bite cases). I assume a target euthanasia rate, take the number of dogs actually returned to owners and then estimate how many community dogs a shelter should adopt out. To the extent space runs out, I then calculate how many dogs the shelter must send to rescues. If the shelter has excess space after properly serving its local community, the facility uses that room to rescue and adopt out dogs from nearby areas. The targeted results calculated from this model are compared to the actual or estimated actual results from each shelter below.
This year I expanded shelter capacity to include the number of foster homes shelters should use. Based on a target American Pets Alive and other progressive shelter directors communicated at this year’s American Pets Alive Conference, shelters should have 3% of their annual dog intake in foster homes at any one time. These estimates are based on what several no kill animal control shelters already accomplish. Given fostering increases capacity and provides more humane care to animals, it is critical shelters have large scale foster programs. Therefore, I added 3% of each shelter’s annual dog intake to the shelter’s physical capacity.
For shelters with animal control contracts, I place 10% of all dogs that are not reclaimed by owners into the targeted sent to rescue category. Austin Pets Alive used data from Austin Animal Center, which is the local municipal shelter, to determine large dogs with behavioral challenges are part of the last 10% of animals losing their lives. While shelters can save most of these dogs through behavioral rehabilitation and/or foster programs, I decided to put an estimate of these dogs into the sent to rescue category since that is another good outcome for these dogs.
My analysis puts a cap on the targeted numbers of dogs rescued from other shelters and adoptions. While my unmodified targeted numbers of rescued and adopted animals are quite achievable, I want to provide very conservative goals for New Jersey animals shelters. For example, the unmodified model resulted in a statewide per capita dog adoption rate of around 25% to 70% of the level found at some of the nation’s best animal control shelters. Similarly, the unmodified model yielded a statewide pit bull per capita adoption rate (2.3 pit bulls per 1,000 people) that is not much more than the pit bull per capita adoption rate at one of the best animal control shelters in the country. In my opinion, New Jersey shelters could more easily achieve that per capita pit bull adoption rate given my model includes far fewer dogs from competing breeds than those in this role model animal control shelter.
My modified analysis capped pit bull adoptions at 2 pit bulls per 1,000 people within each New Jersey county. In other words, the targeted numbers of dogs rescued from other shelters and adopted below are the lesser of
Number predicted by model
Number determined by capping pit bull adoptions at 2 pit bulls per 1,000 people in the county
In simple terms, a shelter is expected to achieve this per capita adoption rate unless the facility lacks enough space. If a shelter does not have sufficient room, it won’t have the time to reach all the potential adopters and requires assistance from rescues and/or other facilities. Given my model assumes 80% of rescued dogs are pit bull like dogs, my targeted numbers of dogs rescued and adopted are quite low as detailed in the section below. For example, shelters in counties where dog adoptions are capped have extra space that they do not use to adopt out other dog breeds.
To read specific details and assumptions used in the model, please see the Appendix at the end of this blog.
New Jersey Animal Shelters Contain Enough Space to Save All of New Jersey’s Dogs and Many More from Other States
New Jersey’s animal shelter system has enough space to save all of the state’s healthy and treatable dogs. The table below details the targeted numbers of dog outcomes the New Jersey animal shelter system should achieve. Out of the 21,614 New Jersey dogs coming into the state’s animal shelters in 2018, 10,684 and 1,619 dogs should have been adopted out and sent to other shelters/rescues by the facilities originally taking the dogs in. However, other New Jersey animal shelters had more than enough capacity to rescue the 1,619 dogs from space constrained facilities. Thus, New Jersey animal shelters should be able to able to adopt out every single healthy and treatable dog taken in from the state and not require any support from rescue organizations without physical facilities from a space perspective.
New Jersey animal shelters have enough excess space to save many dogs from out of state as well. Specifically, New Jersey animal shelters had enough physical capacity to rescue and adopt out 11,394 dogs from out of state after achieving a 95% live release rate for New Jersey dogs. To put this number into perspective, New Jersey animal shelters could make both New York City and Philadelphia no kill cities for dogs and increase those cities’ dog live release rates to 95% in 2018 as follows:
New York City – 1,288 additional dogs need saving
Philadelphia – 856 additional dogs need saving
Additionally, New Jersey animal shelters could save another 9,250 dogs from other locations outside of the state. Of course, some New Jersey animal shelters do pull some dogs from New York City and Philadelphia animal control shelters. However, most of these dogs are likely easy to adopt and therefore have short lengths of stay. As a result, the additional number of dogs New Jersey animal shelters could save from New York City, Philadelphia and elsewhere is probably not much lower than the figures above. Thus, New Jersey animal shelters could make New Jersey a no kill state for dogs as well as many other places.
These adoption goals are quite achievable when comparing the performance of well-run animal control shelters across the country. New Jersey animal shelters would only need to adopt out 2.7 dogs per 1,000 people in the state (1.4 dogs if no dogs rescued from out of state). As a comparison, recent per capita dog adoption numbers from several high performing no kill open admission shelters are as follows:
Lynchburg Humane Society (Lynchburg, Virginia) – 15.3 dogs per 1,000 people
Longmont Humane Society (Longmont, Colorado area) – 9.4 dogs per 1,000 people
Lake County Animal Shelter (Lake County, Florida) – 5.2 dogs per 1,000 people
Williamson County Animal Shelter (Williamson County, Texas) – 5.0 dogs per 1,000 people
Thus, many communities are already adopting out around two to six times as many dogs as the goal set for New Jersey animal shelters.
Some naysayers may claim New Jersey would have a more difficult time due to the state’s shelters taking in many pit bulls. However, this is a myth. My model estimates New Jersey animal shelters would need to adopt out roughly 0.5 pit bulls per 1,000 people to save 95% of New Jersey’s dogs. Our shelters would only need to adopt out around 1.5 pit bulls per 1,000 people if New Jersey shelters also rescued and adopted out the targeted number of pit bulls from other states. As a comparison, I estimate Longmont Humane Society adopts out 2.0 pit bulls per 1,000 people based on the number of pit bulls impounded in 2014 as a percentage of total dogs impounded in 2014 and multiplying that number by the 9.4 dogs per 1,000 people adoption rate in 2018. Furthermore, the pit bull adoption targets are even more reasonable given the model assumes there are roughly 1/6 of the number of dogs from other breeds to compete with in the New Jersey adoption market compared to the Longmont, Colorado area.
Animal Deaths Vary Widely at New Jersey Animal Shelters
The goal of any properly managed animal shelter is to save all of its healthy and treatable animals. In some cases, such as selective admission rescue oriented shelters, it is pretty easy to not kill animals. In addition, other animal shelters with easy to service animal control contracts (i.e. few animals impounded, most strays quickly returned to owners) can avoid unnecessary killing due to having lots of extra space. As a result, some shelters may have an easier time than others in preventing killing at their shelters.
The tables below detail how many dogs should lose their lives at each state animal shelter per my model and the actual numbers of dogs that did. All missing or lost dogs are assumed “dead” based on the assumption they died or went to a very bad place. Based on my review of a number of shelters’ underlying documents, virtually all of the dogs in the “Other” outcome category died or went missing. Shelters having the number of dogs losing their lives at or below my targets and above my targets are highlighted in green and red in the tables below.
The largest number of dogs unnecessarily dying occurred at a relatively small number of shelters. Overall, 1,108 dogs needlessly lost their lives at New Jersey animal shelters in 2018 (i.e. the sum of all shelters killing too many dogs). 13 out of 92 or 14% of the shelters accounted for 83% of the dogs unnecessarily losing their lives under the model’s assumptions. Associated Humane Societies’ three shelters needlessly killed 219 dogs per the model or 20% of the total dogs unnecessarily dying in the state’s shelters. Trenton Animal Shelter, Gloucester County Animal Shelter, Bergen County Animal Shelter and Paterson Animal Control, which all broke state law in recent years, needlessly killed 335 dogs per the model or 30% of the total dogs unnecessarily dying in the state’s shelters. Shelters with the greatest number of unnecessary dog deaths (assuming all dogs killed were local animals) are as follows:
Associated Humane Societies – Newark (158)
Trenton Animal Shelter (142)
Gloucester County Animal Shelter (121)
St. Hubert’s – Madison (116)
Humane Society of Atlantic County (69)
South Jersey Regional Animal Shelter (58)
Homeward Bound Pet Adoption Center (53)
Atlantic County Animal Shelter (39)
Paterson Animal Control (38)
Bergen County Animal Shelter (34)
Thus, the bulk of the dogs unnecessarily dying at New Jersey animals shelters occurs at a small number of facilities.
Most New Jersey Animal Shelters Require Little Rescue Assistance
Some animal shelters will require more support from rescues and animal shelters with excess space than others. If a shelter has relatively high intake, very limited space, and few stray dogs returned to owners, it will need more help than other shelters. In an ideal world, rescues would take all shelter animals. However, due to limited numbers of foster homes, lesser ability to find foster homes due to many rescue organizations’ small sizes, and most rescues’ restrictive adoption policies, all shelters cannot heavily rely on rescues. The tables below compare the number of dogs a shelter should transfer to other organizations per the model and the number of dogs actually sent to other animal welfare groups. Shelters marked in green are receiving less than the expected rescue support while facilities marked in red are receiving too much rescue help.
Overall, most New Jersey animal shelters require little rescue support if space-constrained facilities fast-track their most highly adoptable dogs. Shelter medicine experts advocate prioritizing the processing of highly adoptable animals to make the best use of space and reduce disease. For example, making sure these animals are the first to get spayed/neutered and vaccinated and receive microchips to ensure they can leave as soon as the shelter finds a good home.
51 shelters received too much help, 17 facilities received just enough assistance and 24 shelters received too little help from other animal welfare organizations. However, the excess dogs rescued (1,940 dogs) at shelters receiving too much assistance was far higher than the rescue deficits at other shelters (237 dogs) resulting in the state’s shelters sending 1,703 more dogs than needed to rescues and other animal welfare organizations. Some shelters, such as Elizabeth Animal Shelter and Paterson Animal Control, report transfers to rescues and other shelters as adoptions. While I made adjustments for these facilities based on my reviews of these facilities underlying records in past years, its certainly possible other shelters incorrectly reported their data (i.e. counting animals sent to rescues as adoptions). Nonetheless, the New Jersey shelter system as a whole is receiving enough rescue assistance, but some shelters are hurt by rescues pulling animals from less needy facilities.
Rescue groups and shelters with extra space should pull dogs from kill shelters with the highest rescue “target” numbers and deficits in the tables below. If shelters not needing rescue support get that extra help, these shelters will not take the steps necessary to properly run their facilities. As a result of enabling poorly performing shelters and not pulling dogs from truly space constrained facilities, rescuing dogs from shelters with enough space leads to less lifesaving.
Shelters receiving less than needed rescue support should also examine their own policies and performance. Are the shelter’s operating processes allowing too many animals to get sick and therefore discouraging organizations to rescue their animals due to subsequent medical costs? Does the shelter actively reach out to rescues/other shelters and treat them with respect? Does the shelter make it convenient for other organizations to pull their animals?
Given killing animals for space is intolerable, the space-constrained shelters need to expand their effective dog capacity. These facilities could use extra space in their buildings to house dogs on a short-term basis. These shelters can enter into arrangements with local veterinarians to house and adopt out some dogs. Additionally, creating a pet owner surrender prevention program, implementing a proper managed intake policy (i.e. where animals are impounded when in danger and waiting periods for owner surrenders are relatively short) and making serious efforts to return lost dogs to owners could free up space in these shelters. Finally, space-constrained shelters with multiple animal control contracts should terminate some of these arrangements to bring their capacity for care in line with the number of dogs they take in. As a result, space constrained shelters still need to take active steps to reduce killing rather than simply solely relying on rescue support.
In certain circumstances, it may make sense for shelters with excess space to send dogs to rescues. For example, a unique breed or a dog needing very specialized behavioral or medical rehabilitation. However, these cases are accounted for in my targeted sent to rescue figures for animal control shelters.
Most New Jersey Animal Shelters Fail to Come Close to Reaching Their Local Dog Adoption Potential
We can assess each shelter’s contribution to making New Jersey and nearby areas no kill. While a shelter may be able to avoid killing healthy and treatable animals, it still may not live up to its potential for adopting out local dogs. On the other hand, a space constrained shelter may kill healthy and treatable dogs, but still do a good job adopting animals out.
The tables below compare the number of dogs from New Jersey and nearby states each animal shelter should adopt out with the estimated number of local dogs actually adopted out.
Many rescue oriented shelters likely pull much easier to adopt dogs than the bulk of dogs needing to get rescued from local facilities. Thus, the results from rescue oriented shelters may look better than they actually are.
Few organizations reached or exceeded their adoption targets. Specifically, only 4 out of 92 shelters met the adoption goals computed by the Life Saving Model. Thus, the overwhelming number of New Jersey animal shelters need to step up their adoption efforts.
A number of other rescue oriented shelters exceeded their adoption targets, but this may at least partially be due to inaccurate records and the types of dogs they impounded. Common Sense for Animals operates more like a rescue oriented than an animal control shelter. While this organization exceeded its adoption targets, the shelter’s figures were off by 128 dogs using the methodology outlined in another blog. Beacon Animal Rescue also exceeded its adoption target, but this is likely due to this organization rescuing easier to adopt dogs from New Jersey shelters. Thus, I believe these rescue oriented shelters’ high local dog adoption numbers were due to inaccurate records or these organizations selecting easier to adopt local dogs.
Tri-Boro Animal Welfare’s and St. Hubert’s-Noah’s Ark’s higher than targeted local dog adoption results are a bit misleading. These facilities benefited from the method I used to cap adoptions in the county and reduce the adoption targets for these two shelters. For example, Tri-Boro Animal Welfare only reached 52% of its adoption target using my unadjusted model only taking the shelter’s physical space and targeted number of foster homes into account. Similarly, St. Hubert’s Noah’s Ark’s actual adoptions percentage of its targeted adoptions figure dropped from 271% to 111% when I looked at the unadjusted model. Since Morris County has many shelters that collectively have a very large capacity (i.e. very high adoption potential), my model reduces all Morris County animal shelters’ target adoptions to my county adoption cap. Therefore, these two shelters have relatively low dog adoption targets. Additionally, St. Hubert’s-Noah’s Ark may rescue a number of dogs from other St. Hubert’s facilities and those dogs may come from out of state. Thus, these shelters really didn’t do an excellent job adopting out local dogs.
Shelters adopting out the fewest animals in total relative to their targets were as follows:
Associated Humane Societies-Newark – 1,222 fewer dogs adopted than targeted
Monmouth SPCA – 775 fewer dogs adopted than targeted
Associated Humane Societies-Popcorn Park – 579 fewer dogs adopted than targeted
Plainfield Area Humane Society – 532 fewer dogs adopted than targeted
Tyco Animal Control – Paramus – 442 fewer dogs adopted than targeted
Burlington County Animal Shelter – 441 fewer dogs adopted than targeted
Trenton Animal Shelter – 396 fewer dogs adopted than targeted
Gloucester County Animal Shelter – 388 fewer dogs adopted than targeted
Paterson Animal Control – 387 fewer dogs adopted than targeted
Bergen County Animal Shelter – 384 fewer dogs adopted than targeted
St. Hubert’s – Madison – 281 fewer dogs adopted than targeted
Shake a Paw-Union – 281 fewer dogs adopted than targeted
Greyhound Angels – 278 fewer dogs adopted than targeted
New Jersey Humane Society – 250 fewer dogs adopted than targeted
Several shelters’ poor performance is quite predictable. Associated Humane Societies-Newark, Trenton Animal Shelter, Paterson Animal Shelter, Shake a Paw-Union, New Jersey Humane Society, Gloucester County Animal Shelter, Monmouth SPCA and Bergen County Animal Shelter had troublesome stories involving the shelters and/or prominent people affiliated with these organizations over the last several years. Tyco Animal Control-Paramus performed poorly due to this for profit company having a regressive view of animal sheltering. Shake a Paw-Union’s low local adoption numbers are also not surprising since it also operates a for profit pet store and transports almost all of its dogs it rescues from out of state. Similarly, St. Hubert’s-Madison, Monmouth SPCA, Greyhound Angels (due to it being a greyhound rescue oriented shelter) and Montclair Township Animal Shelter all transported in many dogs from outside of New Jersey during 2018. Burlington County Animal Shelter had a 200 local dog adoption decrease in 2018 due primarily to the facility sending more dogs to rescues and other shelters. Finally, Plainfield Area Humane Society’s local dog adoption deficit is quite disturbing since this organization could easily take on Plainfield’s dogs who currently go to the horrific and high kill Associated Humane Societies-Newark.
Shelters Fail to Use Excess Space to Save Local Dogs
To further examine New Jersey animal shelters’ performance in saving the state’s homeless dogs, I compared the targeted number of dogs each shelter should pull from nearby shelters and compared it to the number actually rescued from local facilities. I assume all reported out of state rescued dogs came from southern states or other far away places. While some of the out of state rescued dogs may have comes from nearby areas, I believe this is a small number and does not significantly impact the results.
Virtually all New Jersey animal shelters are failing to rescue the number of local dogs they should. 89 of the 92 shelters should rescue some dogs from other local shelters. In fact, 45 of the 89 shelters with targeted excess capacity failed to rescue even a single dog from a New Jersey animal shelter. Of the 89 shelters that should have rescued dogs, only four shelters met or exceeded their local dog rescue targets. However, three of those shelters, Beacon Animal Rescue, St. Hubert’s-Noah’s Ark and Tri-Boro Animal Welfare, may not have truly helped the number of medium to large size local dogs they should based on these shelters taking easier to adopt animals and possibly out of state animals (i.e. St. Hubert’s-Noah’s Ark may have rescued out of state transported dogs from other St. Hubert’s facilities that originally came from the south).
As mentioned above, many shelters local rescue numbers are inflated due to these organizations cherry picking highly adoptable animals to rescue. Thus, nearly all New Jersey animal shelters with targeted excess capacity are failing to do their share in ending the killing of local healthy and treatable dogs.
Shelters can overcome challenges in rescuing dogs from outside their service area. In some cases, municipalities may frown on government run shelters using taxpayer funds to rescue dogs from elsewhere. However, shelter directors at these facilities can encourage individuals to form a non-profit or raise money on their own to pay for these rescued dogs. Additionally, shelters with limited capacity or even some of the well-off private shelters could contribute funding for each dog rescued. For example, Maddie’s Fund paid an approximate $160 subsidy to rescues pulling dogs from New York Animal Care & Control. Similarly, private shelters with excess space, but limited financial resources, could expand their fundraising efforts to save more local dogs. Thus, perceived obstacles to rescuing local dogs can and should be overcome.
New Jersey Animal Shelters Need to Form Life-Saving Coalitions
The improper allocation of space within the state’s animal shelter system requires organizations to form coalitions. While putting a competent and compassionate director in every shelter would likely be even more effective, that will likely take time to do. No kill coalitions between animal control facilities and selective admission shelters have been used in places, such as Portland, Oregon, Reno, Nevada, Jacksonville, Florida and Austin, Texas to radically increase life saving. Maddie’s Fund, which has supported using coalitions for over a decade, has many resources for organizations seeking to collaborate with each other. Thus, New Jersey animal shelters need to formally work together, develop quantifiable and measurable goals (such as the targeted outcomes in this blog), and hold each organization accountable for meeting these benchmarks.
Sobering Results Require Shelter Leaders to Critically Examine Themselves
Shelters should examine the reasons why their adoption numbers fall far short of these benchmarks. In some cases, shelters need to expand the hours they are open for adoptions. Many shelters should switch from an overly judgmental adoption process based on black and white rules to a conversational one focused on educating the adopter. Organizations will need to radically increase their off-site events and do same day adoptions. Similarly, many shelters must reduce adoption fees and run frequent promotions. Executive Directors should monitor the latest life-saving programs on Maddie’s Fund’s, American Pets Alive Conference’s, and the Best Friends National Conference’s web sites and put some of these policies into place. Shelter management teams will need to ensure their facilities are clean and customers are treated with respect (this can be measured by encouraging the public to complete surveys). Thus, poorly performing shelters need to stop making excuses and do what it takes to reach their adoption potential.
We can turn New Jersey, New York City and Philadelphia into no kill communities. It is time we give our money and volunteer efforts to organizations who raise their performance to help us reach that goal. To do otherwise, would betray all the animals whose lives are on the line.
Appendix – Life Saving Model Assumptions
The Life Saving Model utilizes the following basic animal shelter population equations to calculate the targeted dog outcomes for each facility:
Daily capacity or population = Daily animal intake x average length of stay
Average length of stay = Daily capacity or population/daily intake
Each shelter’s community dog intake (i.e. owner surrenders, strays, cruelty bite cases), number of dogs returned to owners, and maximum dog capacity were taken from its 2018 “Shelter/Pound Annual Report” submitted to the New Jersey Department of Health. Additionally, I added 3% of each shelter’s annual dog intake to account for foster capacity shelters should use based on American Pets Alive guidelines. Thus, total dog capacity equaled the shelter’s capacity plus foster capacity.
This data was then used as follows:
Community dog intake and dogs returned to owners were initially estimated for each month by dividing the annual figures by 12. In order to take into account the extra space in low intake months and reduced space in high intake months, we multiply that number by each month’s percentage of the average month. For example, assume 240 dogs were taken in during the year and the average month equals 20 dogs (240/12). In July, the dog intake is 120% higher than the average month and we therefore multiply 20 dogs by 1.2 to equal 24 dogs. If 120 dogs were returned to owners during the year, the estimated number of dogs returned to owners in July would equal 12 dogs (120/12 = 10; 10*1.2). The monthly intake percentages were based off the average of the 2018 dog intake data on New York Animal Care & Control’s and ACCT Philly’s web sites.
The estimated number of community dogs returned to owners each month are then assumed to stay 5 days on average at shelters based on data from other shelters across the country. If anything, this estimate is conservative (i.e. average length of stay for dogs returned to owners may be less than 5 days and therefore frees up more shelter space for adoptions) based on some shelters returning the bulk of their dogs to owners within 3 days.
The number of community dogs euthanized (including animals who died or are missing) is set to equal 5% of intake. 5% is a reasonable standard euthanasia rate for shelters in New Jersey to meet given few vulnerable stray puppies (i.e. who could die or require euthanasia) arrive in the state’s animal shelters. The average length of stay for euthanized dogs is assumed to equal 14.5 days. Half of dogs are assumed euthanized for untreatable aggression towards people and 21 days is the time estimated to make that determination. The other half of dogs are assumed euthanized for severe and untreatable health issues and I estimate these dogs are euthanized after 8 days (subsequent to the end of the stray hold and owner surrender protection periods).
Adopted dogs are assumed to stay at shelters for varying lengths of time. Adoption length of stay was based on data from a study in the Journal of Applied Animal Welfare and the figures used (except for space-constrained shelters) are located in a prior blog on pit bull adoption. The data primarily comes from Tompkins County SPCA during a time it saved over 90% of its dogs. This was a fairly conservative data set to use as other no kill open admission shelters’ average length of stay are substantially shorter. Specifically, the following assumptions were made:
80% and 20% of each communities dogs (including pit bulls) were adults 1 year and older and under 1 year.
Pit bulls were assumed to comprise 50%, 35% and 25% of community dog intake at poor, middle/upper middle class, and wealthy area animal control shelters. While some shelters may have pit bulls comprising more than 50% of their shelter dog population at a given time, this is due to pit bulls longer average length of stay. For example, a shelter with pit bulls making up 50% of their dog intake and pit bulls having an average length of stay three times longer than other dogs will have pit bulls constituting 75% of the dog population. Shelters without animal control contracts were assumed to only have pit bulls make up 10% of their community dogs (i.e. strays and owner surrenders) based on most of these shelters’ highly selective admission practices.
Pit bull adoption length of stay was taken directly from the Journal of Applied Animal Welfare study. The average adoption lengths of stay for other breeds from this study were averaged and used for dogs other than pit bulls in the analysis
Space constrained shelters were assumed to adopt out their easiest to adopt animals first until they ran out of space. To estimate the average adoption length of stay, I used pit bull adoption length of stay data from Greenhill Humane Society from March 2013 through May 2015. I broke the adoption length of stay data into 5 groups that each made up 20% of the data. The average adoption length of stay for each of these 5 groups was calculated. The average adoption length of stay of each group was divided by the average length of stay for all of the adopted pit bulls in the Greenhill Humane Society data set. Those percentages were then multiplied by the average dog adoption length of stay determined in the previous bullet and used to determine the adoption lengths of stay used for space-constrained shelters.
Dogs transferred to rescue or other facilities are assumed to stay at shelters 8 days on average based on the assumption strays can’t be released until the 7 day hold period elapses.
Community dogs not returned to owners or euthanized are initially assumed as adopted for each month. However, if the calculated length of stay exceeds the shelter’s required length of stay, dogs are moved from adoption (i.e. longer length of stay) to rescue (i.e. shorter length of stay) until the calculated length of stay each month approximately equals the required length of stay.
Animal control shelters have a minimum of 10% of unclaimed dogs go to rescues. To the extent shelters transfer 10% of unclaimed dogs to rescues despite having space (i.e. reclassifying dogs from adoptions with a longer length of stay to rescues with a shorter length of stay), I do not require these facilities to use that space to rescue additional dogs.
Required length of stay = Shelter’s total capacity/adjusted daily intake for the month. Adjusted daily intake for month = Adjusted monthly intake per first bullet above/the number of days in the month.
Shelters with excess capacity are assumed to use the extra space to rescue and adopt out dogs from other New Jersey animal shelters. To the extent all healthy and treatable New Jersey animal shelter dogs are saved, I assume additional dogs are pulled from nearby states with similar types of dogs. I assume all rescued dogs will not be killed since the transferring and receiving shelters should evaluate these dogs’ behavior. Based on pit bull type dogs having longer lengths of stay at shelters, I assume 80% of dogs rescued from local animal shelters are pit bulls and 20% are non-pit bulls. 80% and 20% of pit bull and non-pit bull type dogs are considered 1 year and older and under 1 year. The average length of stay for rescued pit bulls and other dogs are the same as the adoption length of stay figures above.
Each month’s targeted outcomes are added to determine how many local dogs New Jersey animal shelters should adopt out, send to rescue, rescue from other nearby animal shelters and euthanize.
The targeted number of dogs rescued and adopted were capped at 2 pit bulls per 1,000 people in each county. If the model yielded a higher result than this cap, the targeted numbers of dogs adopted were set to equal to this cap using the pit bull percentage assumptions above. For shelters in these counties (except Passaic County), I calculated the cap at the county level and then reduced the number of cats adopted for the county to equal the cap. I excluded West Milford from Passaic County due the town’s large distance from the population centers in the rest of the county. Each shelter’s percentage of total targeted adoptions in the county from the unmodified model were applied to the the total reduction in the number of adoptions in the county to yield the targeted numbers of dogs adopted in the modified model. If the shelter also rescued animals from other shelters, the rescued numbers were also reduced since I assume rescued animals are adopted.
Recently, I wrote a blog discussing decreased killing at New Jersey animal shelters in 2018. This blog will explore the 2018 statistics in more detail and assess the current status of the state’s animal shelters.
Most New Jersey animal shelters voluntarily report detailed data to state authorities. Last month, I shared the 2018 summary statistics for New Jersey animal shelters on my Facebook page. Each year, the New Jersey Department of Health requests each licensed animal shelter in the state to submit animal shelter data for the previous year. Animal shelters voluntarily submit this data in the “Shelter/Pound Annual Report.” The New Jersey Department of Health takes these Shelter/Pound Annual Reports and compiles the number of dogs, cats and other animals impounded, redeemed, adopted and euthanized to prepare its Animal Intake and Disposition report. However, the Shelter/Pound Annual Reports include additional information on how animals were impounded (i.e. strays, owner surrenders, rescued from in-state facilities, rescued from out of state shelters, and cruelty/bite cases/other) and disposed of (i.e. returned to owner, adopted, sent to rescue/another shelter, and died/missing/other outcome). Additionally, the Shelter/Pound Annual Reports include the number of animals in shelters at the beginning and end of the year as well as the maximum number of animals facilities can hold. Thus, the Shelter/Pound Annual Reports include very important data not found in the New Jersey Department of Health’s summary report.
I compiled the data from these reports and analyze the results in this blog. 2018 statistics for each New Jersey animal shelter are listed at this link. You can also view each “Shelter/Pound Annual Report” at this link.
Garbage Data Raises Serious Questions About New Jersey Animal Shelters’ Statistics
Most New Jersey animal shelters do not properly account for their animals. Simple math dictates the number of animals at a facility at the beginning of the year, plus all animals coming in during the year, less all animals leaving for the period, should equal the number of animals a shelter has at the end of the year. Stunningly, 56 out of 92 shelters reporting these dog statistics and 59 out of 91 facilities submitting this cat data failed to get this right. This raises serious questions about the accuracy of these shelters’ reported statistics. 32 of the 56 shelters with flawed dog statistics and 34 of the 59 facilities with incorrect cat statistics should have had more animals at the end of the year than reported. While these errors could have been due to incorrect counts of the number of animals at facilities, these shelters may have not recorded outcomes, such as animals who were killed, died, or went missing. To put it another way, 2,002 cats and dogs should have had outcomes reported and did not. Thus, there is the potential that as many as 2,002 additional dogs and cats were killed, died or went missing from New Jersey animal shelters than were reported in 2018.
Even worse, a number of animal shelters reported having a different number of animals at the end of 2017 and at the beginning of 2018. Obviously, shelters should report the same number of animals at the end of the prior year and the start of the current year. However, 32 of 92 shelters reported different numbers of dogs at the end of 2017 and the beginning of 2018. Similarly, 37 of 91 shelters reported different numbers of cats at the end of 2017 and the beginning of 2018. The worst offenders are listed in the tables below:
Shelters may have failed to classify animals adopted out and sent to rescues properly. Both Paterson Animal Control and Elizabeth Animal Shelter reported no animals were sent to rescues and all dogs and cats leaving their facilities alive were owner reclaims or adoptions. However, intake and disposition records I reviewed at both of these shelters in recent years revealed almost all “adopted” animals are actually rescued. One has to wonder how many other facilities failed to properly classify adoptions and rescues properly. This data is very important as it provides details on the burden rescues and other shelters are taking on from these facilities.
We need better oversight of New Jersey animal shelters’ data reporting. Currently, these statistics are voluntarily reported and most shelters are not taking this seriously. For example, I noticed a large number of reports were submitted many months after the end of the year. This data should be easy to compile since facilities can utilize animal shelter software programs, some of which are free, to do this task. Furthermore, New Jersey animal shelter laws mandate facilities maintain much of the raw data found in the Shelter/Pound Annual Report. Unfortunately, New Jersey Department of Health inspections routinely find shelters do not properly keep records on animals. We need to make the data reporting mandatory for animal shelters as the shelter reform bill, S725, does along with serious penalties for significant errors (especially if deliberate). In order for animal shelters to take data reporting seriously, we may also need to require audits of these reports. Thus, these results show we need stronger laws and the New Jersey Department of Health to play a greater role in ensuring reported animal shelter statistics are in fact accurate.
Despite the errors in these reports, the data provided still reveals important information.
More Animals Losing Their Lives in New Jersey Animal Shelters Than Disclosed in Summary Report
The more detailed data in the Shelter/Pound Annual Reports allows one to more critically examine the percentage of locally impounded animals dying in New Jersey’s animal shelters. The following table summarizes my analysis of the kill rate calculated from the New Jersey Department of Health’s summary report and the data reported in the Shelter/Pound Annual Reports.
This year I revised the cat statistics to remove an estimate of the cats St. Hubert’s transfers in and quickly transfers out through its Sister Shelter WayStation program. Previously, I made this adjustment only for dogs. Since St. Hubert’s is effectively acting as a middle man and not holding these animals very long, it makes sense to exclude these dogs and cats from the various kill rate statistics. If I did not exclude these animals, I would understate the dog and cat kill rates due to inflated intakes and outcomes numbers. Therefore, I removed all of St. Hubert’s dogs transferred out from the intake and outcomes figures in the metrics. Since St. Hubert’s primarily uses the Sister Shelter Waystation program to quickly transfer in cats and send them to out of state facilities, I only backed out the cats St. Hubert’s transferred to out of state organizations in the various kill rates. This adjustment increased the dog kill rate (intake) from 5.5 to 6.3% and the cat kill rate (intake) from 16.1% to 16.3%.
The Animal Intake and Disposition report prepared by the New Jersey Department of Health only allows one to calculate the number of animals killed as a percentage of total animals impounded or intake. I prefer calculating the kill rate as a percentage of outcomes rather than intake as this metric directly compares positive and negative outcomes. Using intake may depress the kill rate since shelters can simply hold animals for a long time to the point of overcrowding. Calculating the kill rate based on outcomes rather than intake caused the dog kill rate to increase from 6.3% to 6.4% and the cat kill rate to increase from 16.3% to 16.7%.
To calculate the statewide kill rate, we must also back out transfers from one New Jersey animal shelter to another state facility to avoid counting animals still in the state’s shelter system or registering two outcomes for the same animal (i.e. one New Jersey animal shelter transfers a dog or cat to another state facility which then adopts out the animal). This adjustment increases the dog kill rate from 6.4% to 6.8% and the cat kill rate from 16.7% to 18.0%.
In addition, we should increase the kill rate for animals who died or went missing in shelters. In the past, I’ve labeled this metric the death rate as these animals are likely dead or in a very bad situation. Unfortunately, the Shelter/Pound Annual Report includes animals who died or went missing in the “Other” outcome category. The “Other” category contains positive live releases, such as TNR for cats, at a few shelters. While including the “Other” category in the death rate for most shelters is appropriate (i.e. those facilities that don’t do TNR or don’t include cats released through TNR programs in “Other” outcomes), I’m no longer doing this due to an increasing number of shelters implementing TNR. Instead, I calculated the kill rate by subtracting out “Other” outcomes from total outcomes. If a shelter specifies the number of animals included in “Other” that left the shelter alive, I count this as “Other Live Release” and do not back these amounts out of total outcomes. After making this adjustment, the dog kill rate remained at 6.8% and the cat kill rate also stayed at 18.0%. For those interested in seeing the estimated death rates, you can find them in the supporting spreadsheet.
Also, many shelters transport easy to adopt animals from out of state which artificially increases live release rates. To properly calculate the percentage of New Jersey animals losing their lives, we need to adjust for transports. Unfortunately, shelters don’t break out their save rates by local and out of state animals. However, most likely nearly all of the out of state animals (primarily puppies and easy to adopt dogs and cats) make it out of shelters alive. Therefore, I back out the number of out of state transports from total outcomes to estimate the local kill rate. This adjustment increases the New Jersey dog kill rate from 6.8% to 9.2% and the state’s cat kill rate from 18.0 to 19.3%.
Also, I estimate a maximum local kill rate by including the number of unaccounted for animals described in the section above. Making this adjustment increases the maximum potential New Jersey dog kill rate from 9.2 to 12.9% and the maximum potential state cat kill rate from 19.3% to 21.3%.
Some animal shelters quickly return large percentages of their animals to owners. At these shelters, the populations served are typically well-off and animals are licensed and have microchips. To account for the animals facilities actually have to shelter, I calculated a kill rate for non-reclaimed animals and a maximum potential kill rate for non-reclaimed local animals. The non-reclaimed kill rate and maximum potential kill rate for dogs is 9.7% and 21.0%. Non-reclaimed cats had a 20.4% kill rate and a 22.9% maximum potential kill rate. Thus, the percentage of New Jersey animals losing their lives in our state’s animal shelters may be much higher than the state summary report suggests.
Kill Rates Extremely High at a Number of New Jersey Animal Shelters
Dogs and cats are likely to lose their lives at a number of New Jersey animal shelters. Shelters with the highest kill rates for dogs and cats (excluding very low intake facilities) are listed in the following tables:
Thus, both dogs and cats have a very good chance of leaving many New Jersey animal shelters dead rather than alive.
In terms of raw numbers, the following shelters killed the most animals:
Many shelters fail to account for large numbers of their animals. As discussed above, a shelter’s number of animals at the end of the year should be calculated as follows:
Beginning number of animals + animals impounded – animals leaving the shelter
Unfortunately, a large number of shelters take in far more animals than they can explain where they went. Shelters having the highest numbers of unaccounted for dogs and cats are listed in the following tables:
Dog and cat kill rates at many shelters may be even higher if these unaccounted for animals are counted as killed. If we only consider animal shelters which reported transporting few or no animals in 2018, facilities with the highest dog and cat kill rates considering the unaccounted for animals described above are as follows:
Thus, the plight of dogs and cats may be far worse in New Jersey animal shelters when we consider the unaccounted for animals.
Shelters Turn Their Backs on New Jersey’s Animals
New Jersey animal shelters rescue far more dogs from out of state than from other New Jersey animal shelters. Specifically, New Jersey animal shelters transferred in 10,131 dogs from out of state animal shelters and only rescued 2,399 dogs from other New Jersey animal shelters. However, St. Hubert’s frequently transfers a substantial number of its transports quickly to its partners in New Jersey and other states. If I back out St. Hubert’s transfers of dogs to out of state organizations, the number of transports decreases from 10,131 dogs to 6,360 dogs. While the state’s local kill rate decreased in 2018, it is likely the local kill rate would have decreased by more if not for the massive number of out of state transports.
While perhaps some shelters, such as Animal Alliance in Lambertville, take animals from nearby New York or Pennsylvania animal control shelters, the overwhelming majority of these dogs most certainly came from down south. In fact, New Jersey animal shelters transported more dogs from out of state than dogs who were killed in New Jersey animal shelters. This number does not include additional out of state dogs transported into New Jersey by rescues operating without a physical facility. Shelters transporting the most dogs from out of state were as follows:
Shelters Do Far Worse with Animals Requiring New Homes
Since dogs reclaimed by their owners typically have licenses and/or microchips and quickly leave the shelter, its informative to look at dogs shelters have to find new homes for. To get a better idea of how organizations are doing with animals they actually have to shelter, I also examined what percentage of non-reclaimed dogs lose their lives at each facility. Shelters with the highest non-reclaimed dogs kill rates are as follows:
Shelters with the highest maximum non-reclaimed dogs kill rates are as follows (excluding facilities that reported transporting many dogs in and taking very few animals in):
Shelters Leave Animal Enclosures Empty While Dogs and Cats Die
New Jersey animal shelters fail to use their space to save animals. Based on the average number of animals at all of New Jersey’s animal shelters at the beginning and the end of 2018, only 62% of dog and 75% of cat capacity was used. Given December is a low intake month, I also increased these populations to an average intake month. This adjustment only raised the dog capacity utilization to 70%. While this adjustment did increase the cat capacity utilization to over 100%, it is highly unlikely this happened in reality. Shelter inspection reports I’ve reviewed often did not reveal significantly larger dog and cat populations in the summer and winter months. This is likely due to the influx of highly adoptable kittens having short lengths of stay and shelters killing cats with empty cages.
Many animal shelters with low kill rates failed to rescue animals with their excess space. Additionally, other shelters used little of their available space and still killed a large percentage of their animals. Some examples after increasing the population (and therefore capacity utilization) based on the adjustment discussed above are as follows:
Thus, many New Jersey animal shelters are killing dogs and cats despite having ample space to house these animals.
New Jersey’s animal shelters continue to fail the state’s animals. The state’s animal shelters only impound 8.6 dogs and cats per 1,000 New Jersey residents. If we just count animals originating from New Jersey, the state’s animal shelters only impound 7.4 dogs and cats per 1,000 people. As a comparison, the average community in the country impounds anywhere from 14 animals per 1,000 residents based on estimates from Animal People Newspaper and No Kill Movement. Despite New Jersey shelters impounding a fraction of the animals other no kill communities take in on a per capita basis, the state’s animal control facilities continue to kill and allow animals to die under their care. Even worse, many of these shelters can’t even properly keep track of how many animals leave their facilities dead or alive. Our state’s animals deserve far better treatment than this. Contact your local city council members and mayor and demand better from the animal shelter serving your community. We can do so much better and it is time our shelters operate this way.


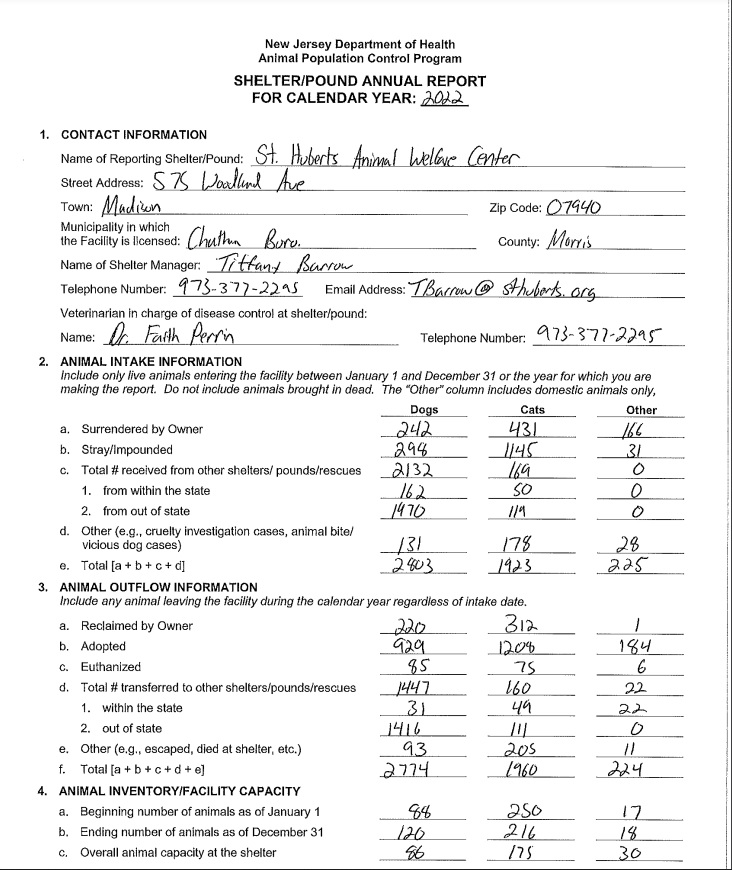


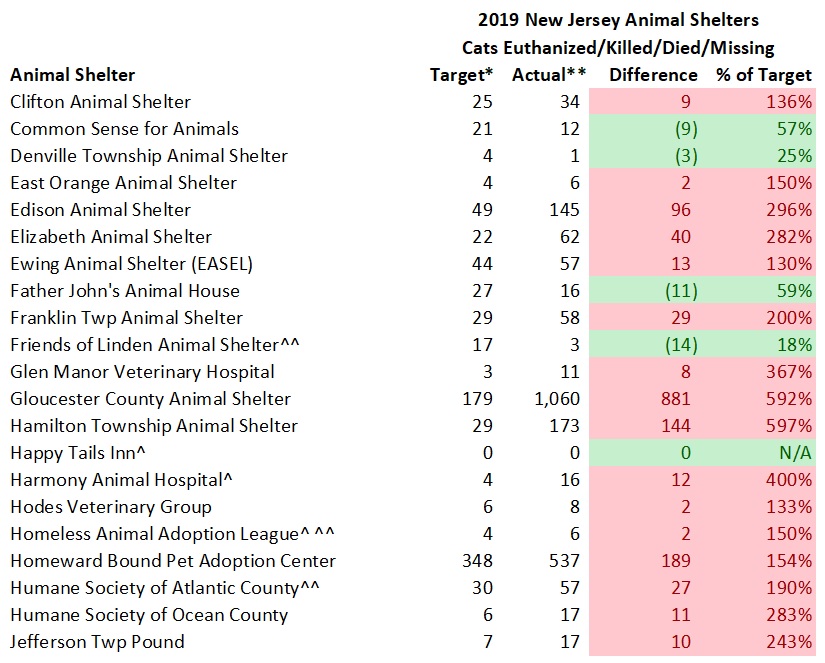


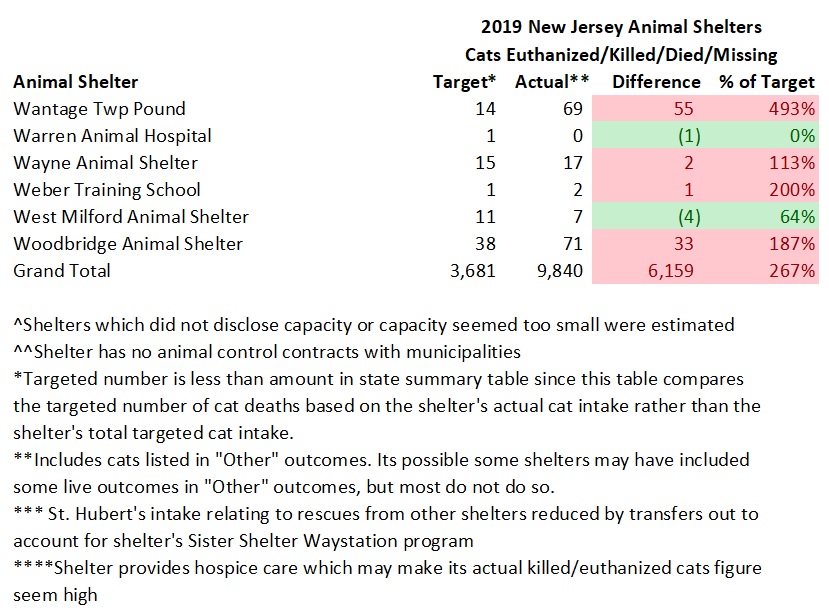

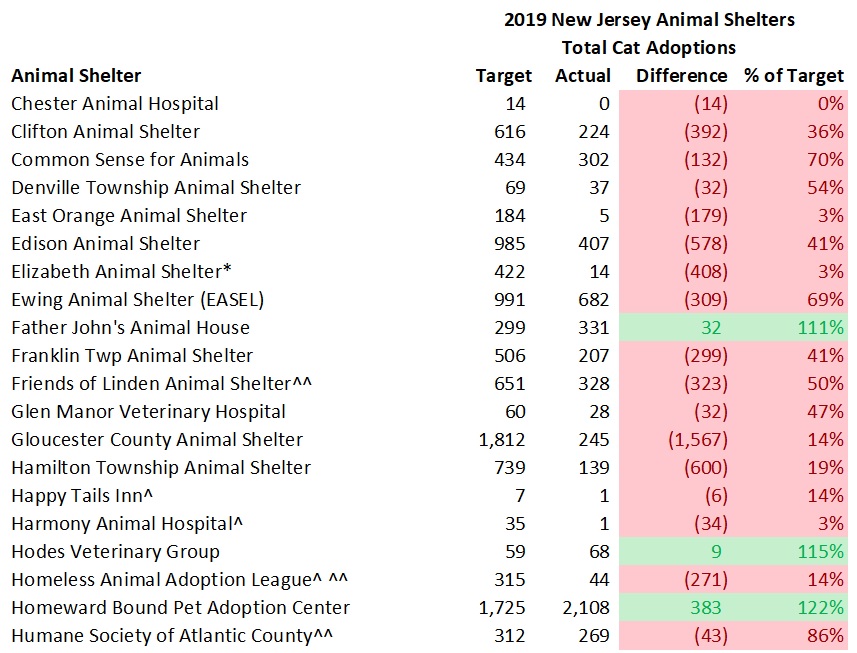


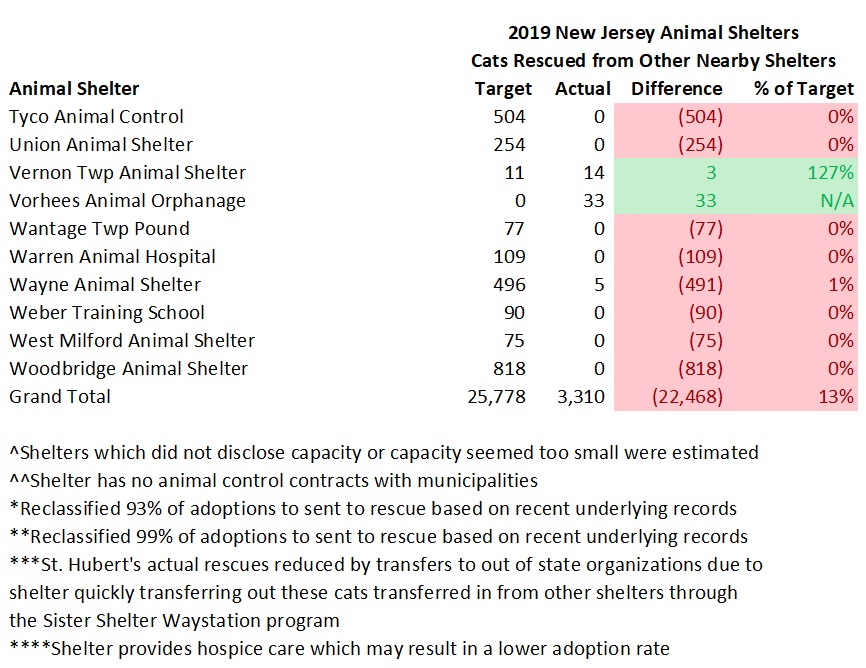


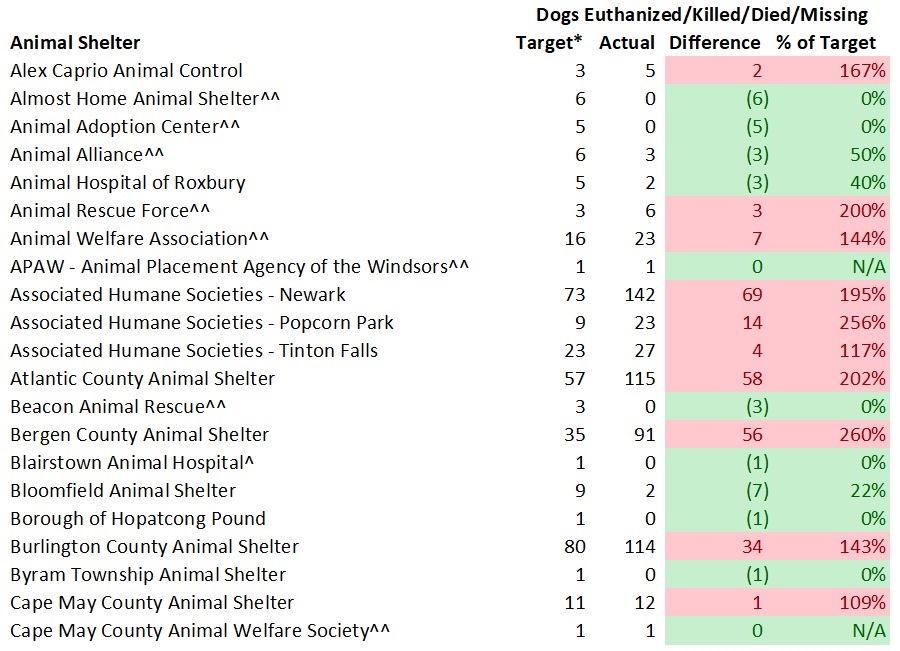

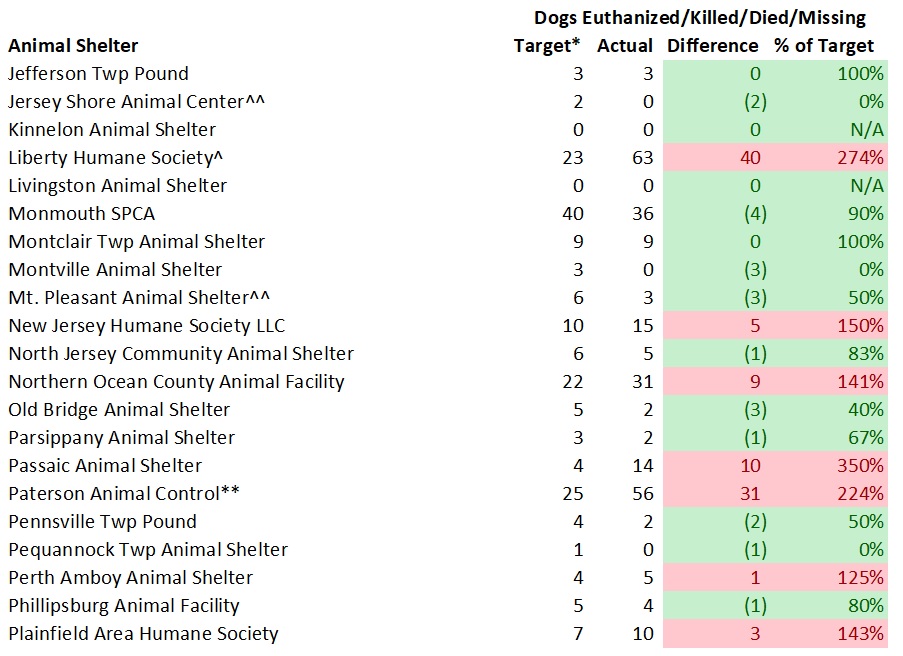


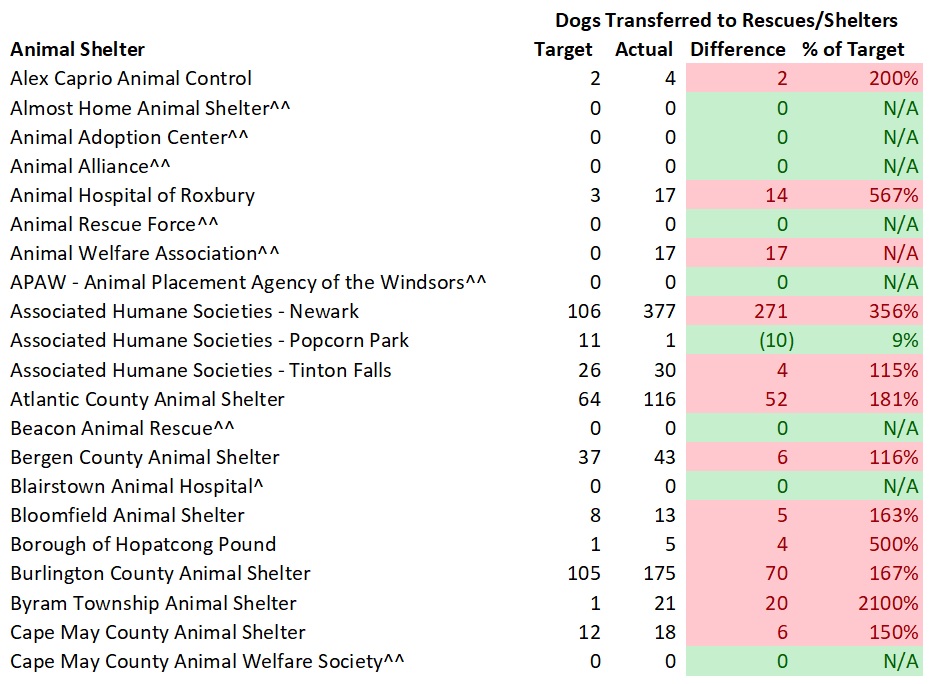
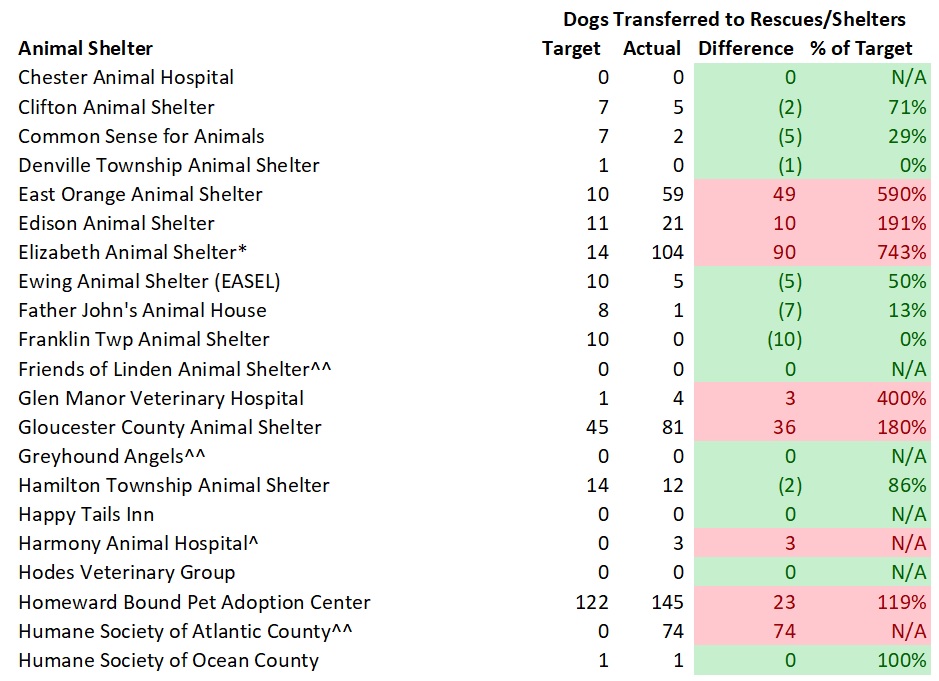
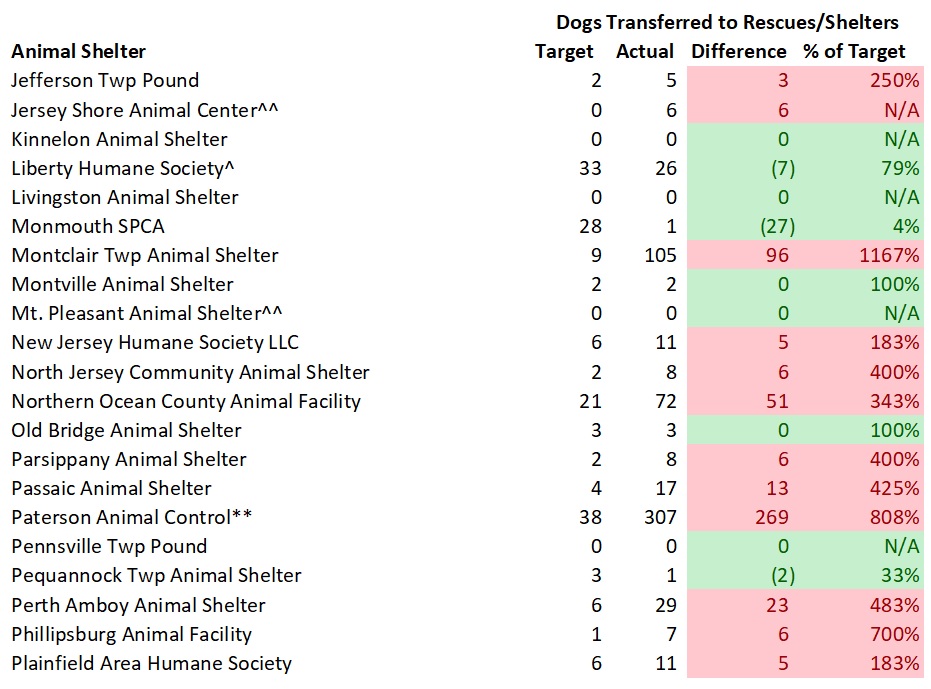


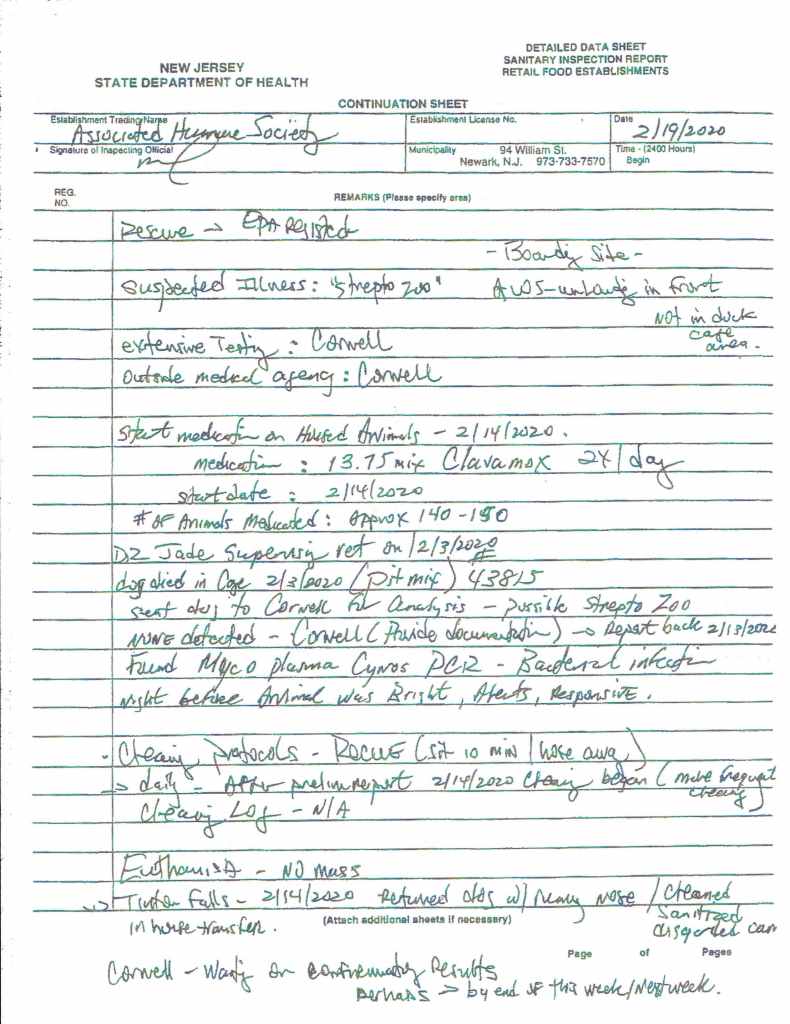


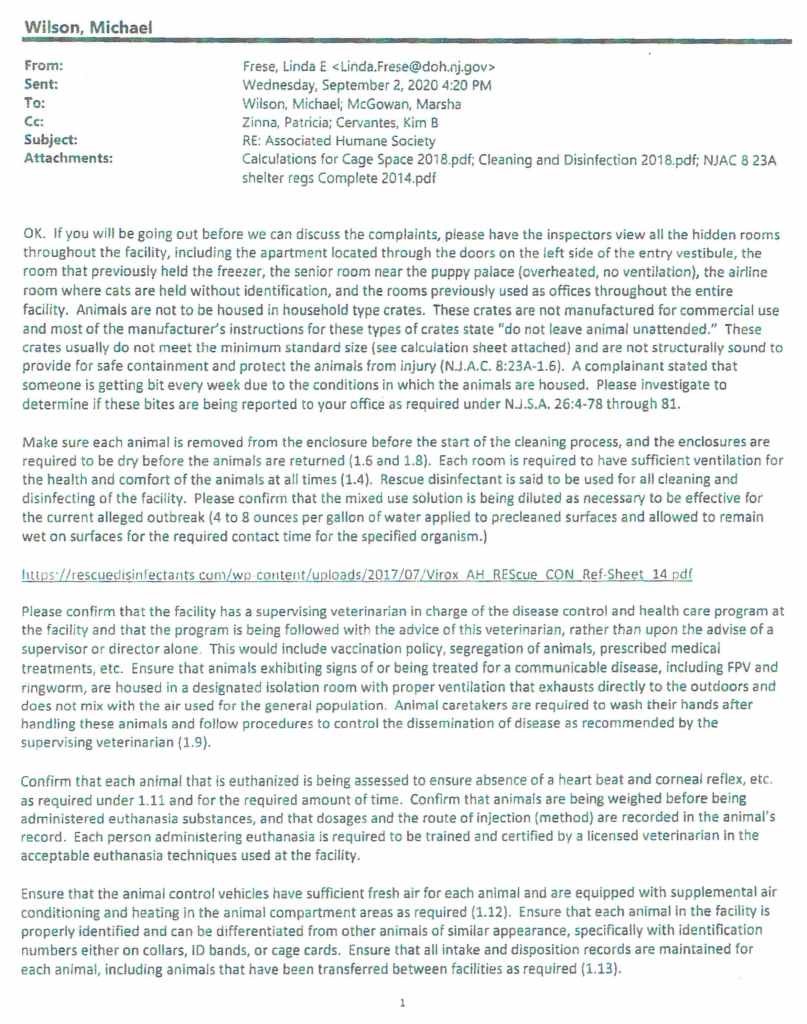


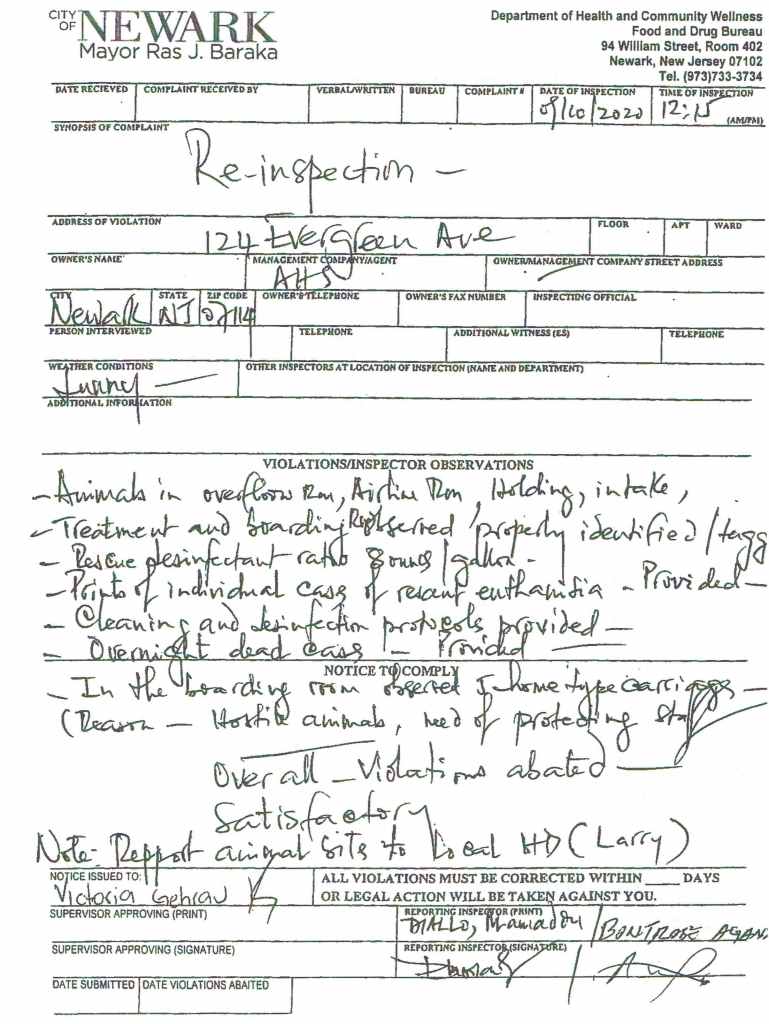


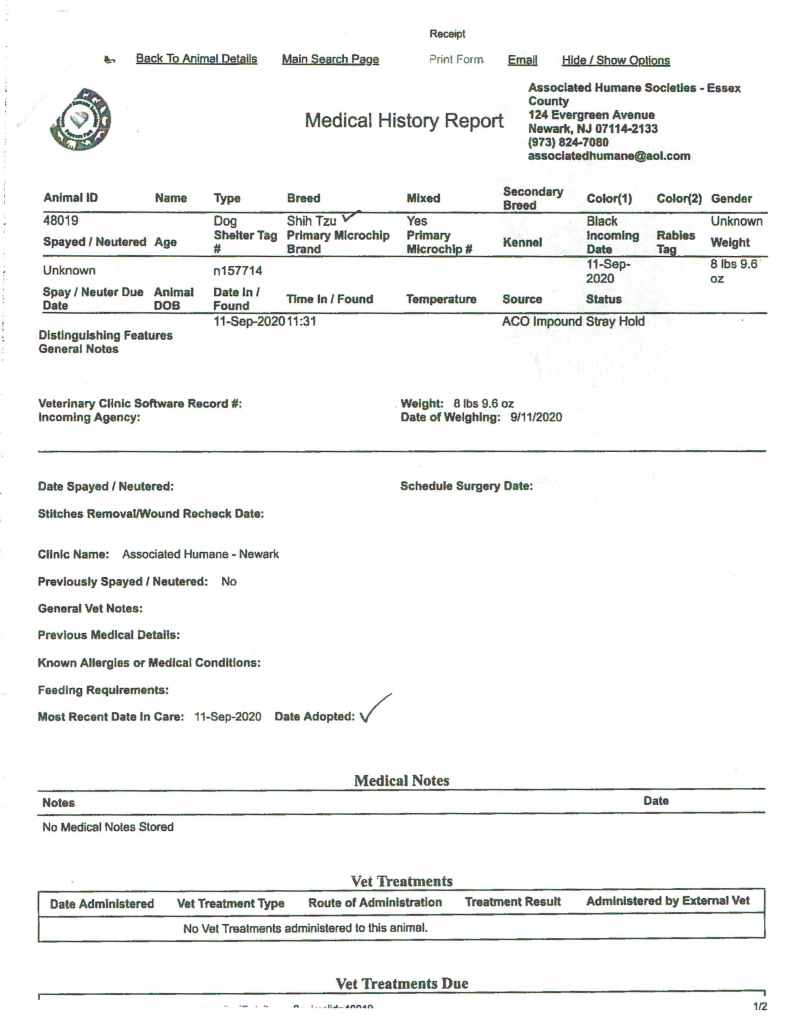
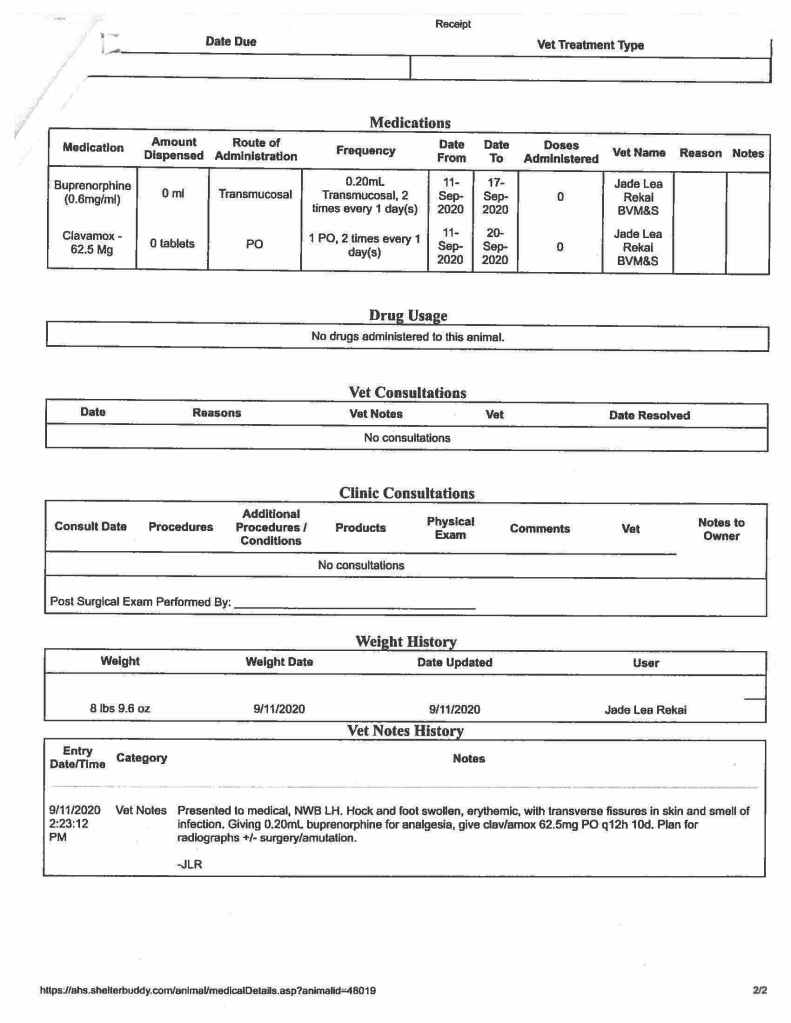

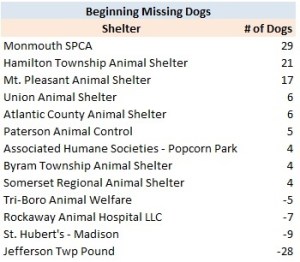
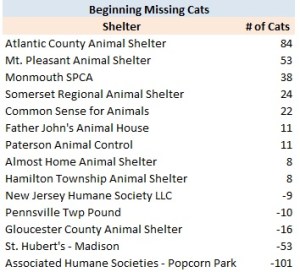

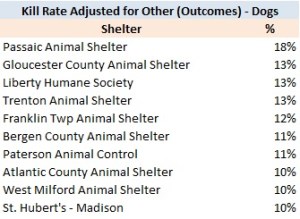
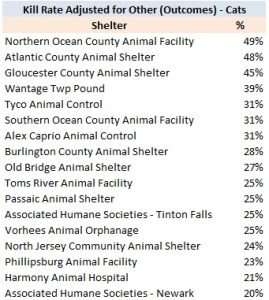


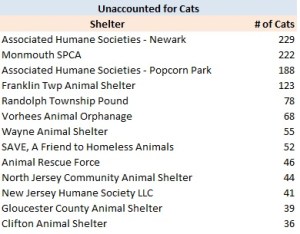
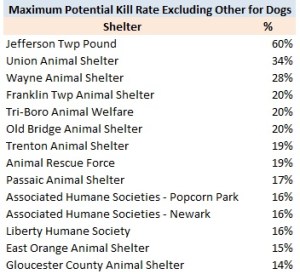


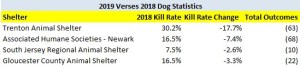

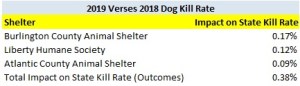

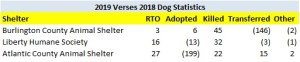


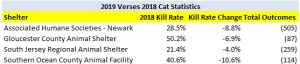


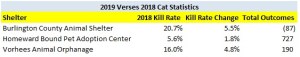


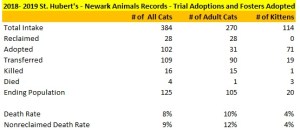

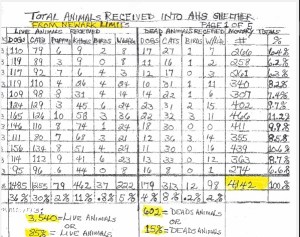


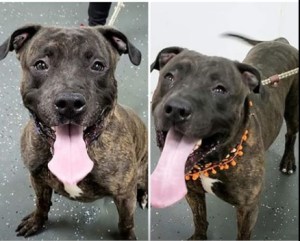

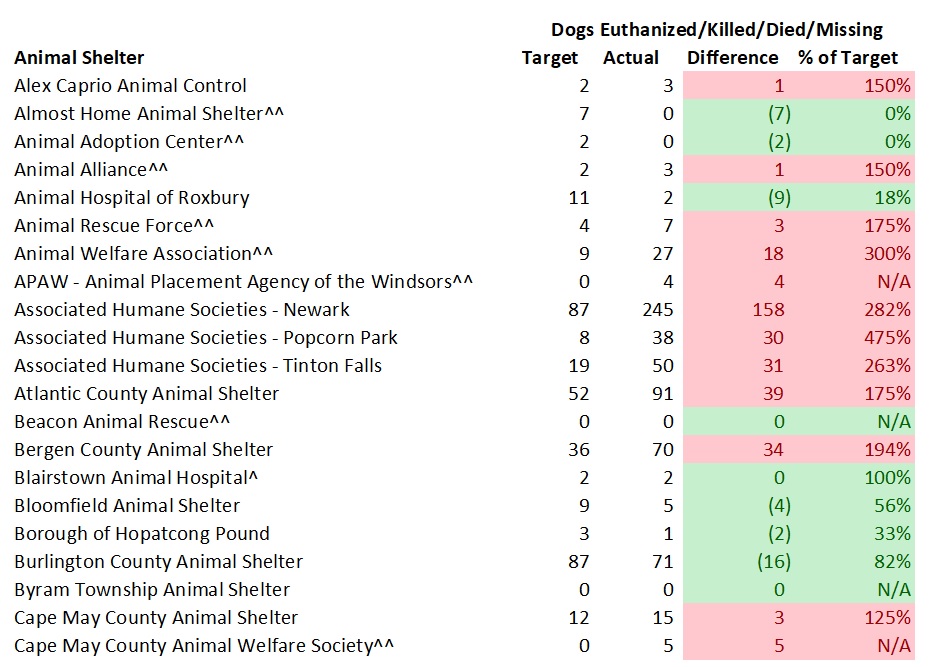
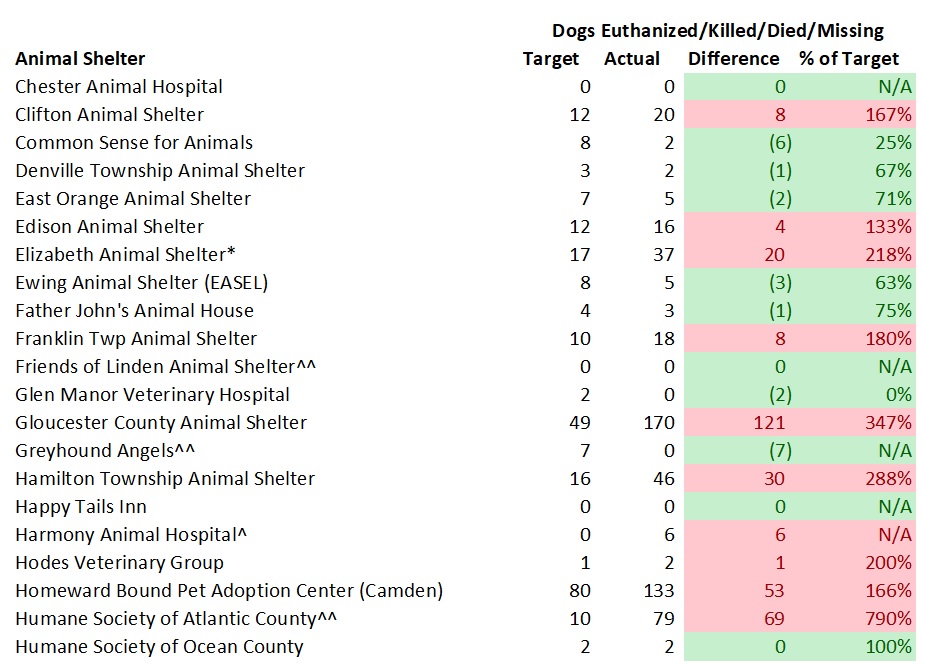
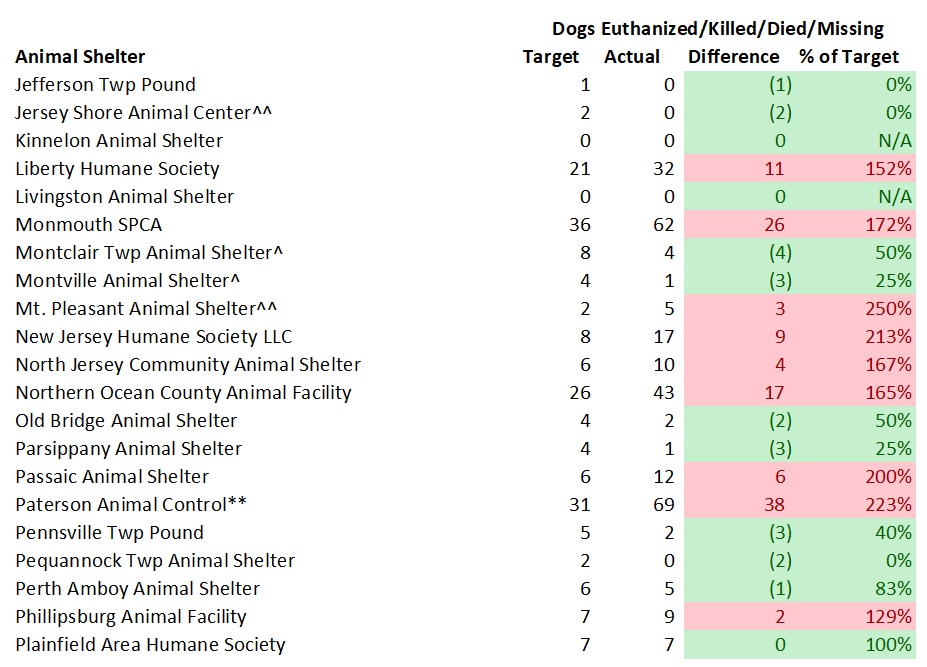


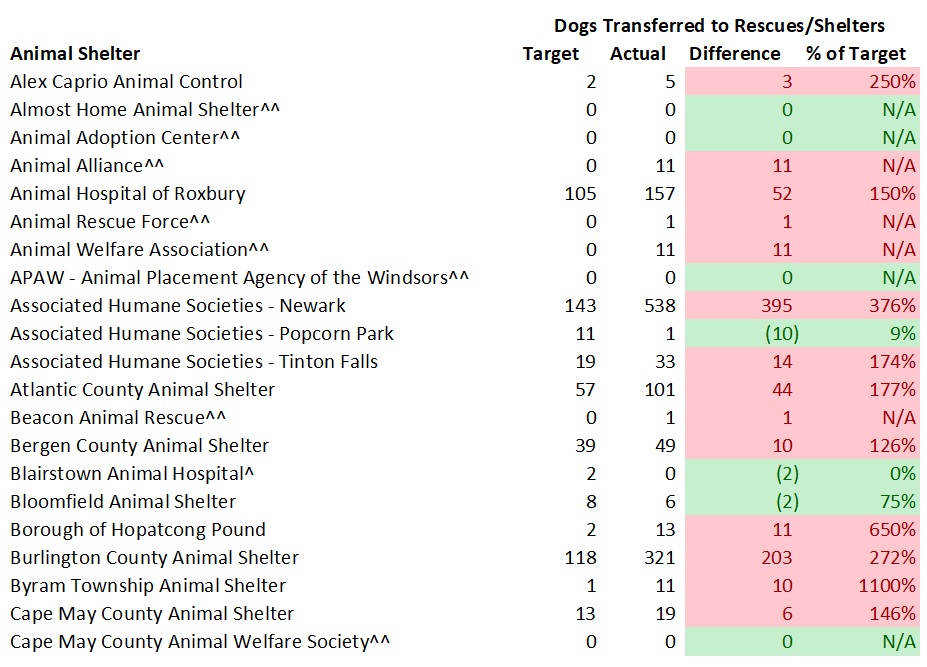
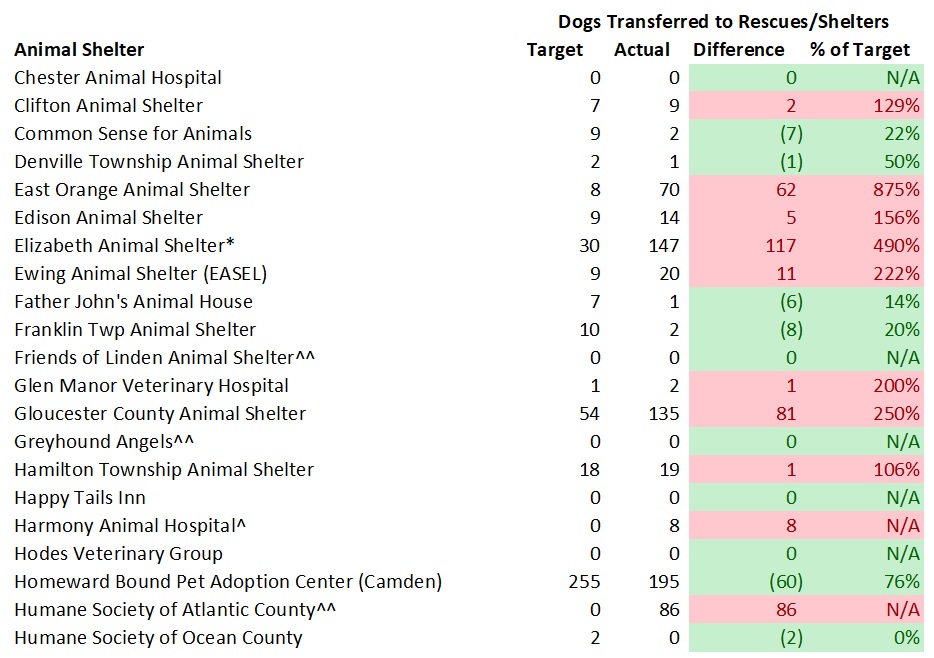

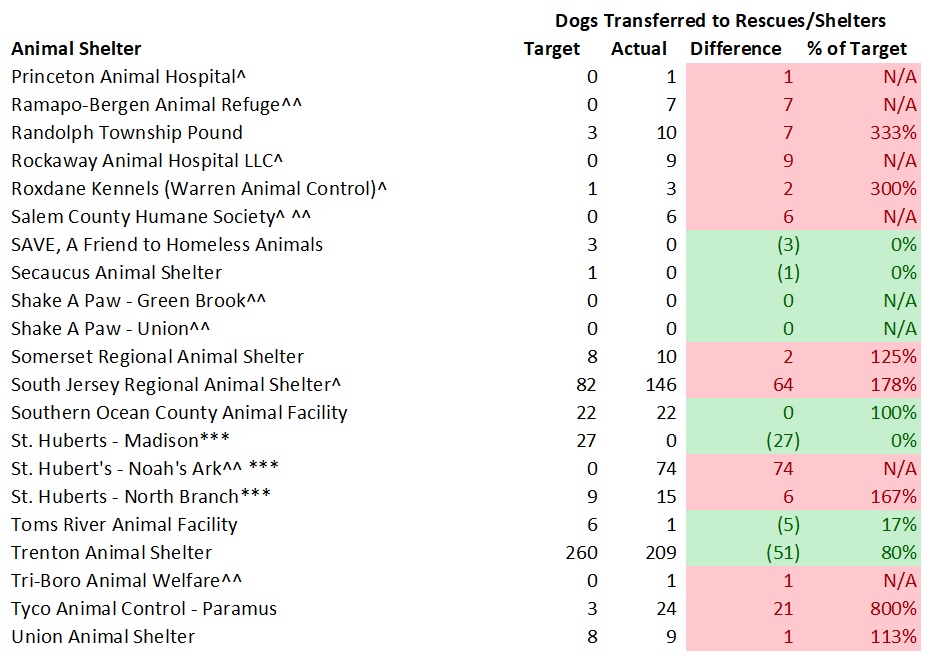


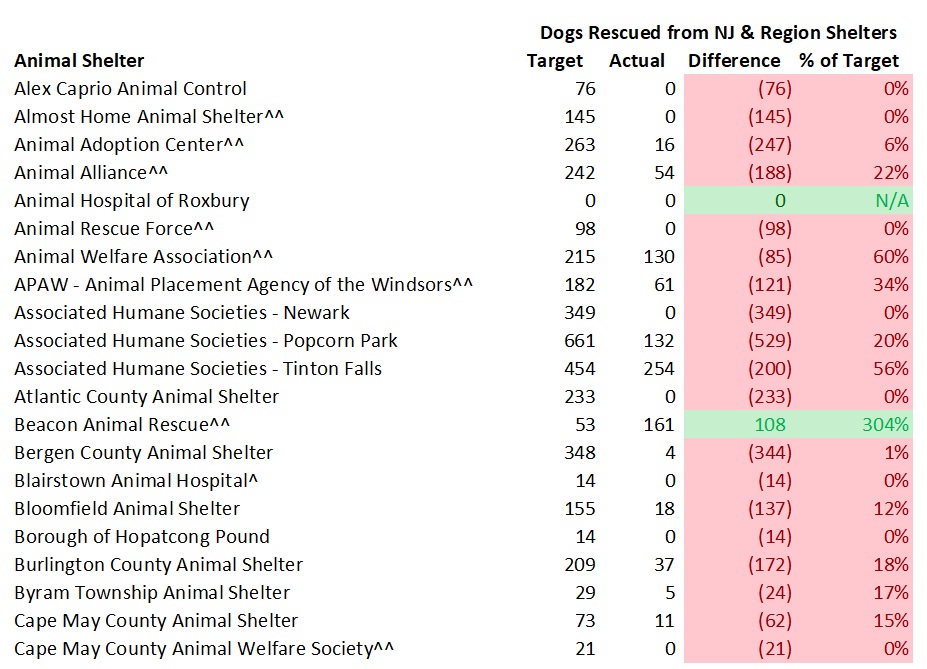


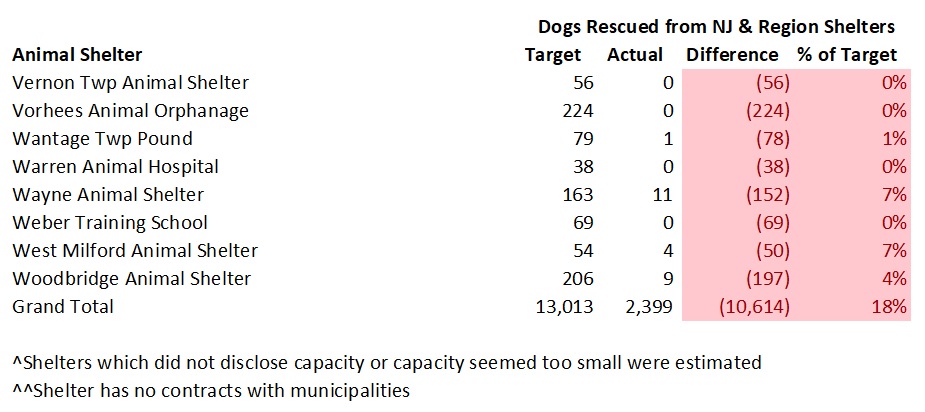


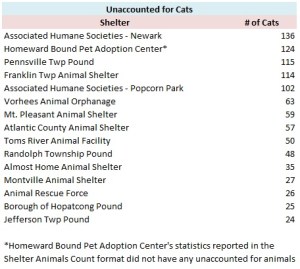
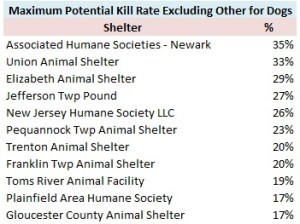


