Cats are losing their lives at an alarming rate in New Jersey animal shelters. Nearly 16,000 cats or 36% of the cats coming into New Jersey animal shelters in 2015 were killed, died or went missing. This blog explores the reasons why this tragedy is occurring and whether we can end the massacre. Additionally, I’ll try and answer the question whether shelters need to resort to neutering and releasing healthy friendly cats or not impounding these cats at all to avoid killing cats in shelters.
Model Assesses New Jersey Animal Shelters’ Life Saving Performance
In order to assess how good of a job New Jersey animal shelters are doing, I’ve developed an analysis I call the “Life Saving Model.” While shelter performance is dependent on many variables, such as finances, facility design, local laws, etc., the most critical factor impacting potential life saving is physical space. As a result, my analysis focuses on making the best use of space to save the maximum number of New Jersey cats.
The Life Saving Model measures the number of local animals a shelter should adopt out, rescue from other facilities, send to rescues or other shelters and euthanize to achieve no kill level live release rates. The targeted outcomes take into account each facility’s physical capacity and the number of cats the organization receives from its community (i.e. strays, owner surrenders, cruelty cases). I assume a target euthanasia rate, take the number of cats actually returned to owners and then estimate how many community cats a shelter should adopt out. To the extent space runs out, I then calculate how many cats must be sent to rescue. If the shelter has excess space after properly serving its local community, the facility uses that room to rescue and adopt out cats from nearby areas. The targeted results calculated from this model are compared to the actual results from each shelter below.
The Life Saving Model requires a more complex analysis for cats than dogs in New Jersey. Generally speaking, New Jersey animal shelters receive few litters of young puppies who are vulnerable to disease. On the other hand, local shelters receive lots of young kittens, particularly during the April to October kitten season. These young kittens are highly vulnerable to disease and those without mothers require bottle feeding every 1-2 hours. Therefore, animal welfare organizations should not hold these kittens in a traditional shelter setting and instead should send these animals to foster homes or a kitten nursery at or outside of the facility. During the months outside of kitten season (i.e. November-March), my model assumes shelters with enough physical space will be able to place young kittens into their volunteers’ foster homes and/or in a kitten nursery run by the animal shelter. In kitten season with many young animals coming in, I assume a certain percentage of the cat intake will need to go to rescues or other shelters. For shelters who rescue cats, I assume a small percentage of the cats are young kittens who are hopelessly suffering and will require humane euthanasia. Thus, my Life Saving Model is a bit more complicated than the analysis I did for dogs.
To read specific details and assumptions used in the model, please see the Appendix at the end of this blog.
My analysis puts a cap on the targeted numbers of cats rescued from other shelters and adoptions. While my unmodified targeted numbers of rescued and adopted animals are quite achievable, I wanted to provide very conservative goals for New Jersey animal shelters. For example, the unmodified model resulted in a statewide per capita cat adoption rate less than half the level found at some of the best animal control shelters.
My modified analysis capped cat adoptions at 8 cats per 1,000 people within each New Jersey county. In other words, the targeted numbers of cats rescued from other shelters and adopted below are the lesser of
- Number predicted by model
- Number determined by capping adoptions at 8 cats per 1,000 people in the county
In simple terms, a shelter is expected to achieve this per capita adoption rate unless the facility lacks enough space. If a shelter does not have sufficient room, it won’t have the time to reach all the potential adopters and requires assistance from rescues and/or other facilities.
Another complexity in this analysis are feral cats. In an ideal world, shelters would practice trap-neuter-return (TNR) or shelter-neuter-return (SNR) for feral cats only. In TNR, the public or a third party typically does the work and the shelter doesn’t take in feral cats. In the variant of SNR I support, the shelter would take in feral cats, neuter them and release them back to where they were found. Unfortunately, many municipalities prohibit these programs and shelters in these places generally catch and kill feral cats.
Ideally, I would perform two analyses as follows:
- Modeling a large scale and targeted TNR program by reducing cat intake at shelters needing to implement TNR or improve their existing TNR programs
- Estimating the number of truly feral cats taken in and counting these cats as killed
The first analysis assumes TNR could be implemented and would result in fewer New Jersey cats for shelters to place. In a blog I wrote last year, I estimated the impact of a high volume targeted spay/neuter program. Generally speaking, this analysis required many animal control shelters to adopt out more cats, send fewer cats to rescue, and rescue more cats from other shelters due to the extra shelter space resulting from lower local cat intake. In other words, this analysis would require shelters to achieve higher performance targets.
The second analysis assumes local laws cannot be changed and shelters are stuck receiving unadoptable feral cats. Unfortunately, I do not have the data to calculate the percentage of truly feral cats received at each New Jersey animal shelter. Based on an analysis of Michigan animal shelter data, Nathan Winograd estimated at least 6% of cat intake at Michigan animal shelters are truly feral cats. Similarly, Wisconsin’s Clark County Humane Society 2014 cat statistics show feral cats who were trapped, vaccinated and returned to the community made up 7% of cat outcomes. Based on these numbers and the success of barn cat programs in Pflugerville, Texas and the Maryville, Tennessee area, barn cat programs should be able to save most feral cats in similar communities. On the other hand, California’s Orange County Animal Care reported approximately 24% of the cats it took in during 2012, which was before it practiced TNR, were feral and euthanized. However, I suspect at least some of these cats were fearful rather than truly feral and could have been socialized and eventually adopted out. In fact, a recent study documented 18% of impounded cats were feral/aggressive, but all these cats became safe enough to adopt out after people gently touched the cats and spoke to them softly for 6 days. Thus, the number of truly feral cats may be much lower than the amount of cats most shelters label as aggressive.
My model assumes shelters are doing the proper thing and practicing TNR and placing the reasonable number of feral cats received as barn cats. Obviously, many shelters do take in a good number of feral cats due to poor laws or misguided policies. As a result, the number of New Jersey cats killed may be higher than my model predicts for some shelters. However, my model’s results using total cat intake rather than assuming a larger percentage of feral cats will not be too much different for the targeted adoption and euthanasia rate metrics as explained in my blog from two years ago. The following analysis assumes shelters receive a reasonable number of truly feral cats. As a result, shelters can adopt out these cats through a barn cat program. While I realize some shelters do receive greater numbers of truly feral cats, the purpose of this analysis is to examine whether New Jersey animal shelters can handle the number of cats received.
New Jersey Animal Shelters Contain Enough Space to Save Most of New Jersey’s Healthy and Treatable Cats and Many More from Other States
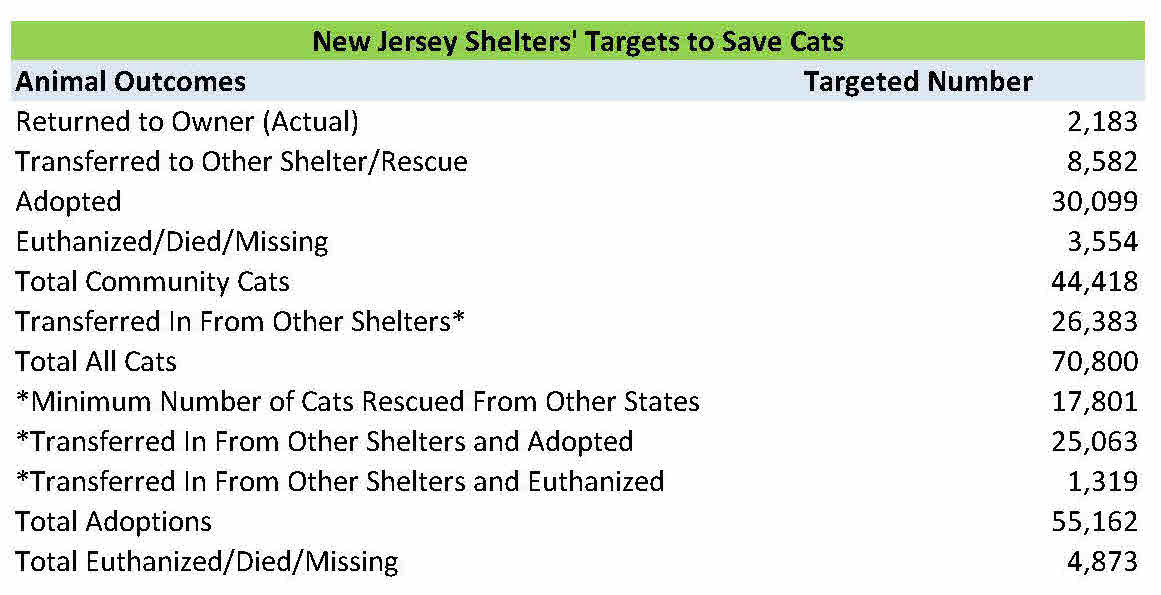
New Jersey’s animal shelter system has enough space to save most of the state’s healthy and treatable cats. The table below details the targeted numbers of cat outcomes the New Jersey animal shelter system should achieve. Out of the 44,418 New Jersey cats coming into the state’s animal shelters in 2015, 30,099 and 8,582 cats should have been adopted out and sent to other shelters/rescues by the facilities originally taking the cats in. However, other New Jersey animal shelters had enough capacity to rescue 26,383 cats or more than three times the number of cats needing rescue from space constrained facilities. Unfortunately, some of the cats needing rescue, such as very young kittens, should not go to a shelter and still must go to either kitten nurseries or foster homes. That being said, many adult cats are in fact killed in New Jersey animal shelters and many facilities with excess space could save these cats.
New Jersey animal shelters have enough excess space to save many cats from out of state as well. Specifically, New Jersey animal shelters had enough physical capacity to rescue and adopt out at least 17,801 cats from out of state shelters or New Jersey’s streets after achieving a greater than 90% live release rate for cats coming into the state’s animal shelters. In reality, the New Jersey shelter system could rescue more than 17,801 cats from out of state shelters or from New Jersey’s streets given the 17,801 figure assumes all cats needing rescue from space constrained New Jersey shelters are sent to other New Jersey shelters as opposed to rescue groups. As explained above, some of the cats needing rescue from New Jersey shelters with a shortage of space are young kittens which should not go to most animal shelters. To put this number into perspective, New Jersey animal shelters contain enough space to make both New York City and Philadelphia no kill cities for cats and increase those cities’ cat live release rates to 92% as follows (per 2015 data):
- New York City – 2,267 additional cats need saving
- Philadelphia – 2,786 additional cats need saving
Certainly, some New Jersey animal shelters do pull some cats from New York City and Philadelphia animal control shelters. Even if I assumed all of the out of state cats rescued by New Jersey animal shelters came from New York City and Philadelphia, that number is only 6% of the number that New Jersey shelters could rescue from New York City and Philadelphia animal control shelters. While some of these cats from New York City and Philadelphia animal control shelters are young kittens which should not go to a normal animal shelter, many other cats could go to New Jersey animal shelters and be adopted out. As a result, the additional number of cats New Jersey animal shelters could save from New York City and Philadelphia is not much lower than the figures above. Thus, New Jersey animal shelters could make New Jersey a no kill state for cats and help other states reach that goal as well.
These adoption goals are quite achievable when comparing the performance of well-run animal control shelters across the country. New Jersey animal shelters would only need to adopt out 6.3 cats per 1,000 people in the state (4.4 cats per 1,000 people if no cats were rescued from out of state and all cats sent to rescue were rescued by other New Jersey animal shelters and adopted out). As a comparison, recent per capita cat adoption numbers from several high performing no kill open admission shelters are as follows:
- Lynchburg Humane Society (Lynchburg, Virginia) – 17.2 cats per 1,000 people
- Tompkins County SPCA (Ithaca, New York area) – 14.8 cats per 1,000 people
- Charlottesville-Albemarle SPCA (Charlottesville, Virginia area) – 11.9 cats per 1,000 people
- Nevada Humane Society (Reno, Nevada and Carson City, Nevada areas) – 9.7 cats per 1,000 people
Thus, many communities are already adopting out significantly more cats than the number I target for New Jersey animal shelters.
Additionally, the adoption target, 6.3 cats per 1,000 people, I set for New Jersey animal shelters is lower than the state of Colorado’s per capita cat adoption rate of 7.7 cats per 1,000 people. Given Colorado still has some regressive animal shelters and only an 84% live release rate for cats, Colorado’s per capita cat adoption rate can increase. Thus, the cat adoption targets I laid out for New Jersey animal shelters are quite achievable.
Cat Deaths Vary Widely at New Jersey Animal Shelters
The goal of any properly managed animal shelter is to save all of its healthy and treatable animals. In some cases, such as selective admission rescue oriented shelters, it is pretty easy to not kill animals. In addition, other animal shelters with easy to service animal control contracts (i.e. few animals impounded) can avoid unnecessary killing due to having lots of extra space. As a result, some shelters may have an easier time than others in preventing killing at their shelters.
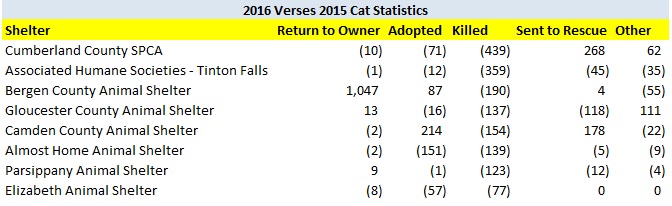
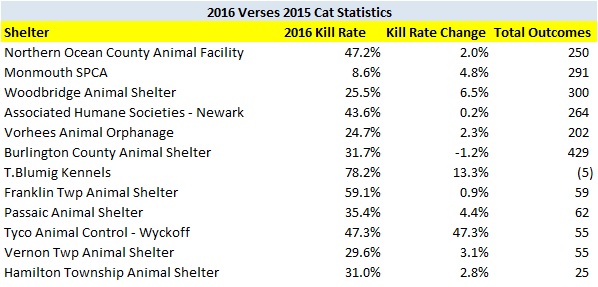
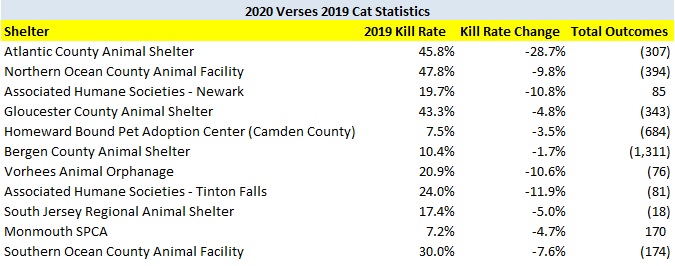
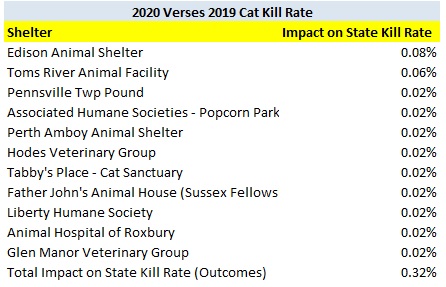
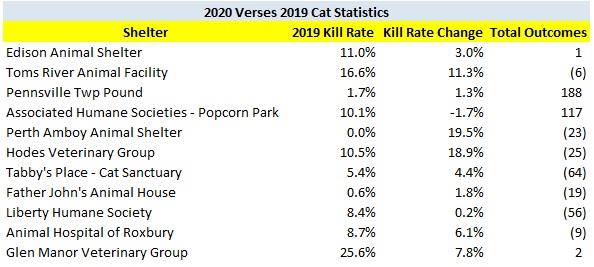
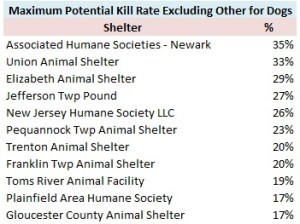
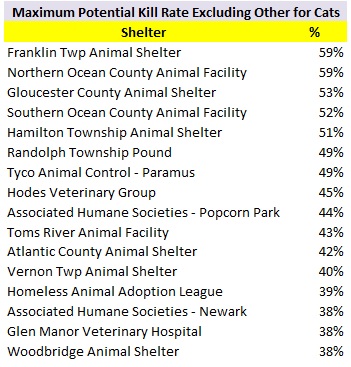
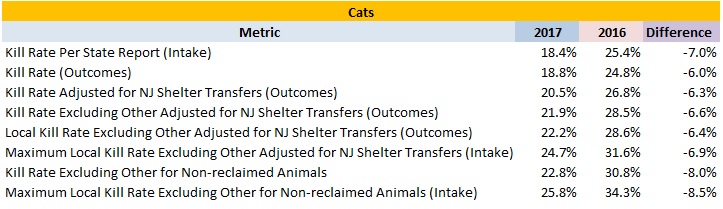
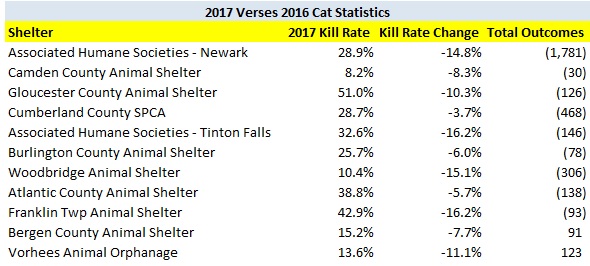
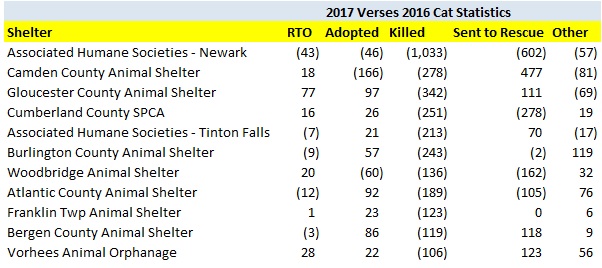
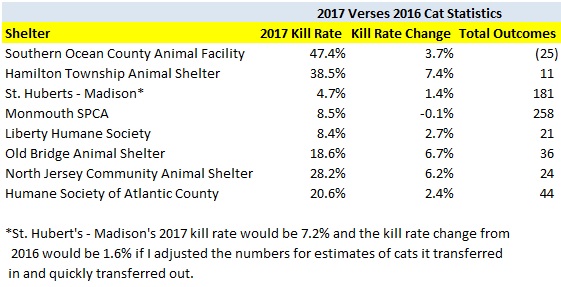
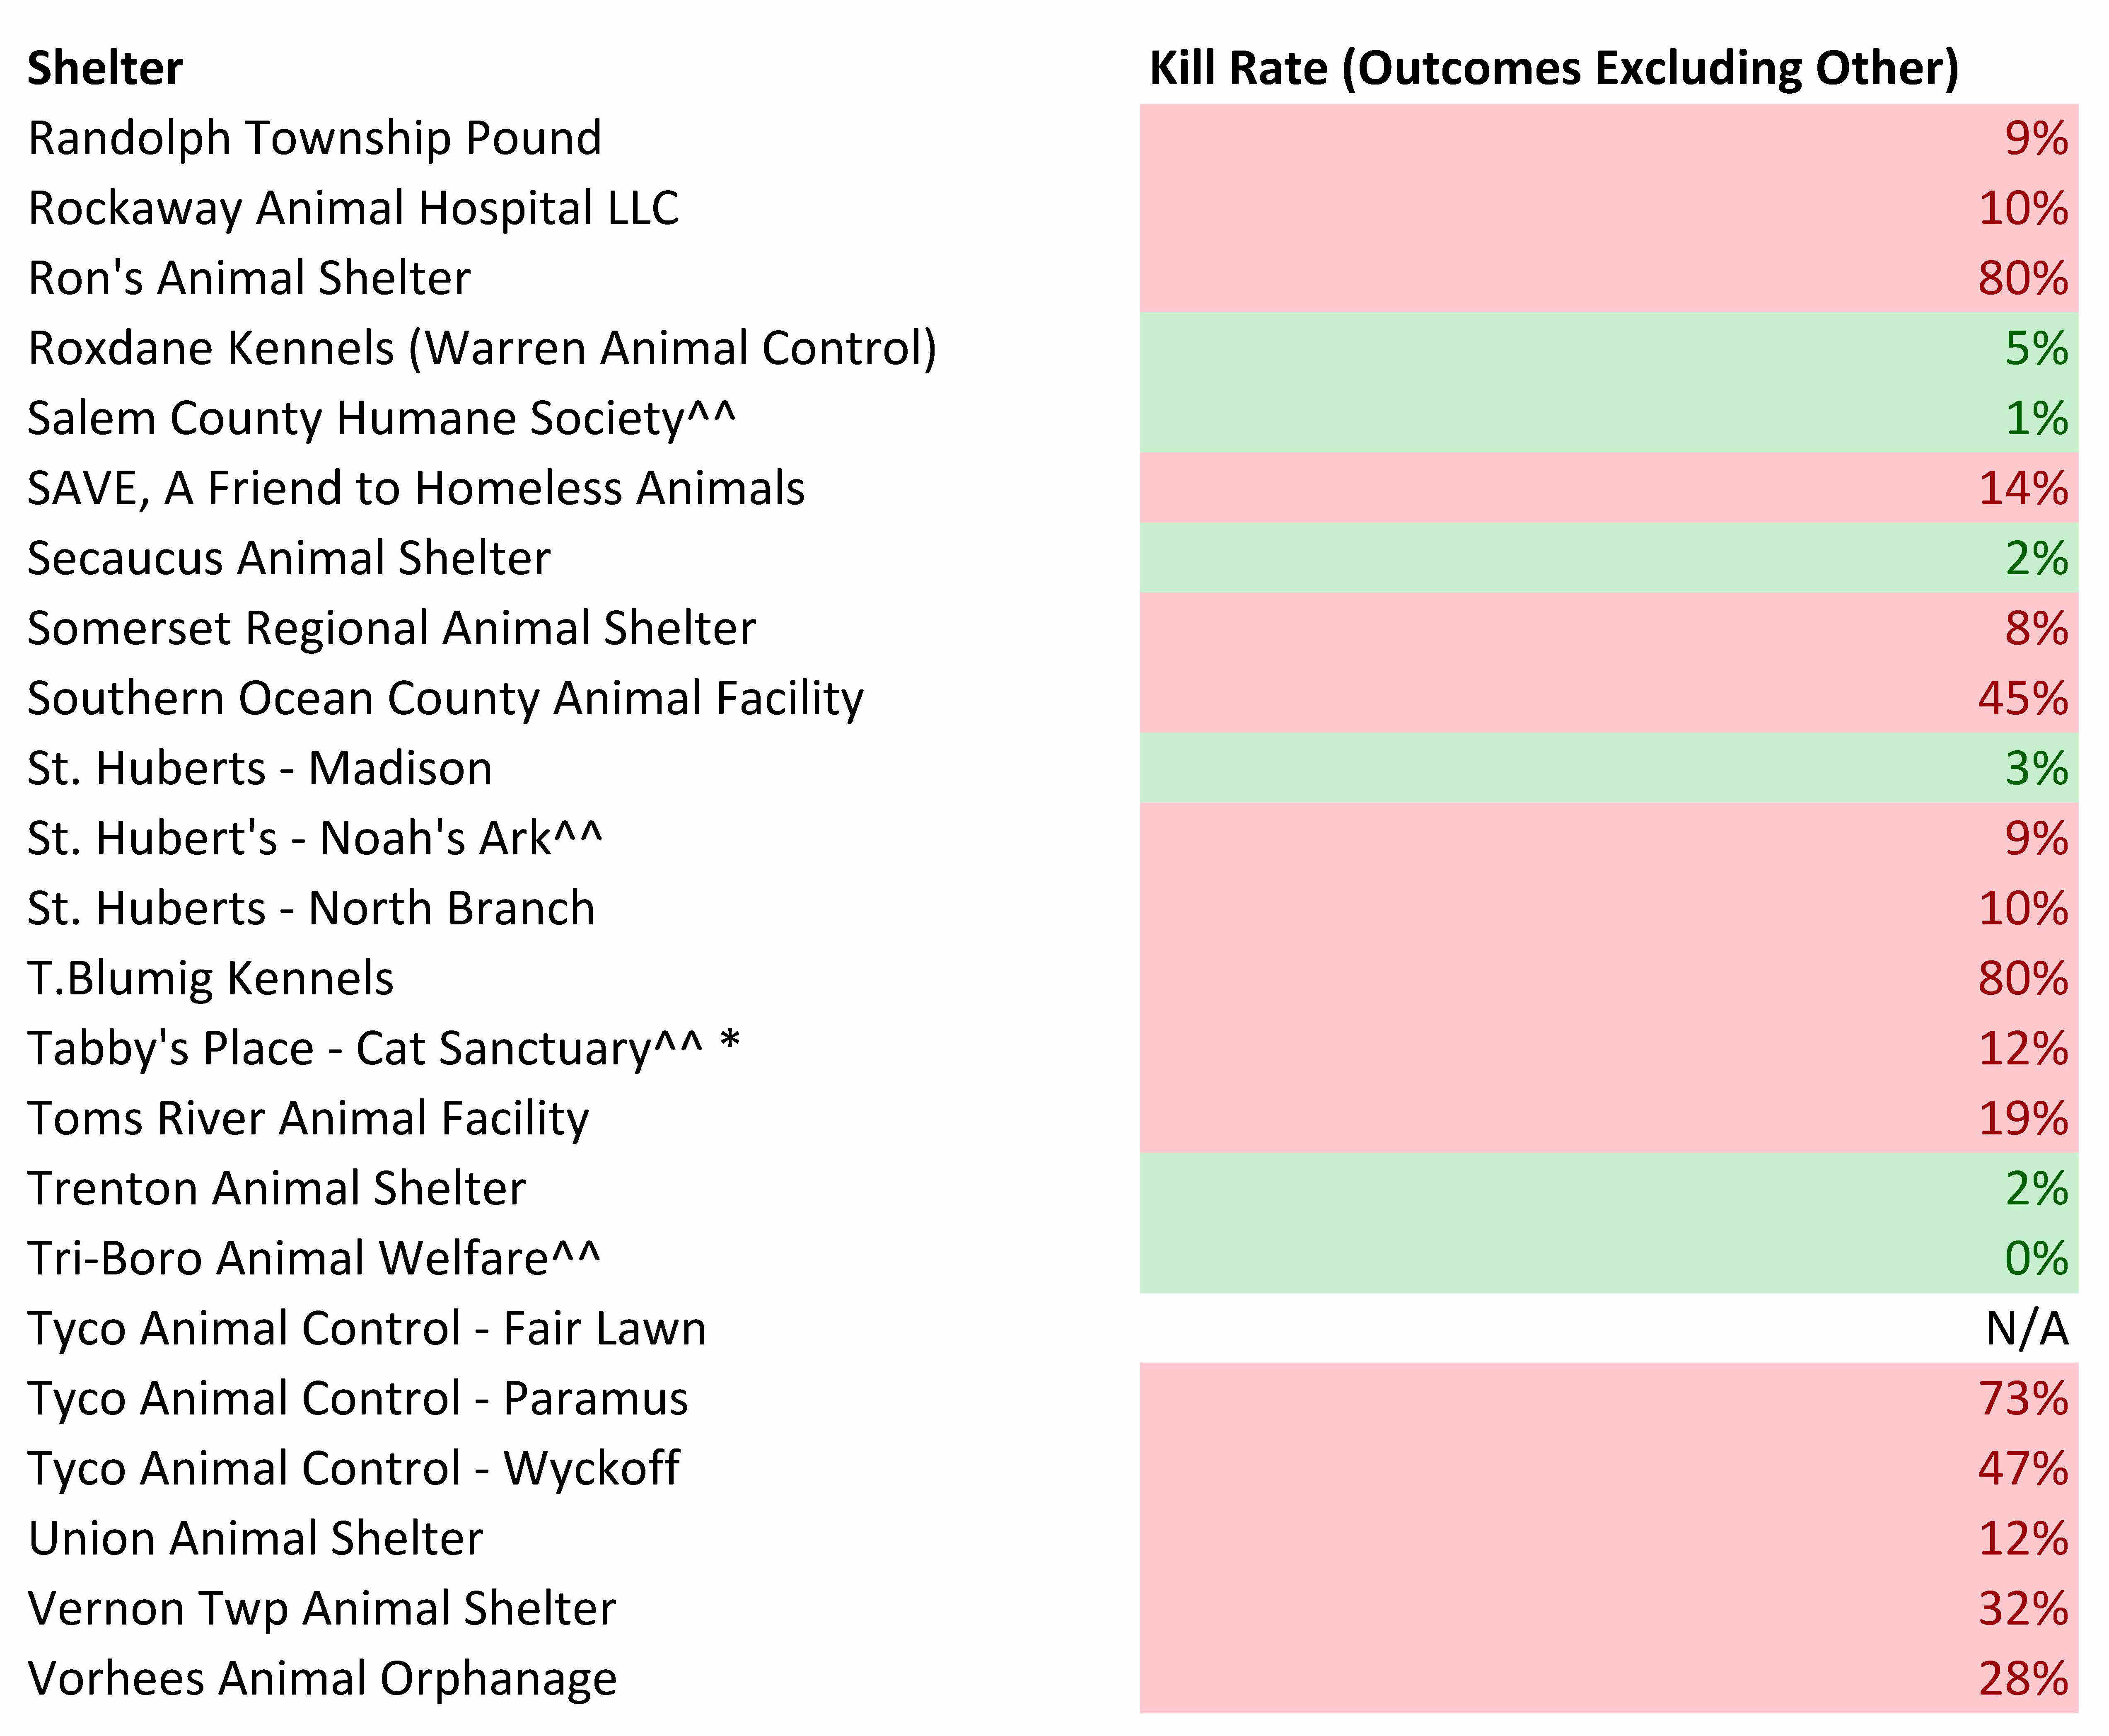
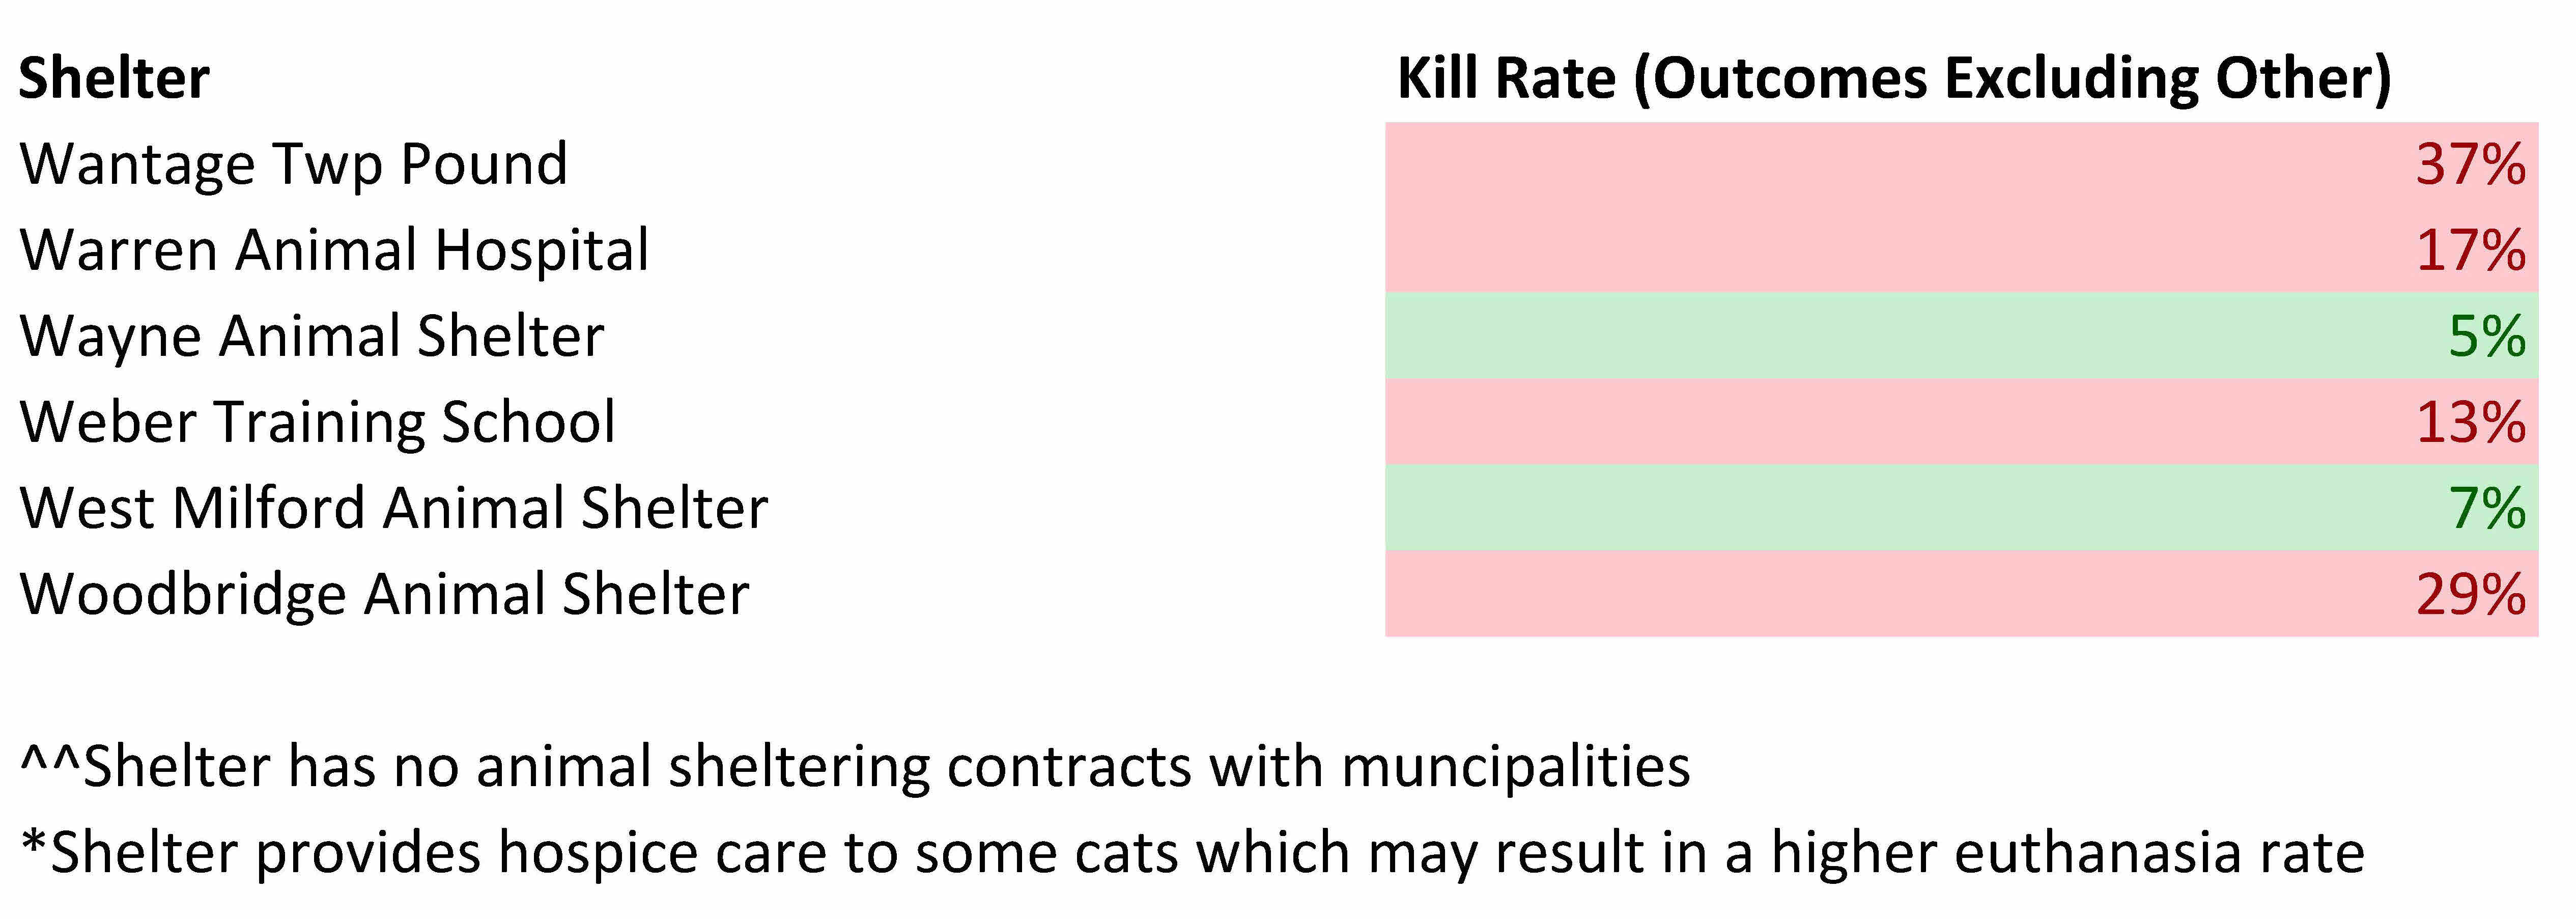
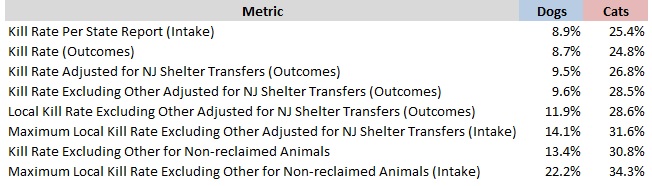
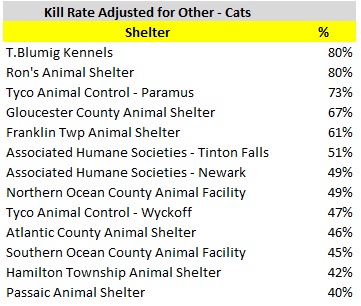
The tables below detail the cat kill rates at each New Jersey animal shelter. These figures do not include cats who died or went missing. Shelters having cat kill rates equal to or less than 8% and greater than 8% are highlighted in green and red in the tables below.
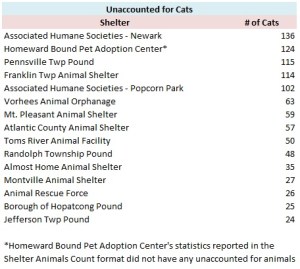
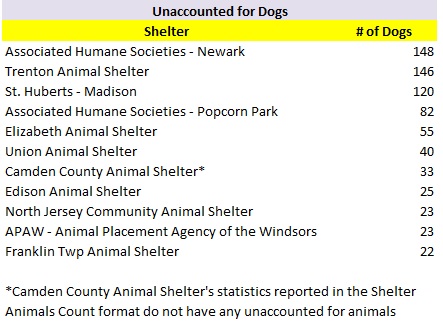
The overall results show too many cats are unnecessarily losing their lives at New Jersey animal shelters. 12,370 savable cats lost their lives or went missing at New Jersey animal shelters in 2015 under the assumption cats classified as “Other” in each shelter’s statistics died or went missing. While some of the cats in the “Other” Category may have went through TNR programs, it has been my experience based on reviews of underlying records from several local shelters that most of the cats in the “Other” category died or went missing. Obviously, some of the cats shelters killed were truly feral and required TNR or placement as barn/warehouse cats, but surely many others could have been adopted out. Thus, New Jersey’s shelter system is failing its cats.
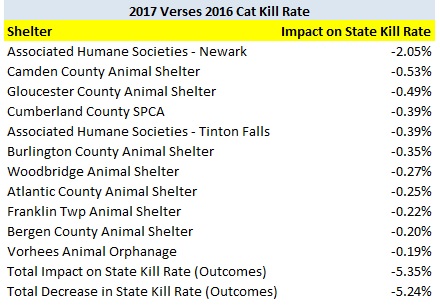
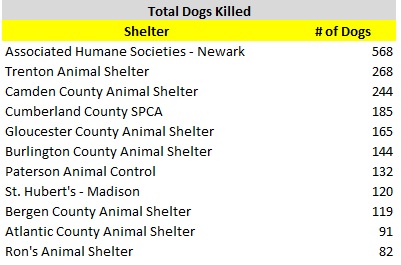
Several animal shelters in South Jersey and elsewhere account for a large percentage of the savable cats unnecessarily losing their lives. Specifically, Gloucester County Animal Shelter, Cumberland County SPCA, Burlington County Animal Shelter, Atlantic County Animal Shelter and Camden County Animal Shelter account for 5,695 or 46% of the 12,370 cats needlessly losing their lives. Associated Humane Societies three shelters had 2,285 cats unnecessarily lose their lives in 2015. Northern Ocean County Animal Facility and Southern Ocean County Animal Facility had 978 cats lose their lives needlessly in 2015. Bergen County Animal Shelter, which happens to serve many towns in one of the country’s wealthiest counties, had 495 cats unnecessarily lose their lives in 2015. Collectively, these 11 shelters are 11% of the state’s shelters and account for 9,453 or 76% of the cats needlessly losing their lives.
Rescue oriented shelters generally had fewer cats lose their lives than targeted. While saving large numbers of cats is what we all want, some of these shelters may have achieved this result by taking in easier cats. Austin Pets Alive, which is a rescue oriented shelter in Texas, has developed some of the most innovative cat programs and only had a cat live release rate of 94% in 2015. This was due to Austin Pets Alive taking in many cats requiring significant treatment, such as neonatal kittens, from the city animal control shelter. As a result, some of the rescue oriented shelters with significantly fewer cats euthanized than targeted may have avoided taking in many of the more difficult cases.
Several animal control shelters euthanized the targeted number of cats or fewer. Borough of Hopatcong Pound, Byram Township Animal Shelter, Cape May County Animal Shelter, Denville Animal Shelter, Edison Animal Shelter, Ewing Animal Shelter, Father John’s Animal House, Humane Society of Ocean County, Liberty Humane Society, Monmouth SPCA, Montclair Animal Shelter, Montgomery Township Animal Shelter, Pequannock Township Animal Shelter, Perth Amboy Animal Shelter, Randolph Township Pound, Rockaway Animal Hospital LLC, Secaucus Animal Shelter, Somerset Regional Animal Shelter, St. Hubert’s-Madison, Trenton Animal Shelter, Wayne Animal Shelter and West Milford Animal Shelter prove animal control shelters can avoid killing healthy and treatable cats.


Space Constrained Facilities Not Receiving Enough Support from Rescues and Other Animal Shelters
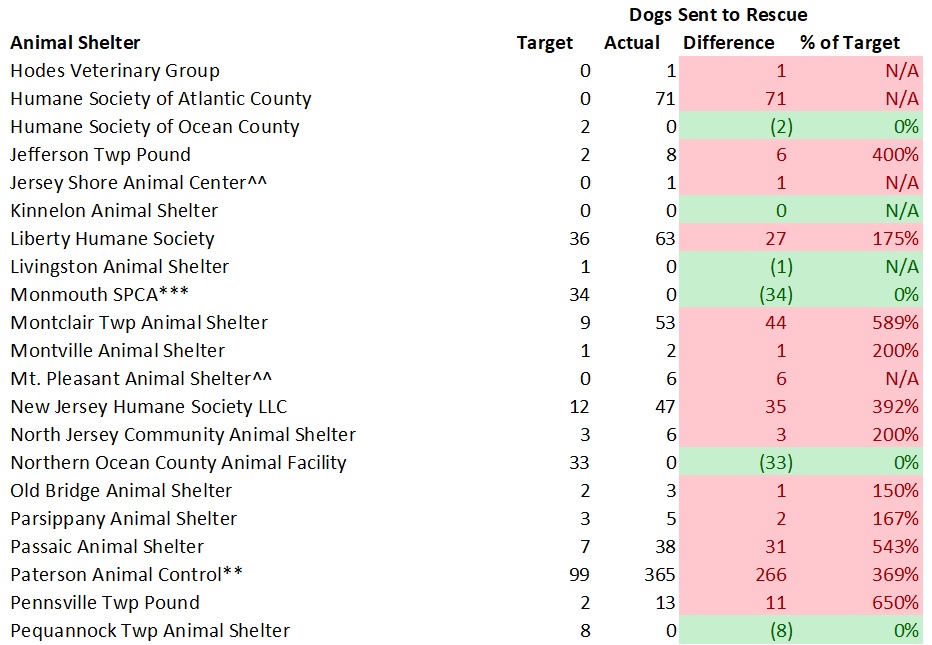
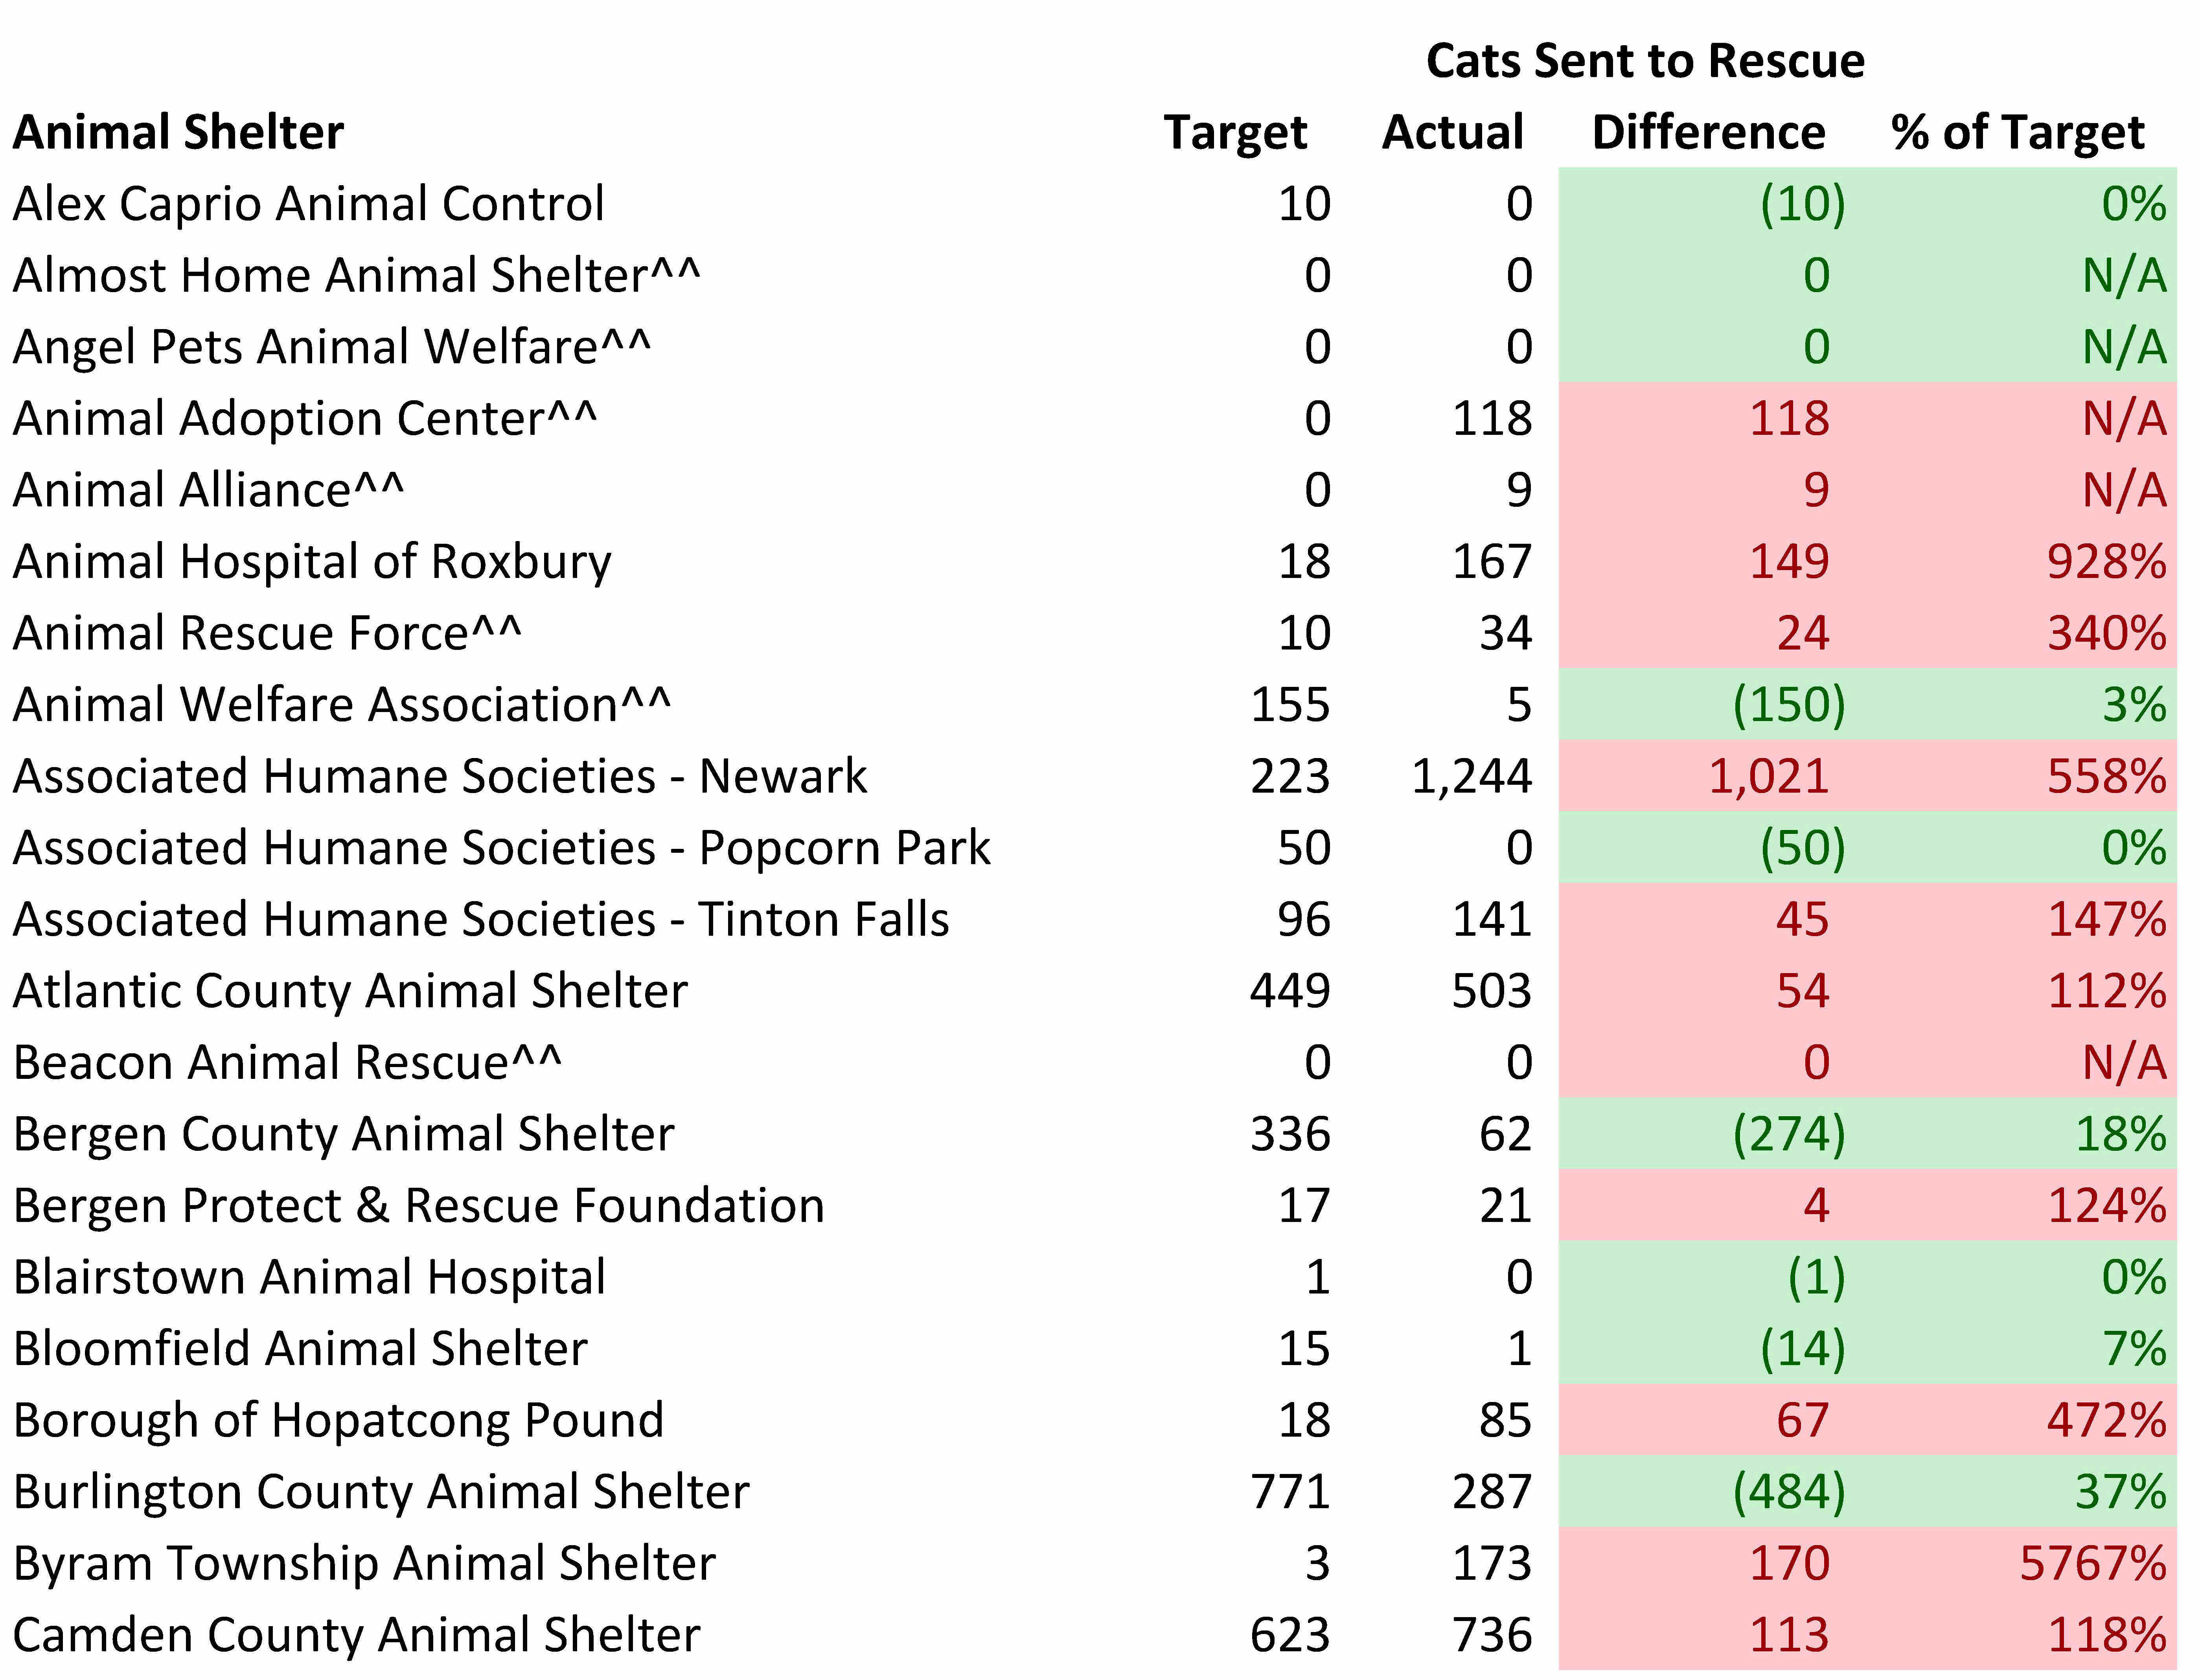
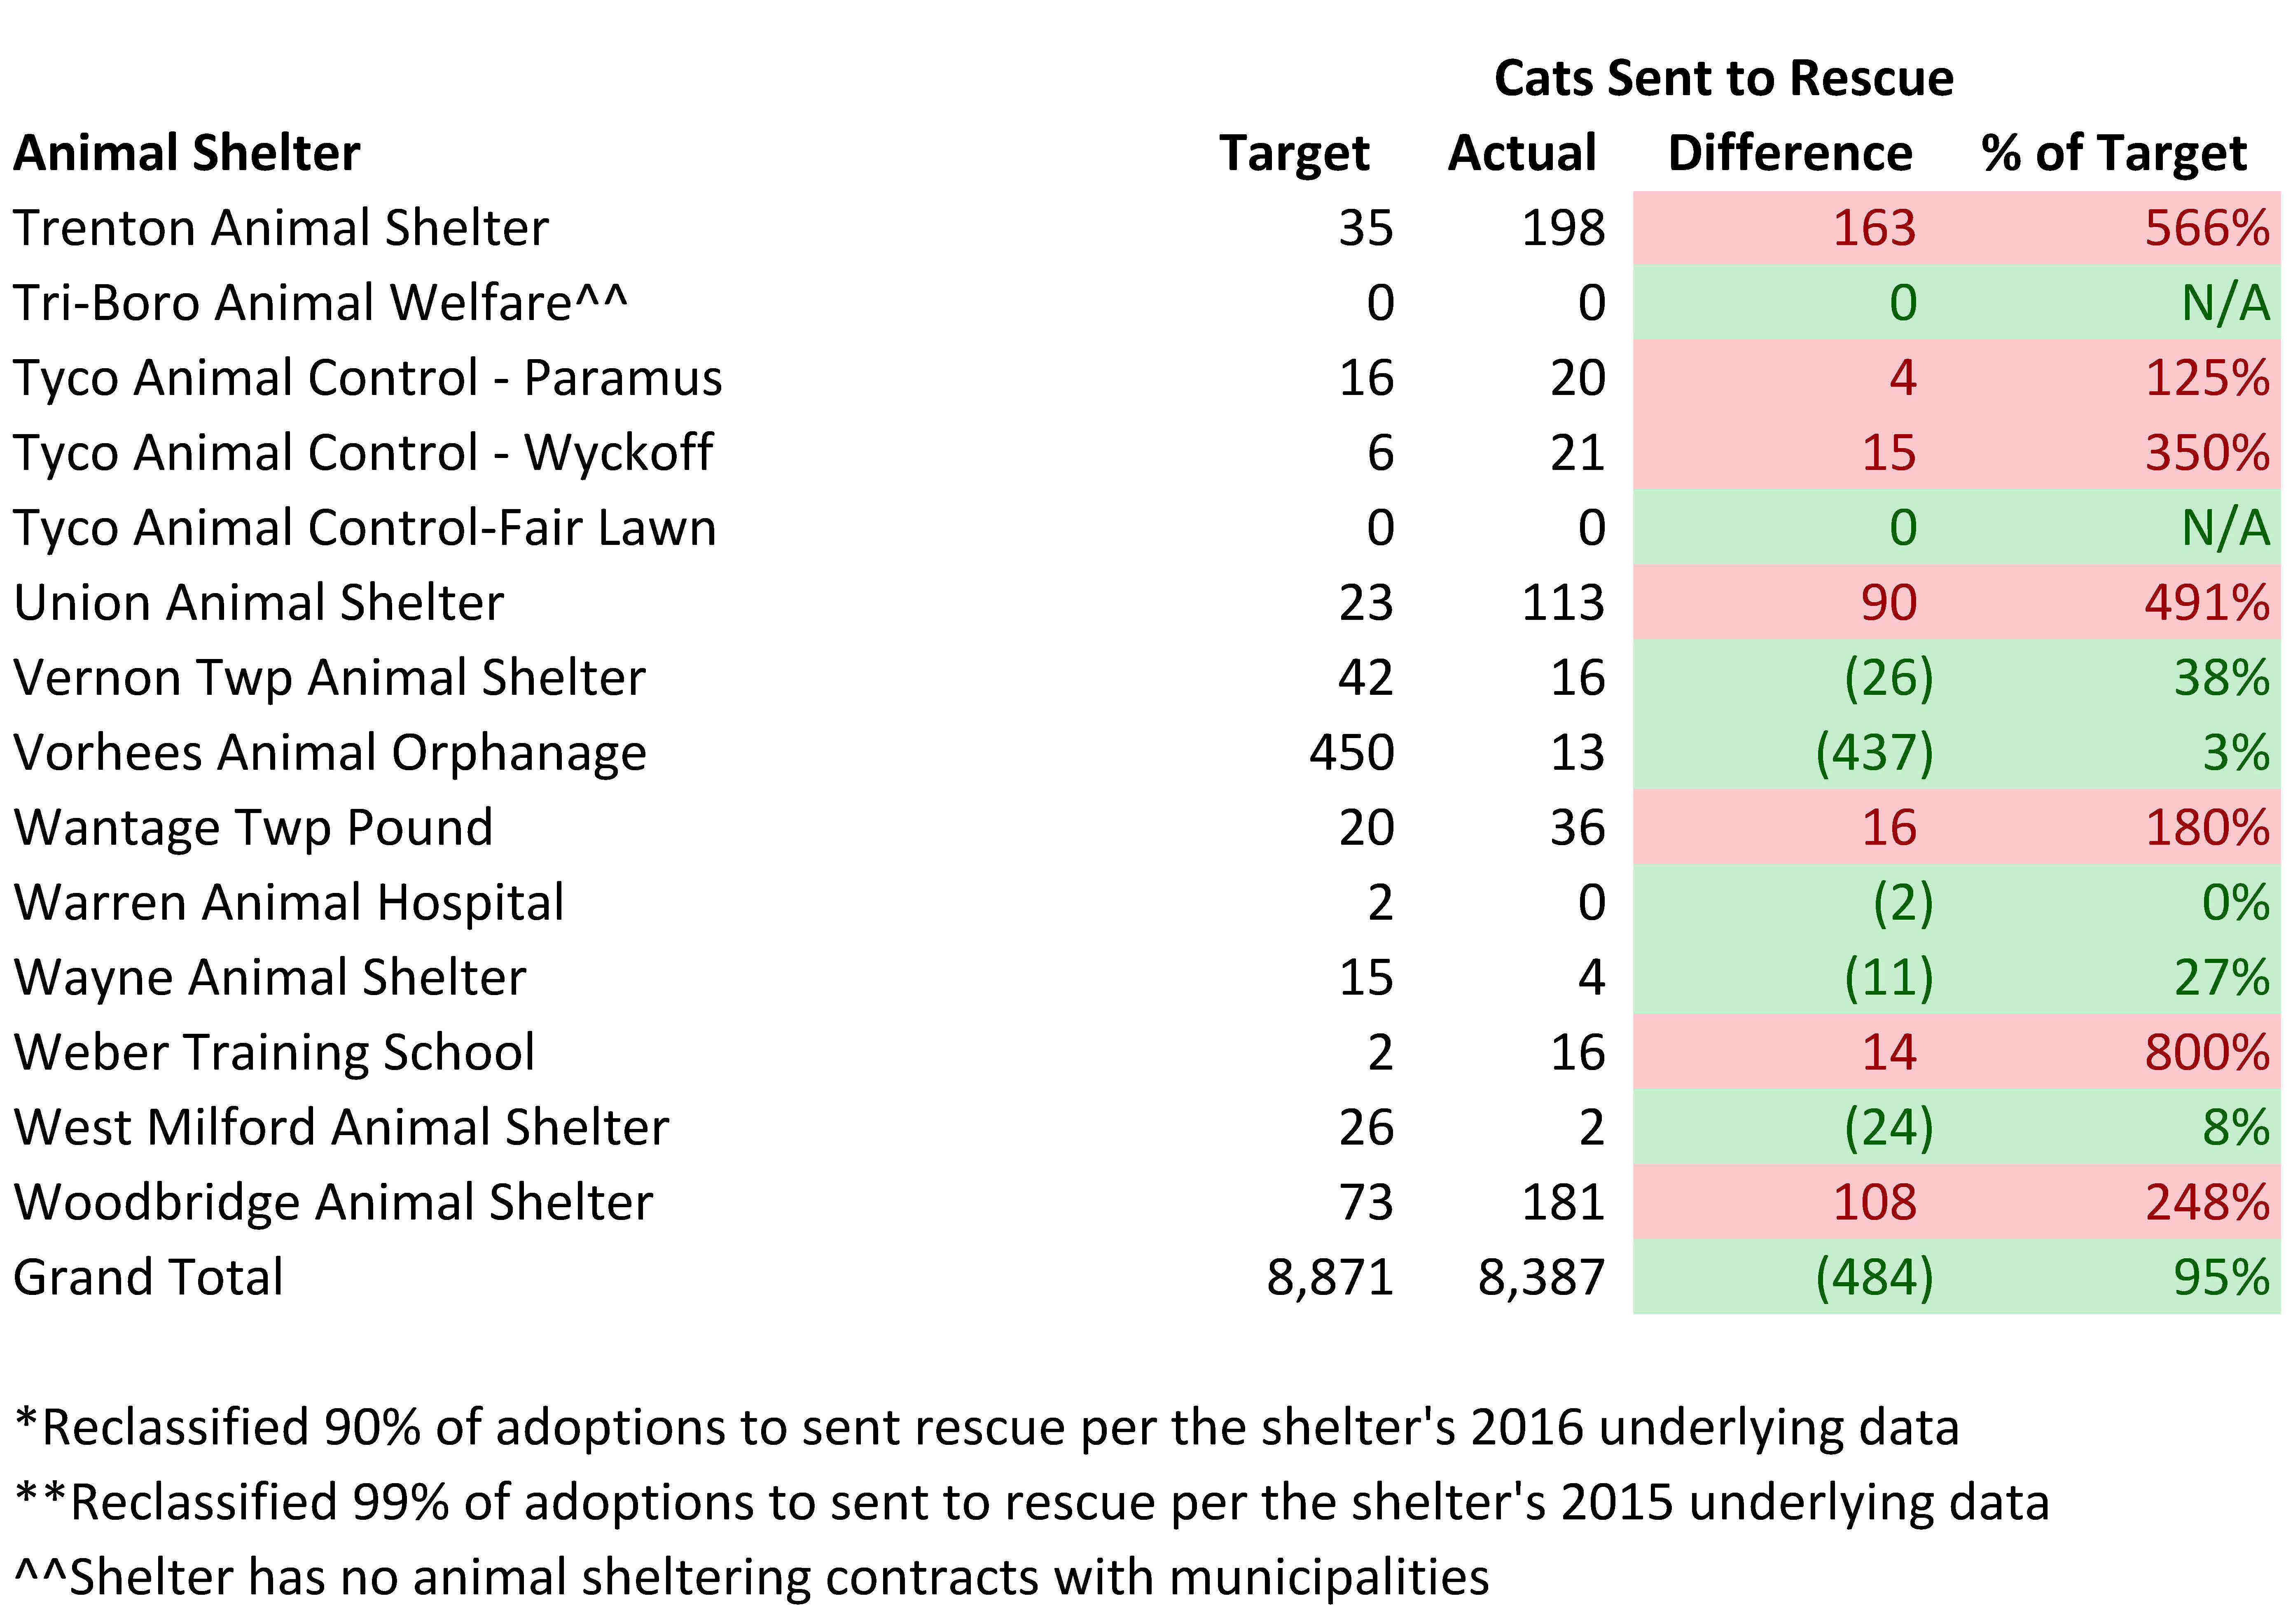
Some animal shelters will require more support from rescues and animal shelters with excess space than others. If a shelter has relatively high intake and very limited space, it will need more help than other shelters. While sending animals to rescues is a good thing, we do want shelters most needing rescue support to receive that help given rescues have limited resources. The tables below compare the number of cats a shelter should transfer to other organizations per the model and the number of cats actually sent to other animal welfare groups. Shelters marked in green are receiving less than the expected rescue support while facilities marked in red are receiving too much rescue help.
Overall, New Jersey shelters are not receiving enough help from other animal welfare organizations. While the overall number of cats rescued was 93% of the amount needed for the state as a whole, the actual number was 48% since many cats were rescued from facilities which did not require so much rescue assistance. Only 25 out of the 74 facilities needing rescue assistance received the required support. In other words, only 34% of the animal shelters needing rescue help received the amount these facilities require.
We truly need to understand the reasons for this rescue shortfall. While poor data collection (i.e. shelters classifying rescues as adoptions) may explain part of this rescue deficit, the large size of this number points to other causes as well. For example, New Jersey shelters significantly exceeded their dog rescue needs, but just 34% of shelters needing cat rescue assistance received the needed support. Certainly, some of these cats are feral and not candidates for most rescues. However, many other cats surely are home-able. Many high kill facilities may not reach out to rescues for cats, such as during kitten season, as much as they do for dogs. This data supports the need for the Companion Animal Protection Act (“CAPA”), which requires shelters to contact rescues and other facilities at least two business days before killing animals. On the other hand, shelters with excess capacity may not be doing their part to save cats from space constrained facilities.
Several shelters received too much rescue help. Rescues may want to help these organizations due to rescue friendly policies. Alternatively, these shelters may be relying too heavily on rescues to save their animals. Shelters (excluding St. Hubert’s which transfers cats as part of national rescue campaigns) receiving the most extra rescue support were as follows:
- Associated Humane Societies-Newark – 648 more cats transferred than necessary
- Paterson Animal Control – 264 more cats transferred than necessary (estimated due to the shelter’s incorrect reporting of rescues as adoptions)
- Liberty Humane Society – 176 more cats transferred than necessary
- Trenton Animal Shelter – 167 more cats transferred than necessary
- Atlantic County Animal Shelter – 165 more cats transferred than necessary
- Toms River Animal Facility – 163 more cats transferred than necessary
While Liberty Humane Society is known as a progressive shelter, most of the other facilities are not good in my opinion. Local activists have campaigned to remove Toms River Animal Facility’s Shelter Director, Jim Bowen. Associated Humane Societies-Newark has a history of problems and kills animals for ridiculous reasons. Paterson Animal Control has no volunteer program, no social media page or even a website with animals for adoption. Thus, many shelters receiving greater than expected rescue support seem to do little more than allow rescues to save the day.
On the other hand, many space constrained shelters received far less rescue help than needed. Facilities receiving the lowest amount of rescue support in relation to their needs were as follows:
- Cumberland County SPCA – 668 fewer cats transferred than necessary
- Northern Ocean County Animal Facility – 420 fewer cats transferred than necessary
- Vorhees Animal Orphanage – 266 fewer cats transferred than necessary
- Southern Ocean County Animal Facility – 243 fewer cats transferred than necessary
- Bergen County Animal Shelter – 194 fewer cats transferred than necessary
- Gloucester County Animal Shelter – 168 fewer cats transferred than necessary
- Parsippany Animal Shelter – 155 fewer cats transferred than necessary
- Camden County Animal Shelter – 104 fewer cats transferred than necessary
The million dollar question is why do these shelters receive very little rescue help? Some, such as Northern Ocean County Animal Facility and Southern Ocean County Animal Facility, reported no cats sent to rescues and may incorrectly count these animals as adopted. As you will see below, Vorhees Animal Orphanage adopts out many cats and is doing a good job. On the other hand, Gloucester County Animal Shelter routinely illegally killed animals during the 7 day hold period, allowed disease to spread like wildfire and does not adopt out animals at the shelter on weekends. Similarly, Bergen County Animal Shelter is a high kill facility and refuses to even give information to rescues over the phone. Parsippany Animal Shelter has long had a tumultuous relationship with the animal welfare community. As a result, shelters receiving too little rescue help may or may not be doing their part to get that assistance.
Rescue groups and shelters with extra space should pull cats from kill shelters with the highest rescue “target” numbers and deficits in the tables below. If shelters not needing rescue support get that extra help, these shelters will not take the steps necessary to properly run their facilities. As a result of enabling poorly performing shelters and not pulling cats from truly space constrained facilities, rescuing cats from shelters with enough space leads to less lifesaving.
Shelters receiving less than needed rescue support should also examine their own policies and performance. Are the shelter’s operating processes allowing too many animals to get sick and therefore discouraging organizations to rescue their animals due to subsequent medical costs? Does the shelter actively reach out to rescues/other shelters and treat them with respect? Does the shelter make it convenient for other organizations to pull their animals?
Given killing animals for space is intolerable, the space-constrained shelters need to expand their effective cat capacity. These facilities could use extra space in their buildings to house cats on a short-term basis. These shelters can enter into arrangements with local veterinarians and local pet stores to house and adopt out some cats. Furthermore, shelters can create or expand foster programs to increase the number of cats cared for. Additionally, creating a pet owner surrender prevention program and an appointment system for owners willing to delay surrendering their cats could free up space in these shelters. Finally, space-constrained shelters with multiple animal control contracts should terminate some of these arrangements to bring their capacity for care in line with the number of cats they take in. As a result, space constrained shelters still need to take active steps to reduce killing rather than simply solely relying on rescue support.


Most New Jersey Animal Shelters Fail to Come Close to Reaching Their Cat Adoption Potential
We can assess each shelter’s contribution to making New Jersey and nearby areas no kill. While a shelter may be able to avoid killing healthy and treatable animals, it still may not live up to its potential for adopting out cats. On the other hand, a space constrained shelter may kill healthy and treatable cats, but still do a good job adopting animals out.
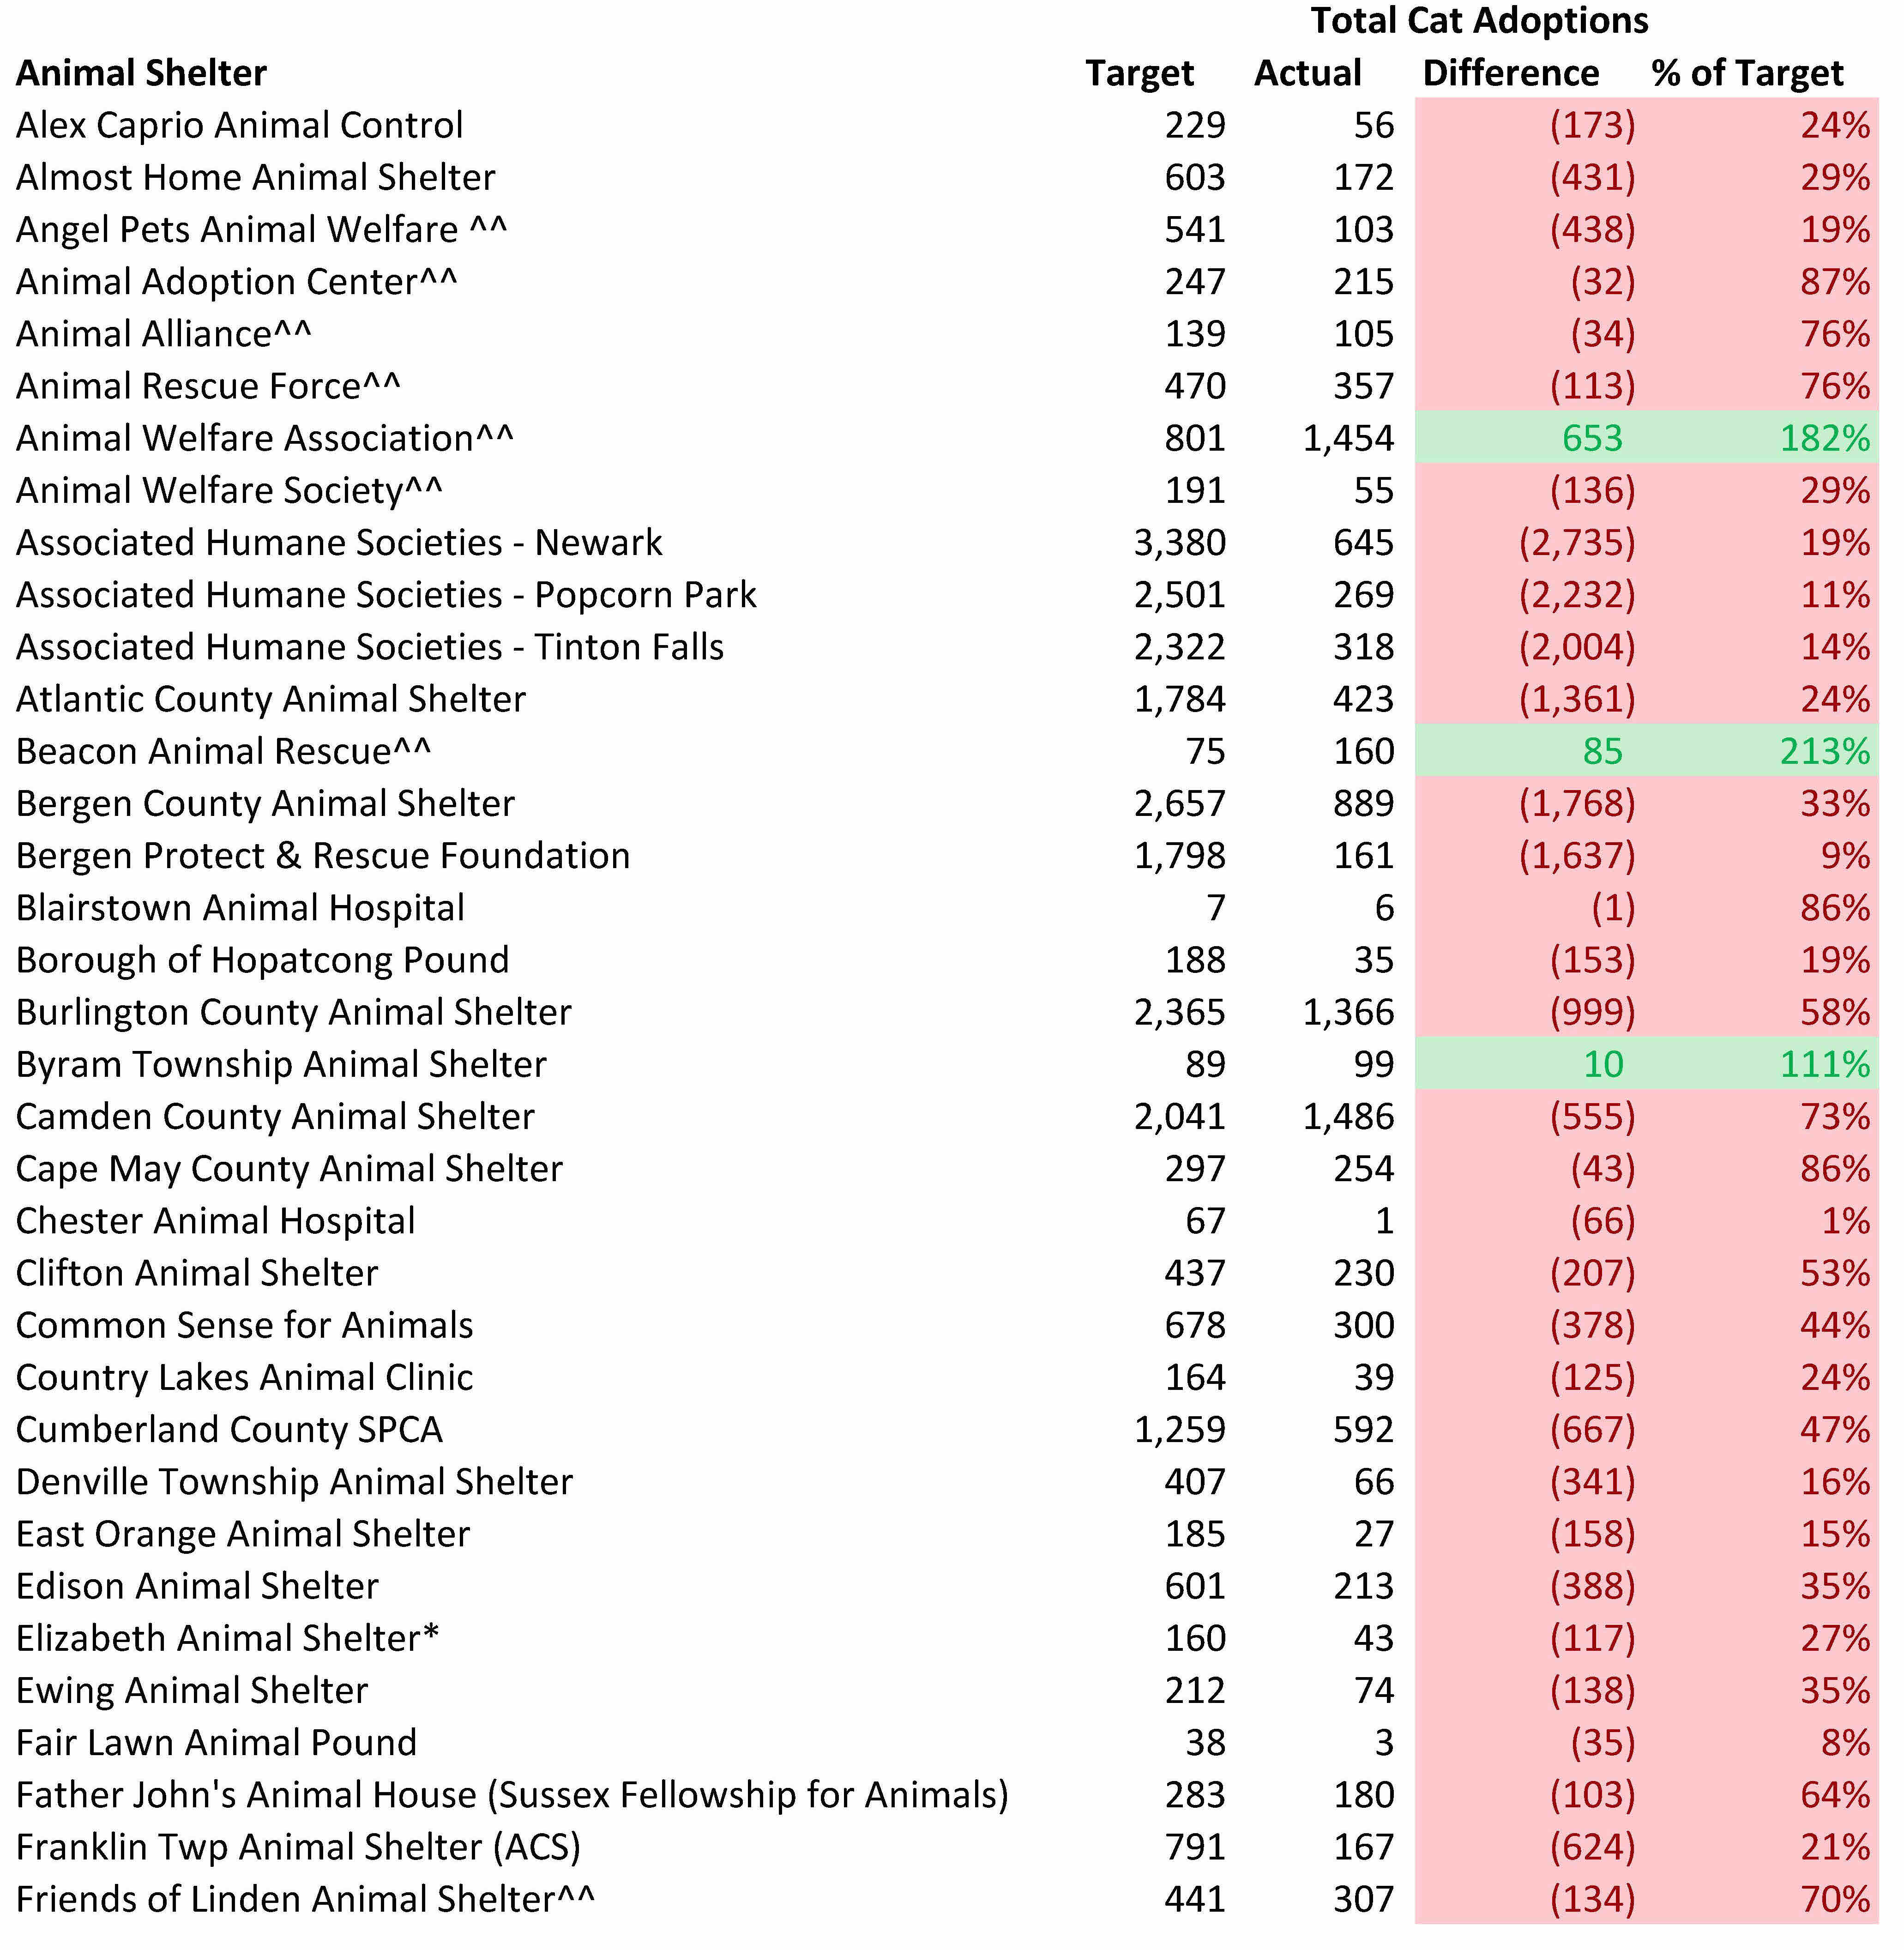
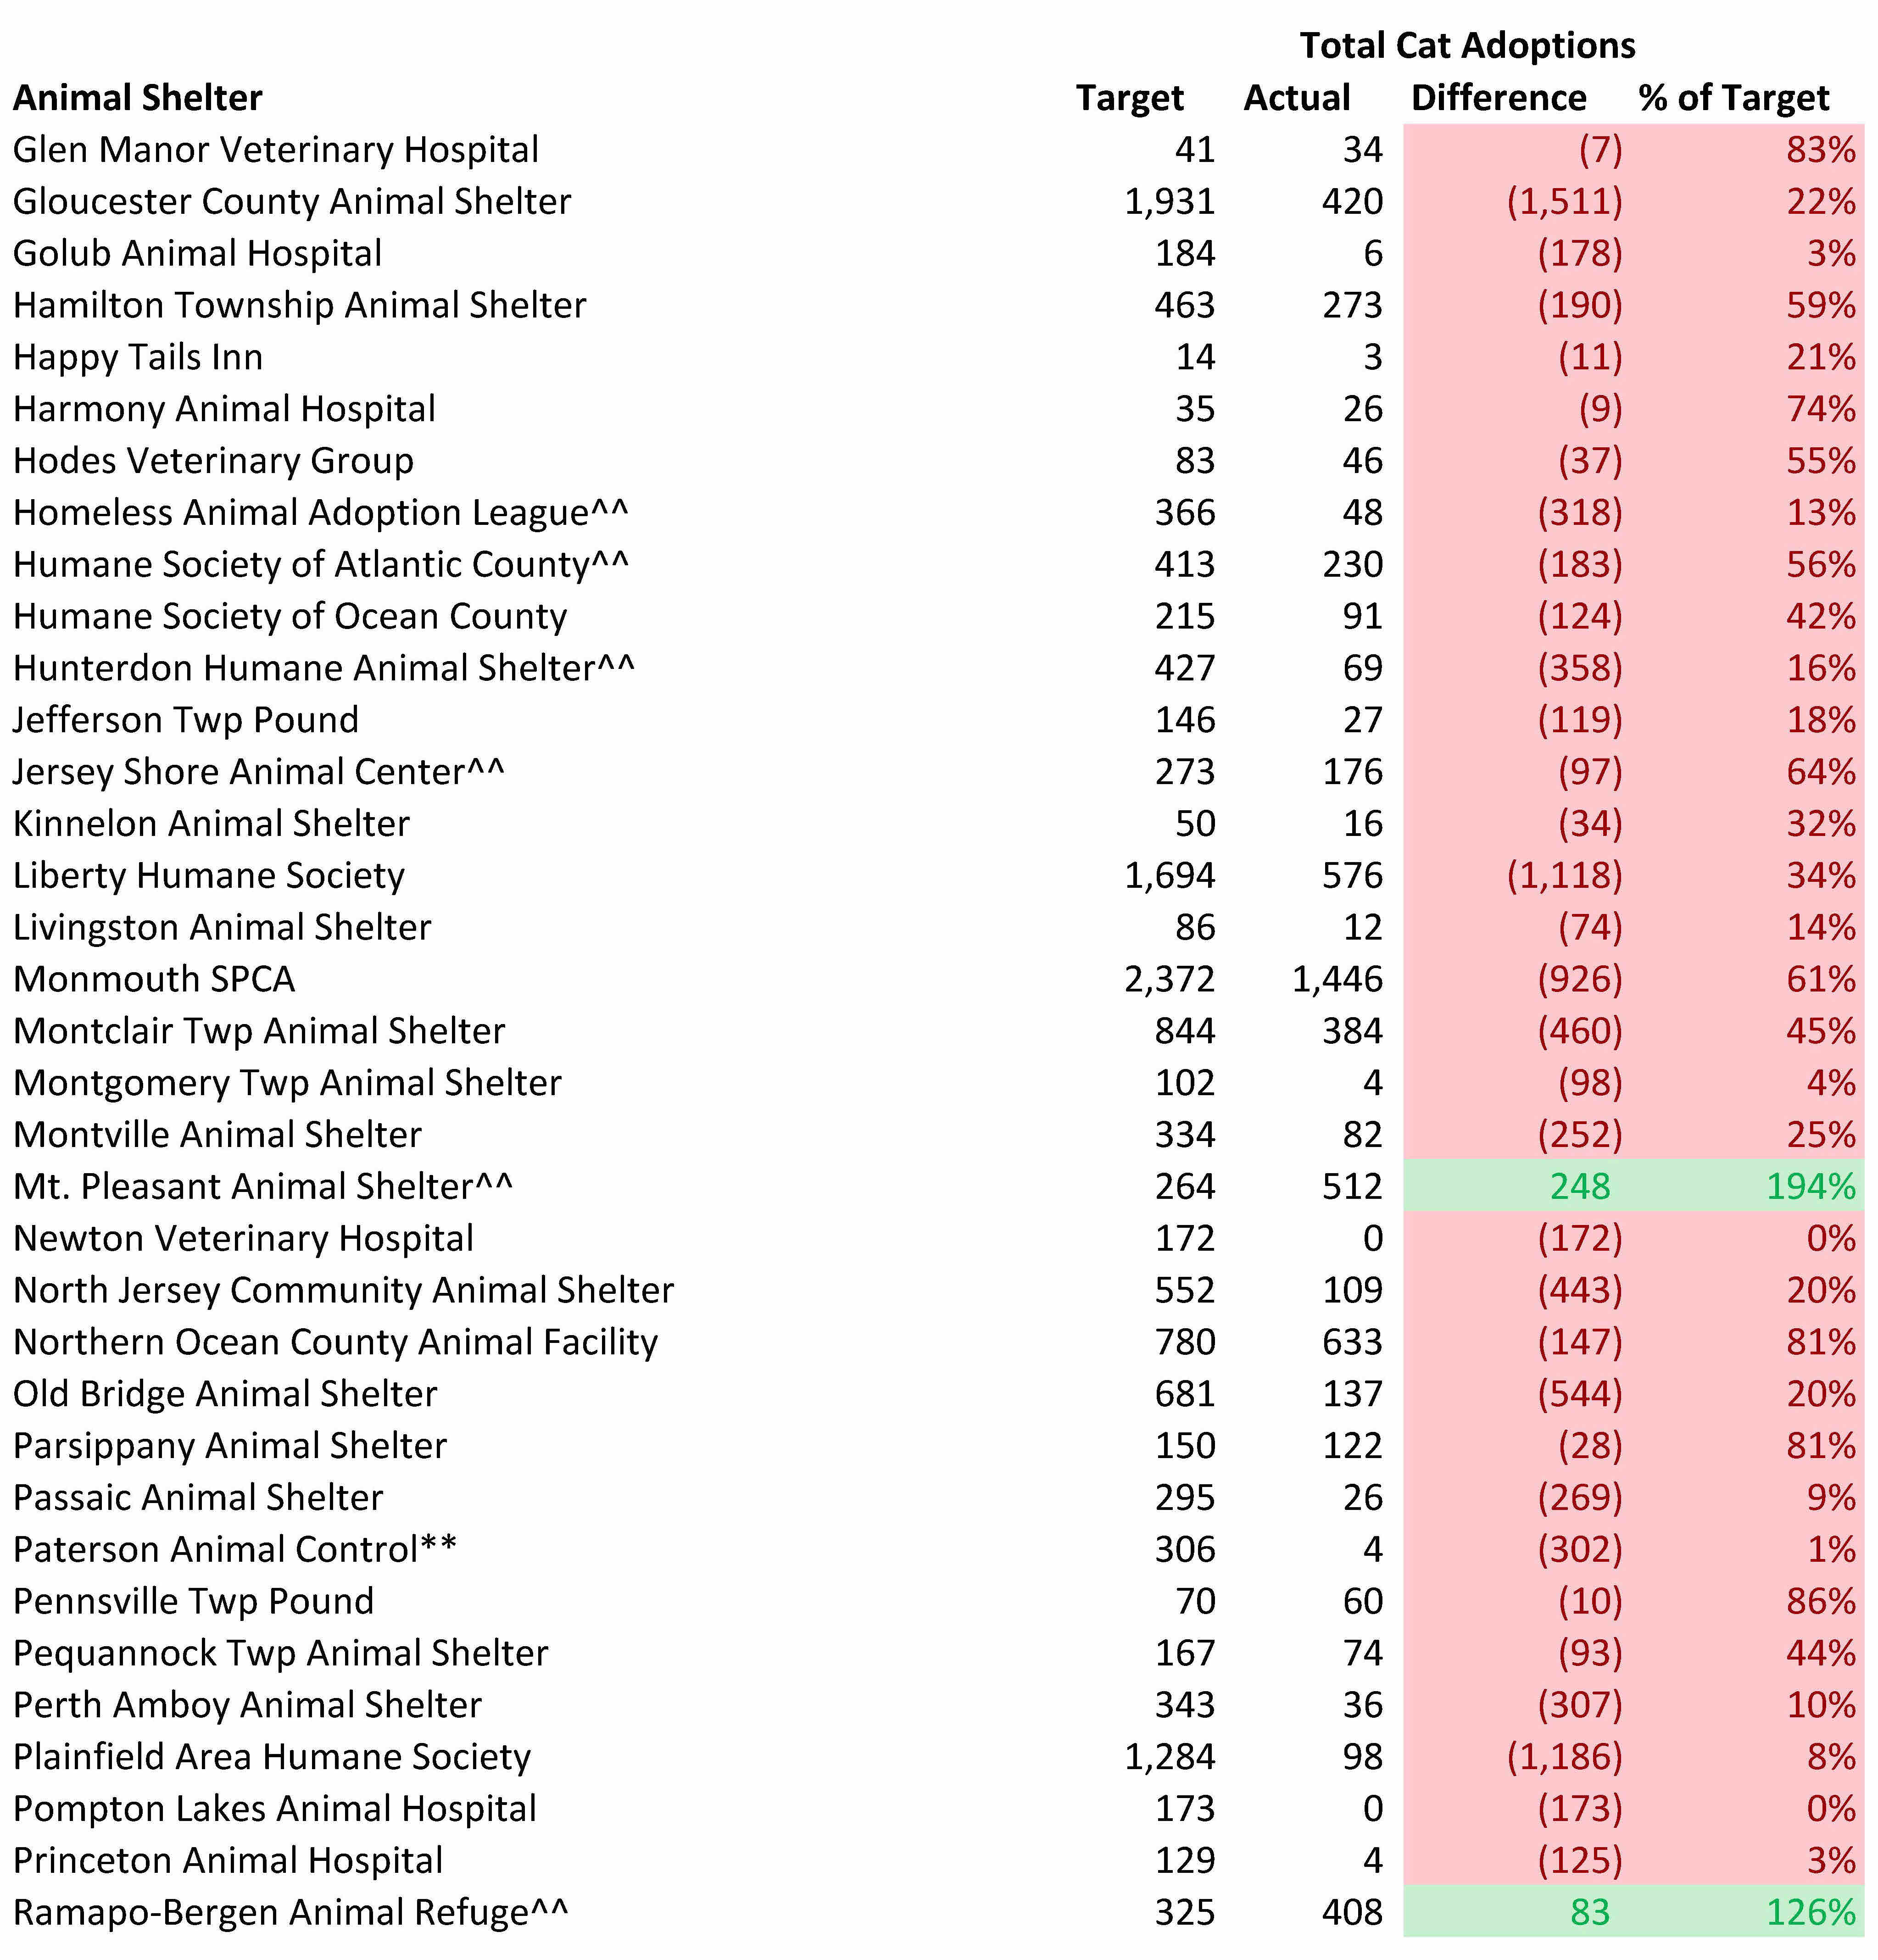
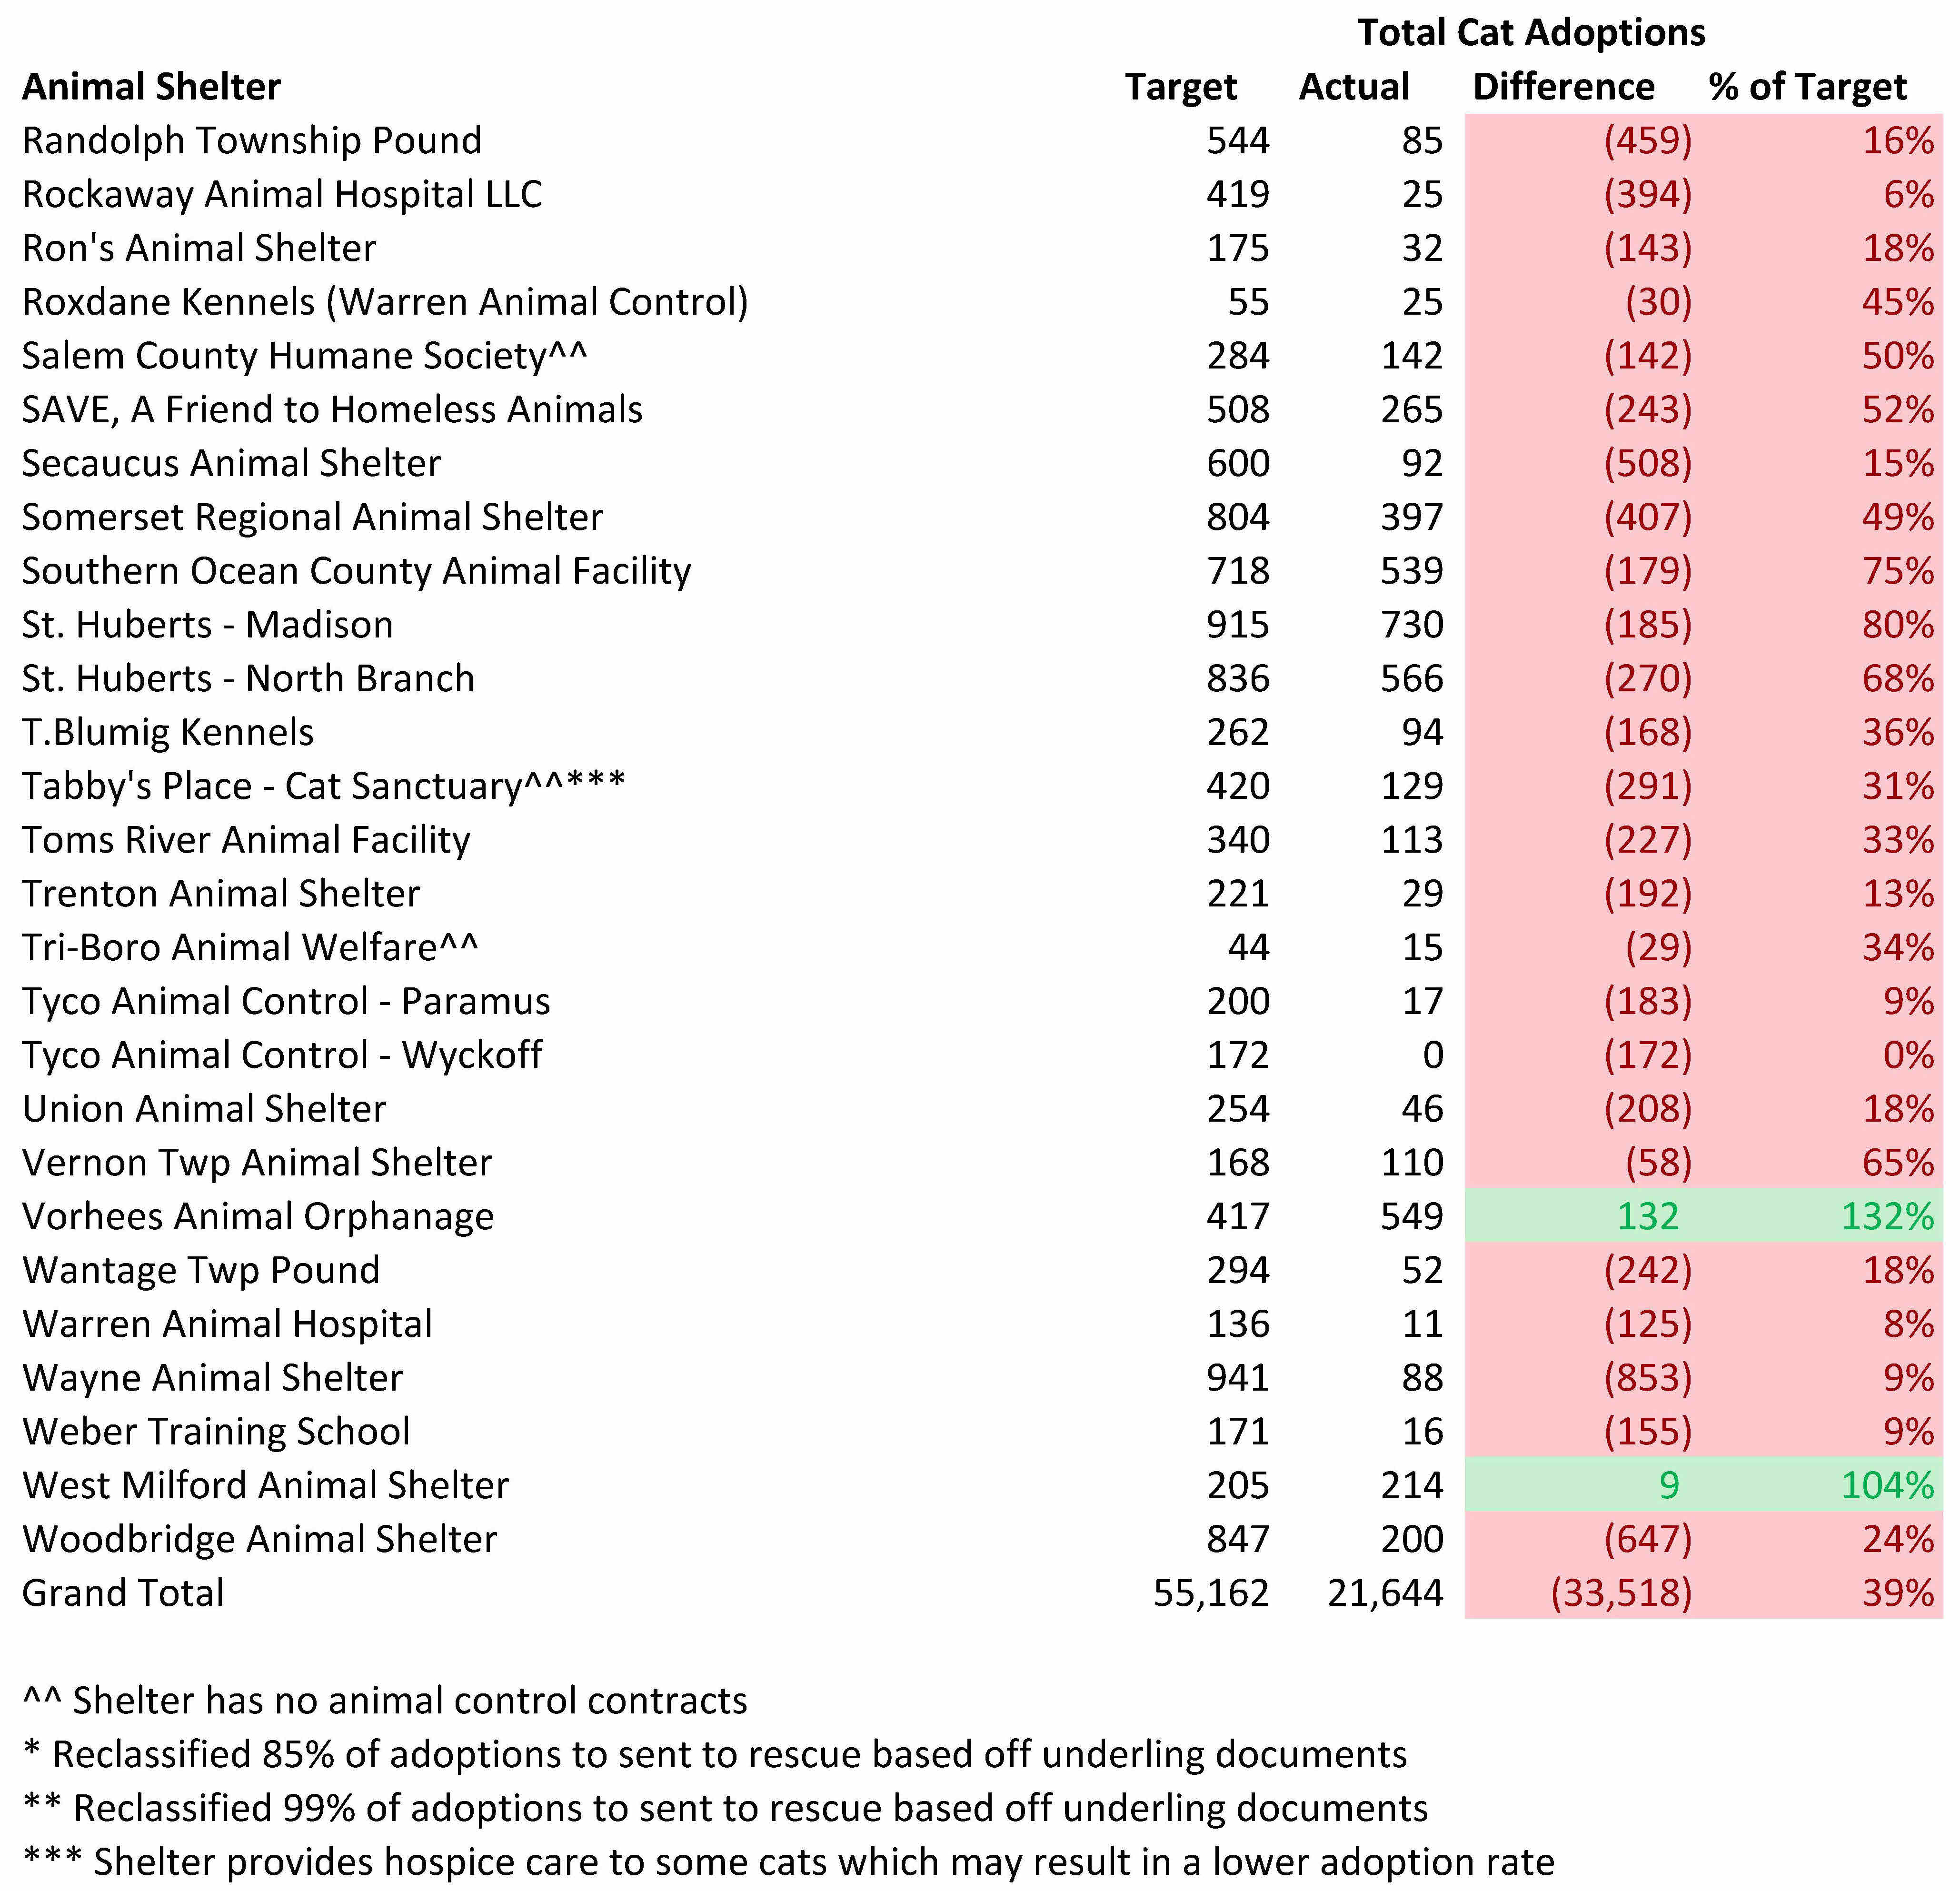
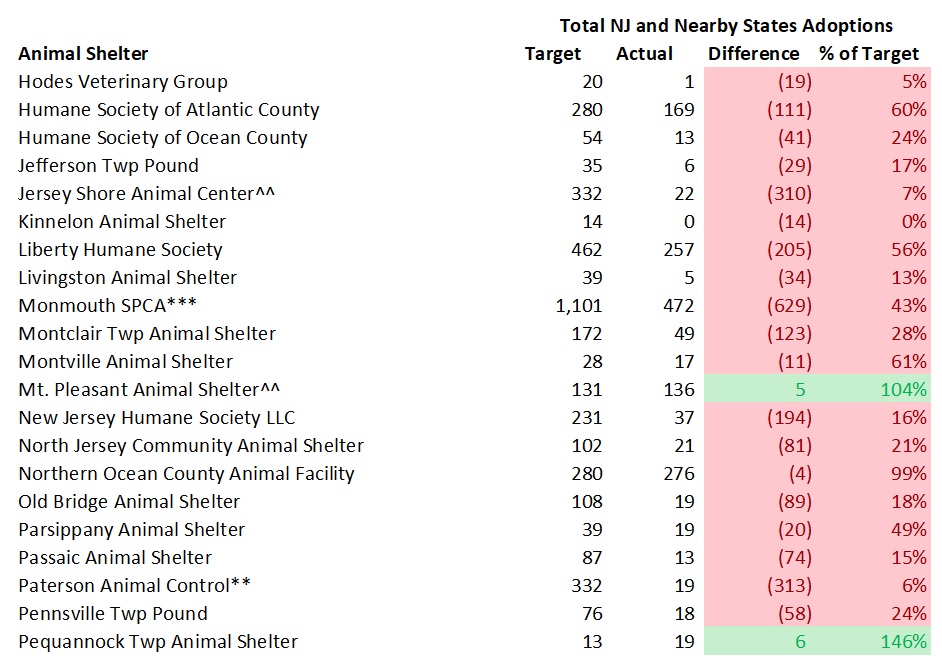
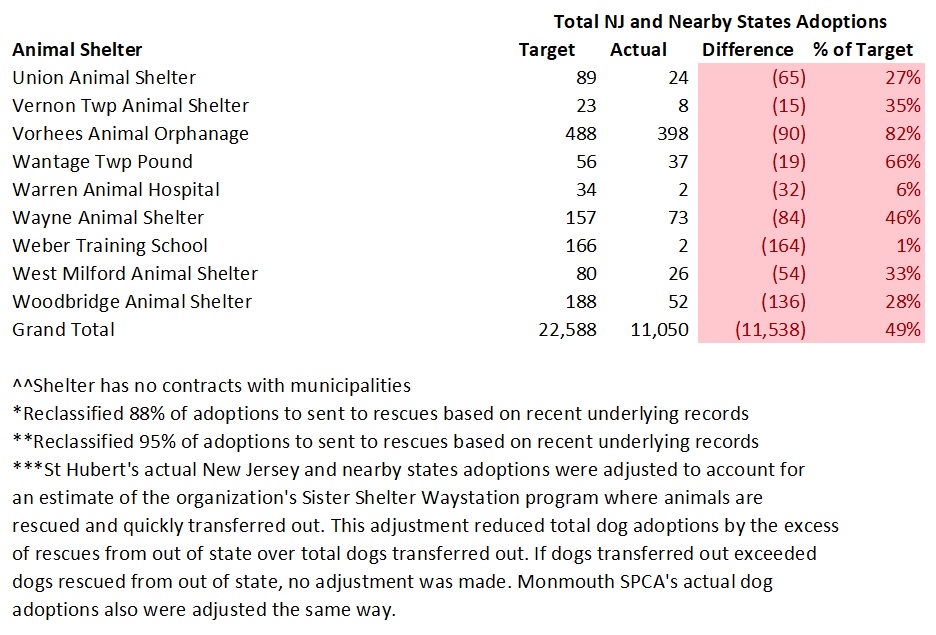
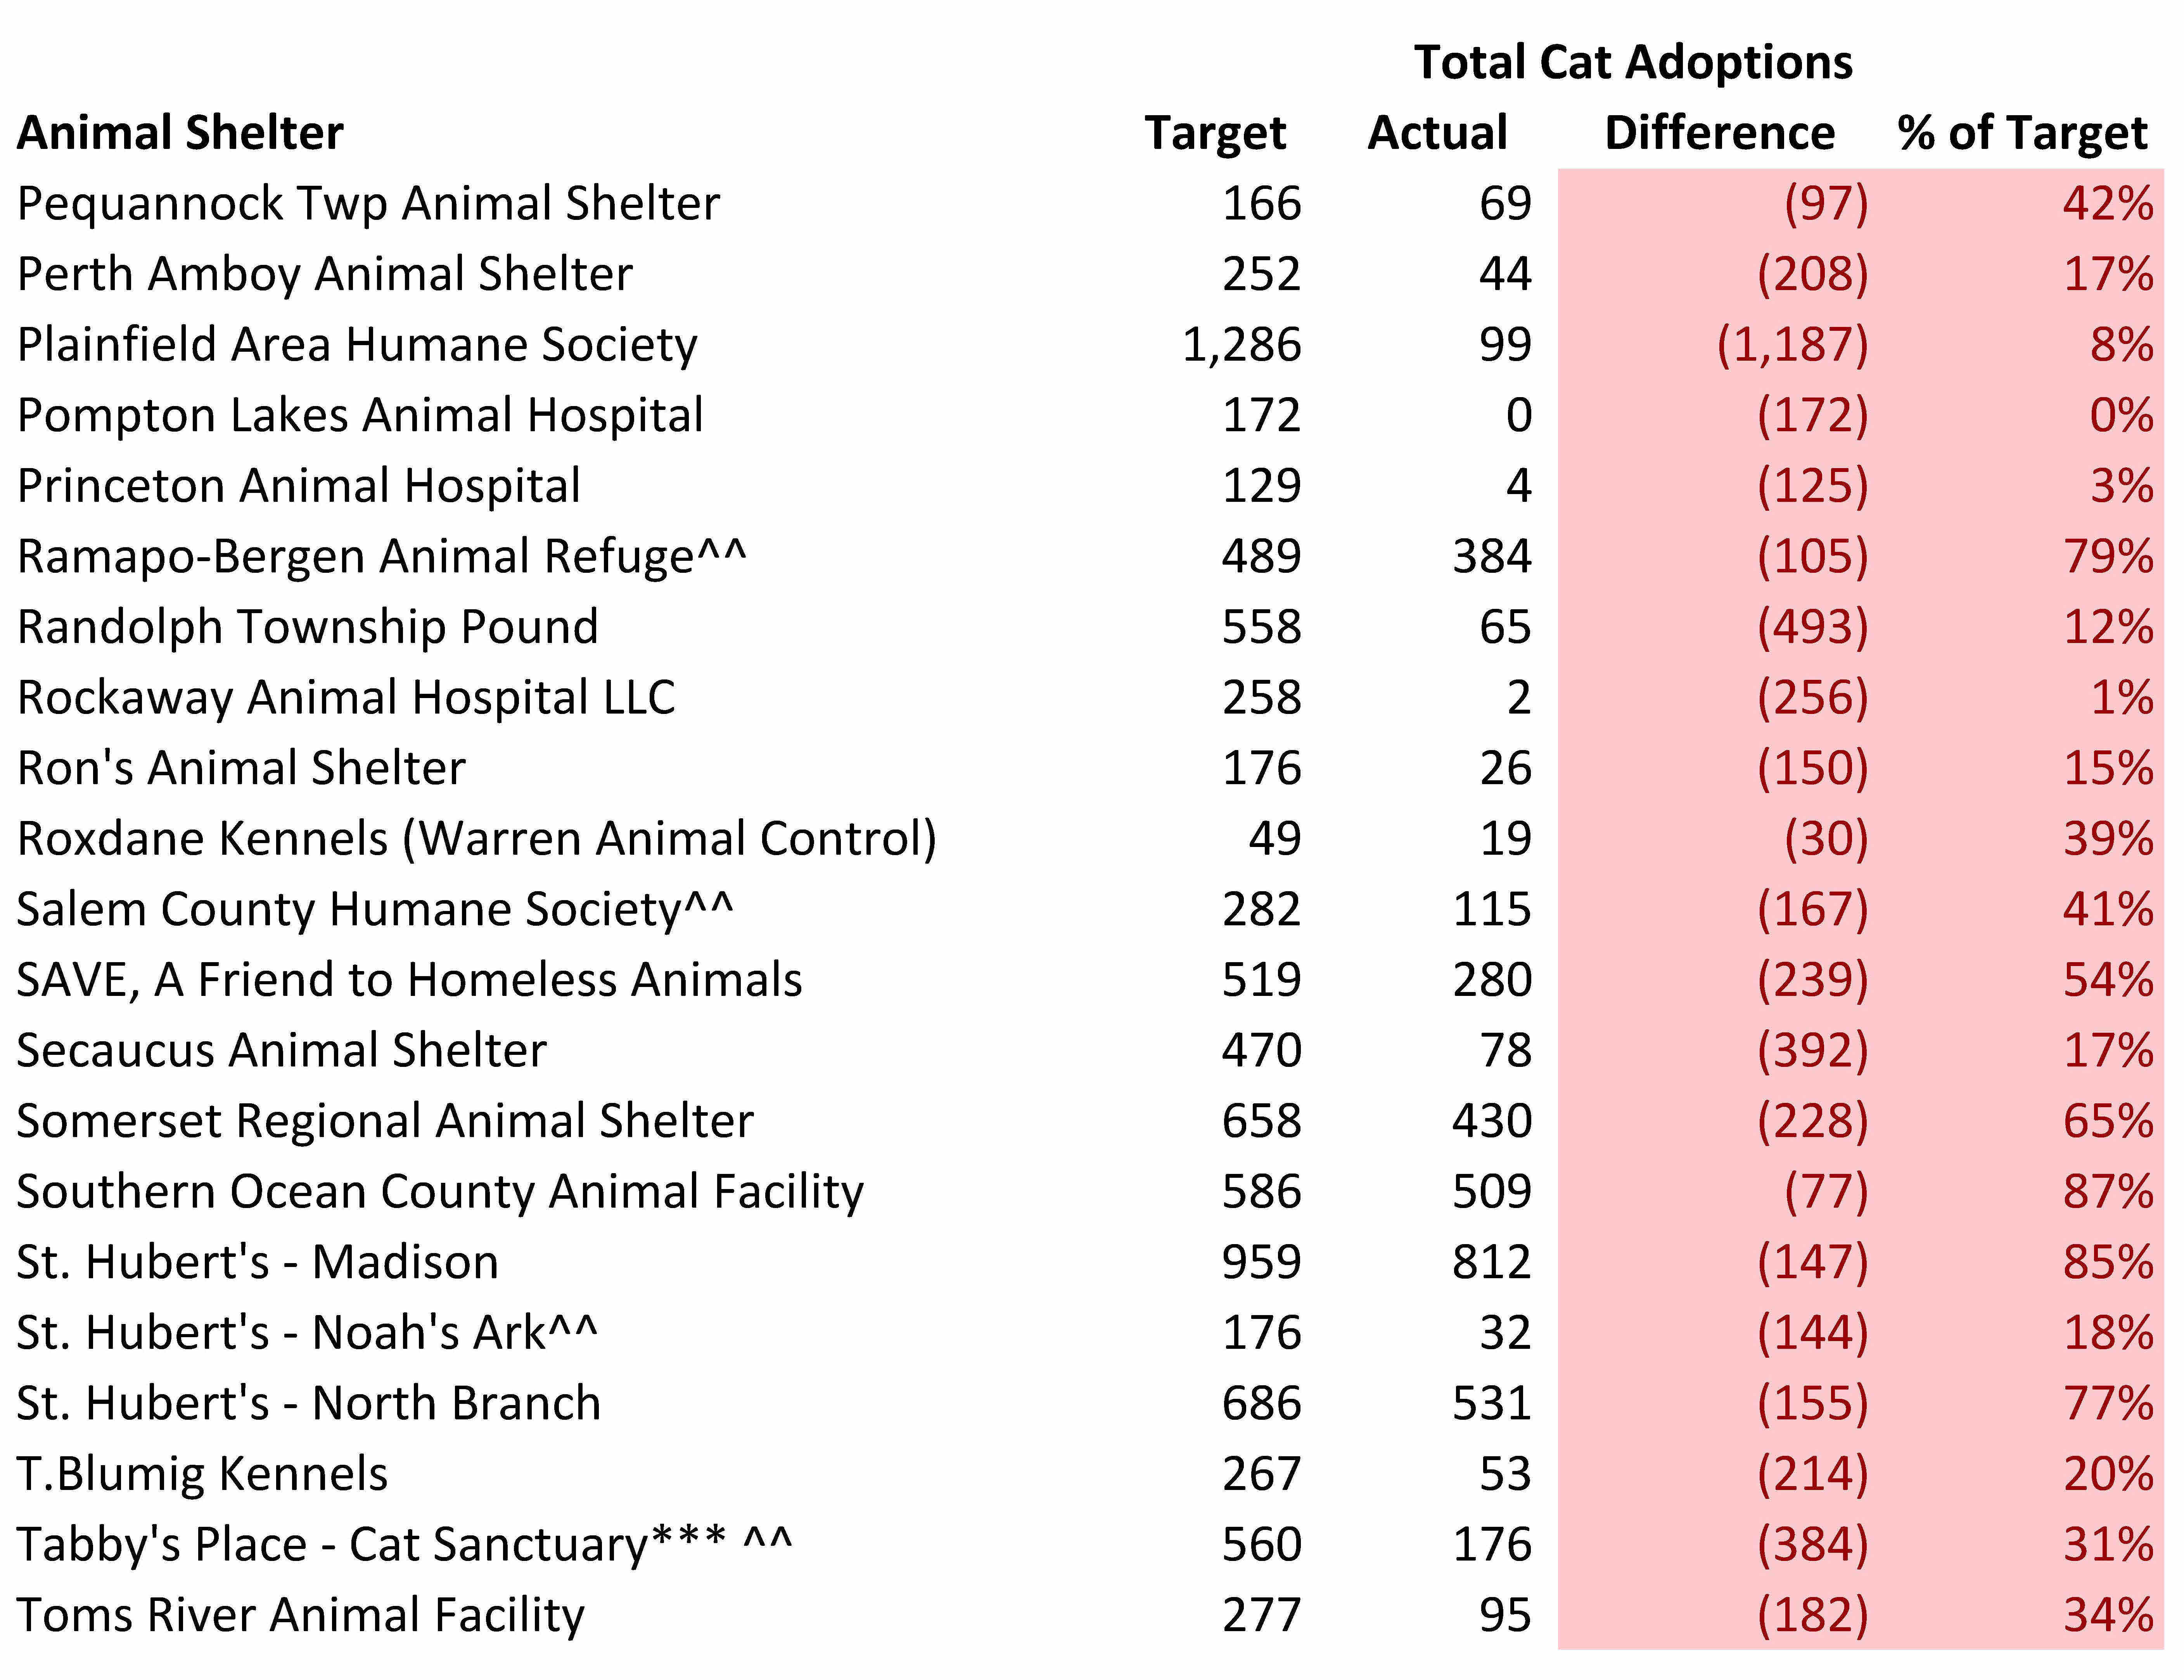
The tables below compare the number of cats from New Jersey and nearby states each animal shelter should adopt out with the estimated number of cats actually adopted out.
Rescue oriented organizations may look better than they actually are. Many rescue oriented shelters likely pull much easier to adopt cats than the bulk of cats needing to get rescued from local facilities.
Few organizations reached or exceeded their adoption targets. Specifically, only 7 out of 97 shelters met the cat adoption goals computed by the Life Saving Model. Thus, the overwhelming number of New Jersey animal shelters need to step up their adoption efforts.
Several rescue oriented shelters exceeded their adoption targets. Animal Welfare Association exceeded its cat adoption target by the most of any shelter in terms of total adoptions. Animal Welfare Association has reasonable normal adoption fees of $95 for kittens and $65 for adult cats, but runs reduced and no adoption fee promotions as well. Animal Welfare Association also waives fees for certain cats who may take longer to adopt out, such as cats who are older or have behavioral or health issues. Furthermore, the shelter’s “Best Friends” program allows people who adopt a cat to pay just $25 for a second cat who is 1 year or older. Animal Welfare Association also waives cat adoption fees for active military personnel and veterans in its Pets for Vets program. The shelter also waives adoption fees for senior citizens adopting certain senior pets. Additionally, Animal Welfare Association uses an open adoption process focused on properly matching animals and people rather than an overly judgmental procedure based on black and white rules. To aid its open adoptions process, Animal Welfare Association uses the ASPCA’s Feline-ality program. Animal Welfare Association’s adoption rate increased by 20% and its cat length of stay decreased by 23 days after the shelter implemented the Feline-ality program. Finally, Animal Welfare Association installed perches in their cat enclosures to provide cats more vertical space which keeps the cats happier and more adoptable. Beacon Animal Rescue also exceeded its adoption target and charges a reasonable $75 fee for all cats. Other rescue oriented shelters exceeding their adoption targets were Mt. Pleasant Animal Shelter and Ramapo-Bergen Animal Refuge. Thus, several rescue oriented shelters exceeded their cat adoption targets and Animal Welfare Association used a variety of innovative strategies to adopt out many cats.
Several animal control shelters also exceeded their adoption targets. Despite not being open many hours, West Milford Animal Shelter exceeded its adoption goal. This shelter charges a very reasonable $35 fee for all cats and runs a creative Facebook page called “The Real Cats at West Milford Animal Shelter.” Byram Township Animal Shelter also exceeded its adoption goal. While the shelter has very limited adoption hours, the shelter’s volunteer organization partner also holds frequent adoption days at high traffic retail stores. The shelter’s volunteer organization charges reasonable adoption fees of $65 and $85 for cats and kittens, but also sometimes offers discounts when two or more cats are adopted together. Also, adoption fees for senior and special needs cats are only $35. Vorhees Animal Orphanage also exceeded its adoption goal. This shelter’s normal adoption fees are quite reasonable. For example, senior cats and special needs cats are $25 and adult cats are $75. The shelter also is open 7 days a week, including weekday evenings and weekends (except one Wednesday a month and certain holidays), which makes it convenient for working people to adopt animals. Additionally, Vorhees Animal Orphanage adopts cats out at one PetSmart store and three PetValu locations. Thus, several animal control shelters exceeded or came close to achieving their cat adoption goals and therefore prove these adoption targets are achievable.
Rescues should focus on pulling animals from Vorhees Animal Orphanage. This shelter’s cat kill rate is too high and its need for rescues greatly exceeds the amount of animals actually pulled from this organization. While some of these cats may be feral and therefore not adoptable, many other cats surely could be rescued from this shelter. Given this shelter is adopting cats out at a good rate, rescues and other other shelters should help this facility out by pulling more cats from Vorhees Animal Orphanage.
Some municipal animal control shelters may be doing a better job with cats than the numbers below indicate. In some cases, municipalities may frown on government run shelters using taxpayer funds to rescue cats from elsewhere. My suggestion to these shelters is to find ways to use more of your facility’s capacity to expand your lifesaving work to other areas. For example, these shelters should consider taking in animals from other shelters for a fee or even contracting with other municipalities.
Associated Humane Societies performance is particularly disappointing. Specifically, Associated Humane Societies has the physical capacity to significantly reduce the killing of healthy and treatable cats. Associated Humane Societies adoption shortfall of 6,971 cats is 56% of the 12,370 cats unnecessarily losing their lives in New Jersey animal shelters. Associated Humane Societies has the funding to reach these adoption targets as the organization took in nearly $9 million of revenue last year. This works out to $462 of revenue per dog and cat I project the shelter should take in per my Life Saving Model. As a comparison, KC Pet Project, which is a no kill open admission shelter in Kansas City, Missouri, took in only $318 of revenue per dog and cat. Activists wanting to increase life saving in New Jersey should focus on changing Associated Humane Societies’ policies given the lifesaving potential of this organization.
Bergen County Animal Shelter’s adoption shortfall of 1,768 cats is quite disappointing. Bergen County is among the top 1% of the nation’s wealthiest counties and the shelter received $470 of funding per dog and cat I project the shelter should take in based on direct support from Bergen County and the revenue from the local charity that helps support the shelter.
Shelters Fail to Use Excess Space to Save Cats
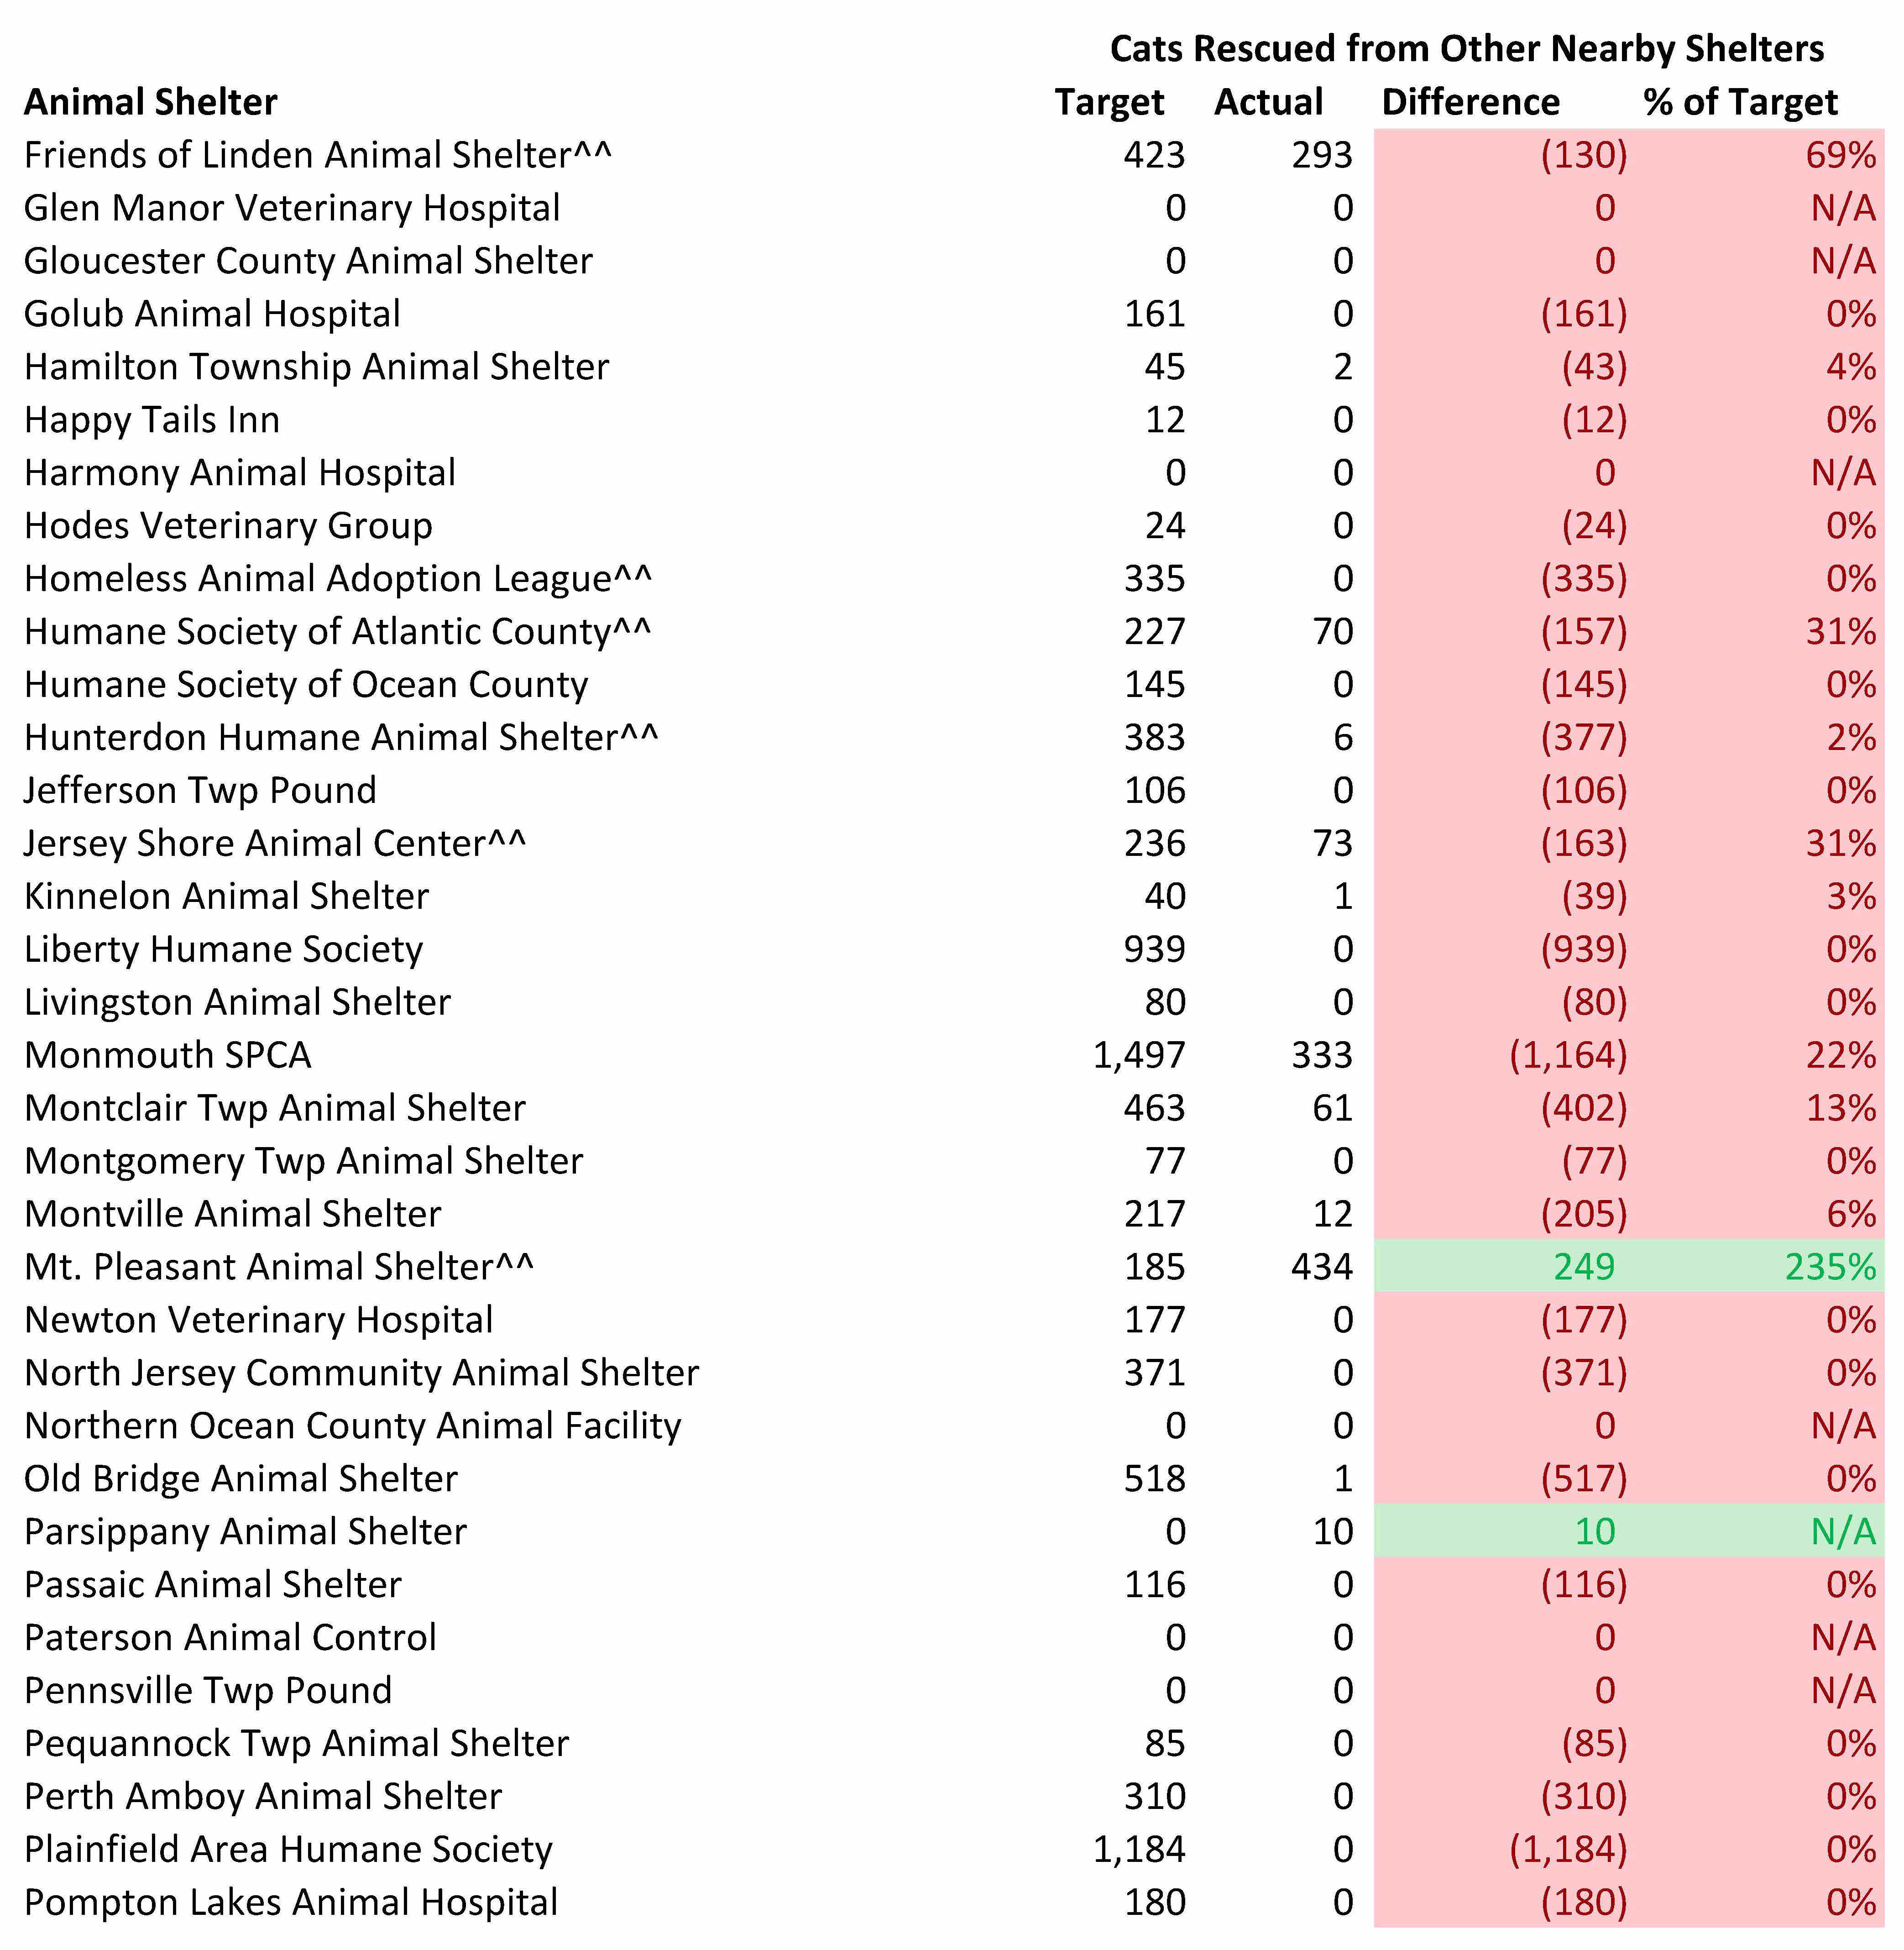
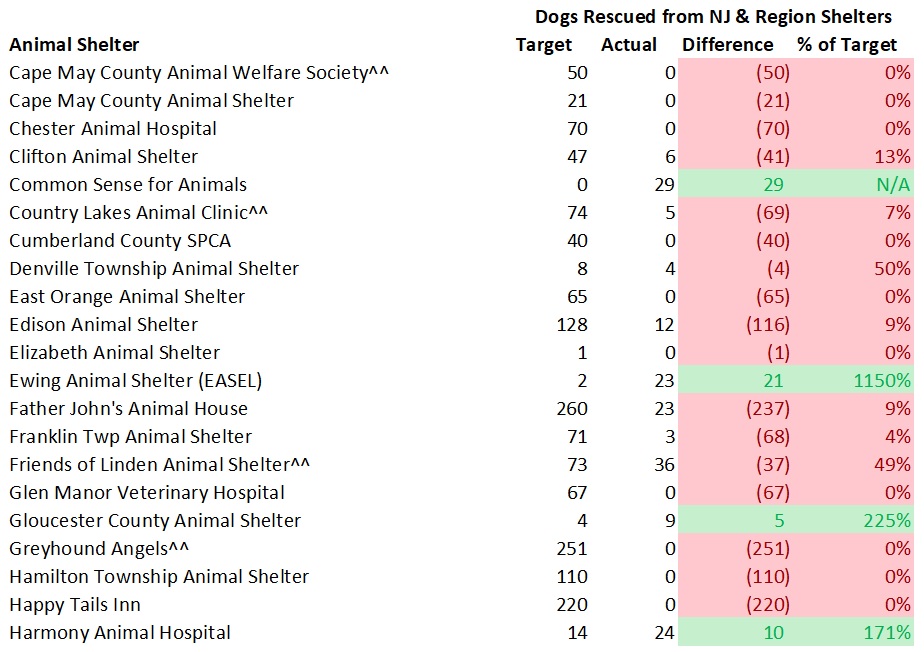
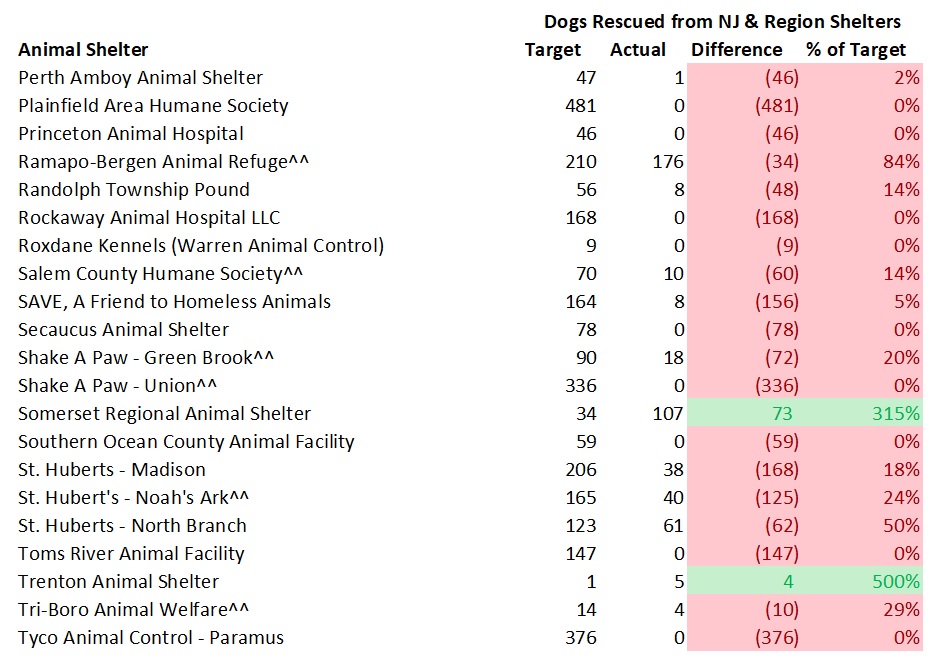
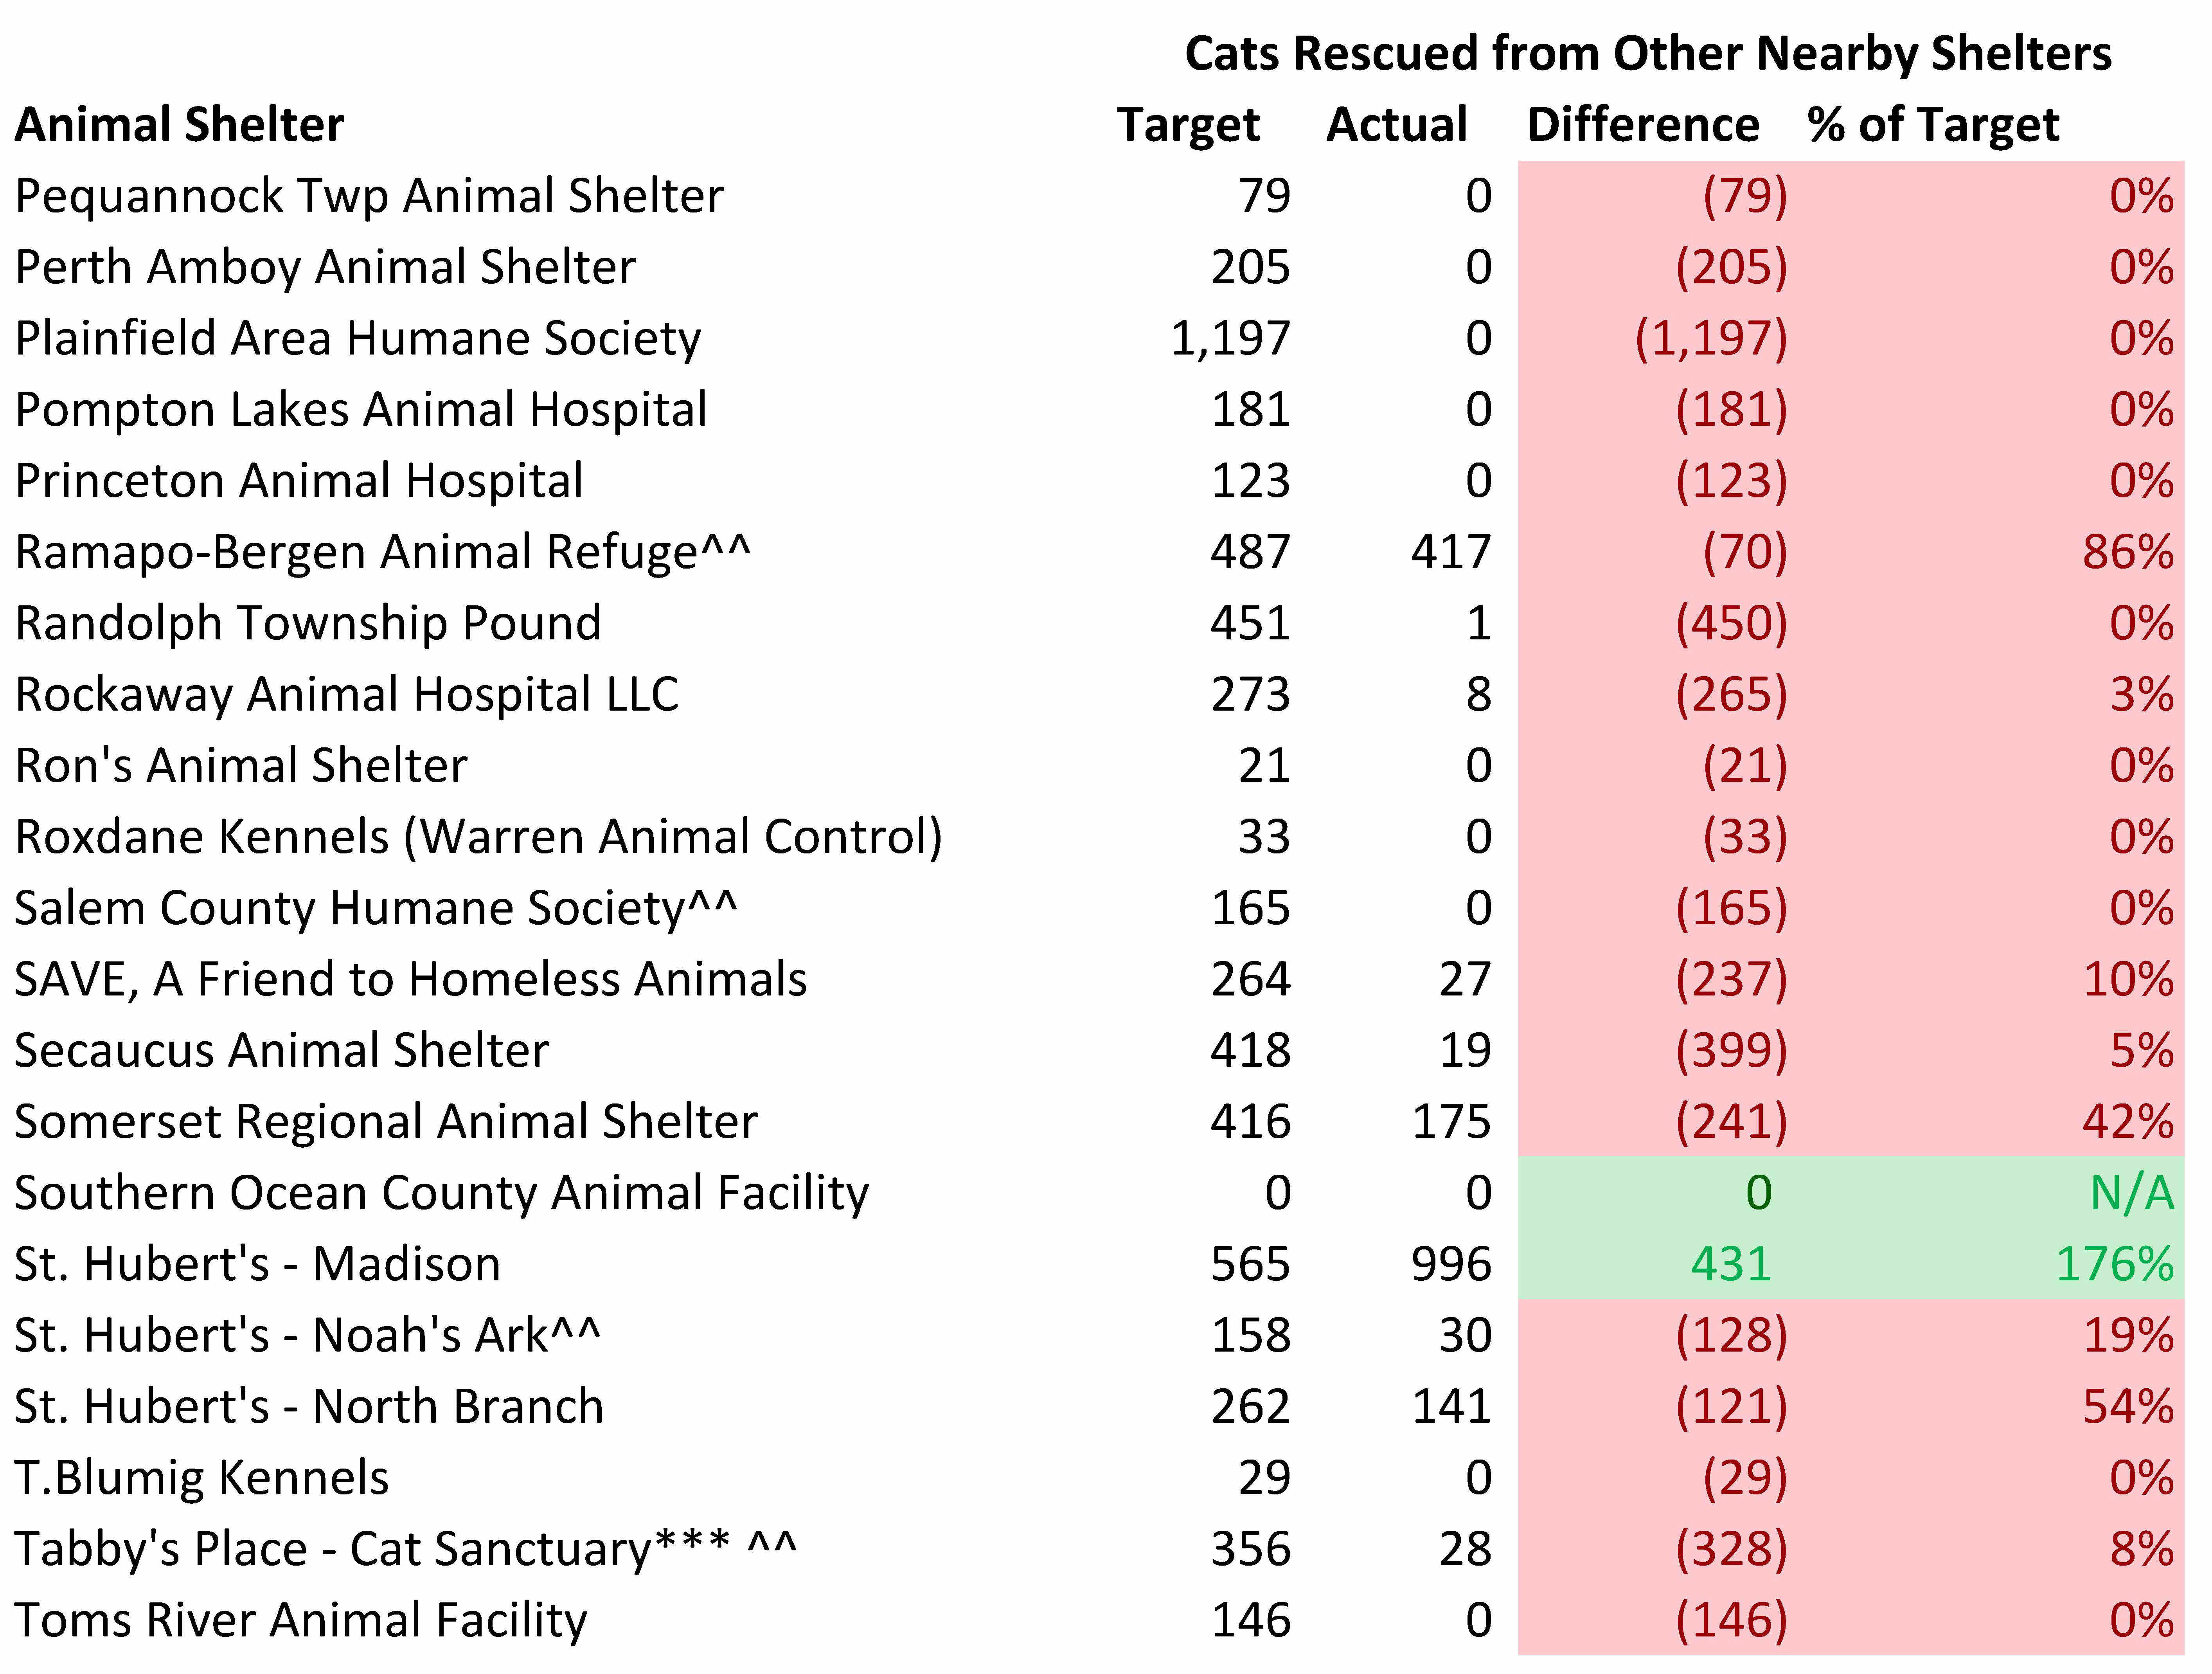
To further examine New Jersey animal shelters’ performance in saving homeless cats, I compared the targeted number of cats each shelter should pull from nearby shelters to the number actually rescued from local facilities. I assume all cats rescued from out of state came from nearby areas, such as Philadelphia and New York City. While some of the out of state rescued cats may have comes from far away areas, I believe this is a small number and does not significantly impact the results.
Virtually all New Jersey animal shelters are failing to rescue the number of cats they should. 82 of the 97 shelters should rescue some cats from other local shelters. In fact, 48 of the 82 shelters with targeted excess capacity failed to rescue even a single cat from other animal shelters. Only 5 shelters with significant amounts of space to rescue cats from nearby shelters met or exceeded their cat rescue target. Thus, nearly all New Jersey animal shelters with targeted excess capacity are failing to do their share in ending the killing of healthy and treatable cats.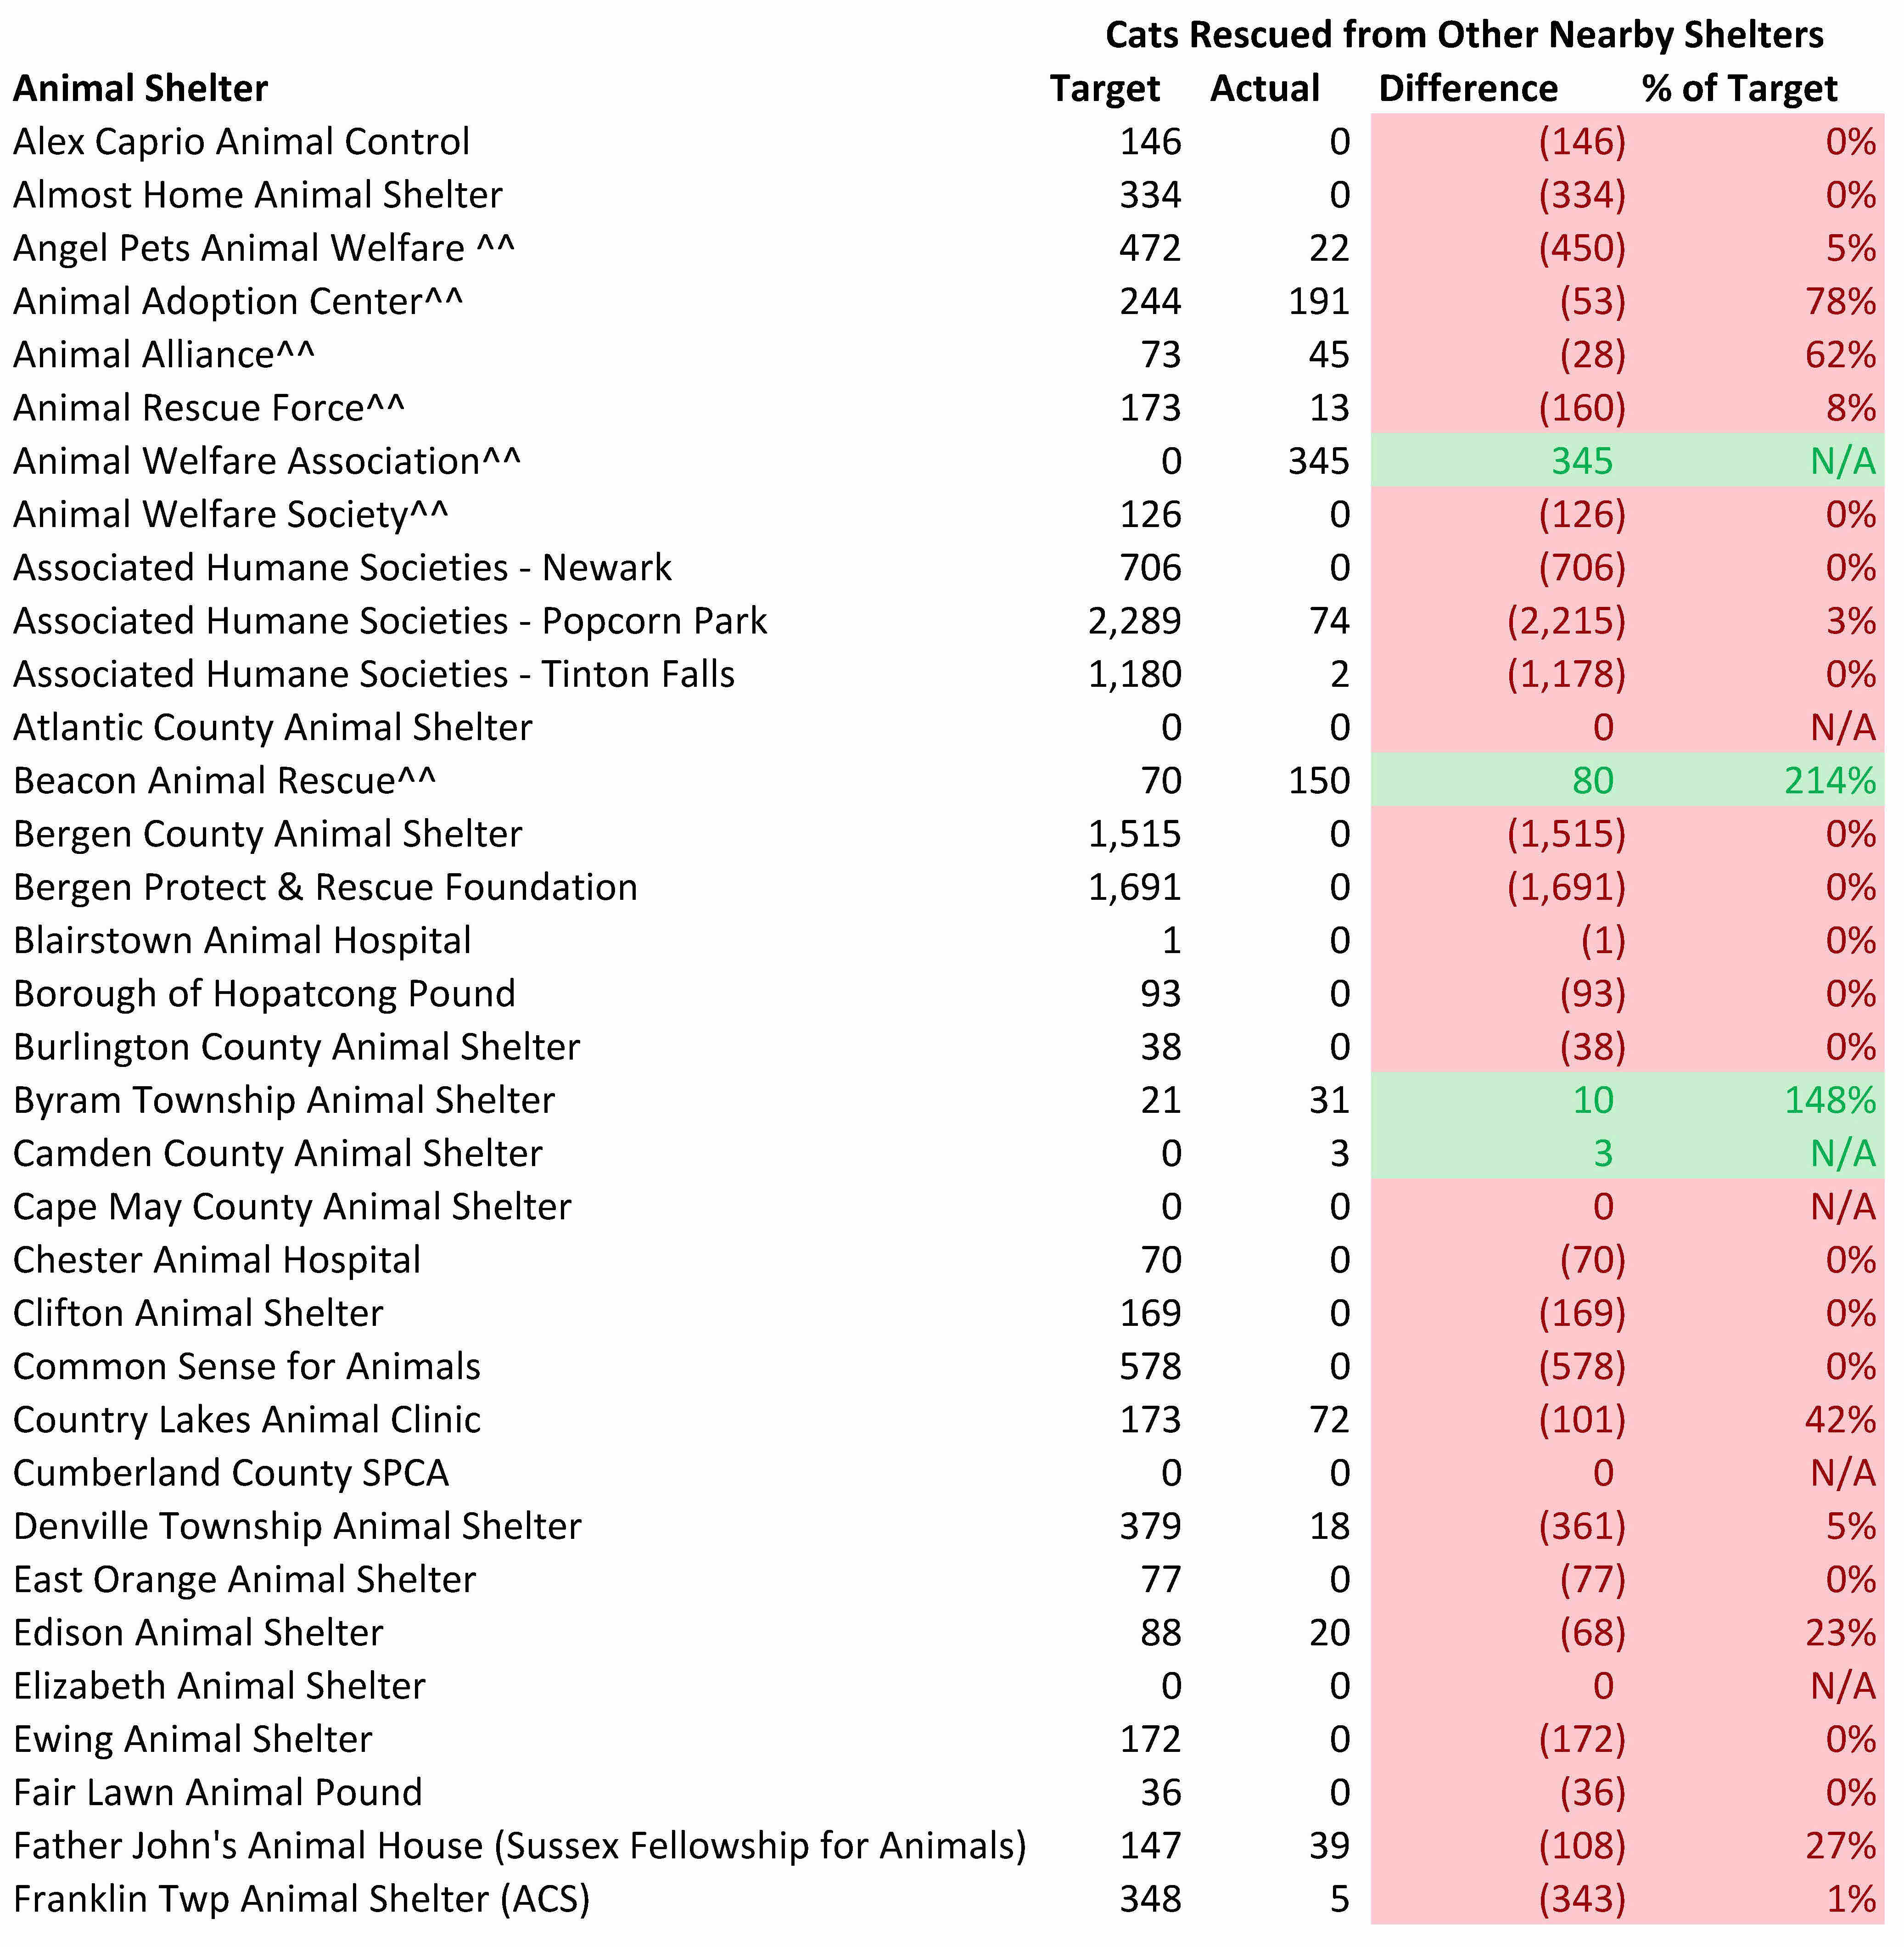

TNR Is Essential, But Should Not Be An Excuse to Do Nothing
TNR must be instituted to end the killing of healthy and treatable cats. While many shelters may potentially come close to or reach a 90% live release rate, feral cats may still be killed. Simply put, New Jersey cannot become a no kill state without TNR becoming the law of the land. The Companion Animal Protection Act (“CAPA”) prevents shelters and municipalities from taking actions to hinder TNR, such as banning feral cat colony caretakers from feeding cats and lending traps out to the public for catching and killing feral cats. Even without an explicit law allowing TNR, the New Jersey Department of Health should encourage municipalities to implement TNR by changing its neutral stance on TNR to an endorsement of the practice. Furthermore, shelters, especially private facilities with animal control contracts, should refuse to take feral cats from places where TNR is prohibited and the shelter cannot place these feral cats as barn cats or send these animals to reputable sanctuaries per recommendations of many national animal welfare groups.
Shelters should not use anti-feral cat laws as an excuse for failing to institute innovative programs. Too many times shelters blame anti-feral cat ordinances for their outrageously high cat kill rates. However, my analysis proves cats are not dying in New Jersey’s shelter system due to too many cats coming into the state’s shelter system. While TNR certainly would reduce cat intake and make saving lives easier, our state’s shelter system has more than enough space to handle the number of cats that come in. Shelters need to implement key programs, such as foster care, high volume adoptions, and vaccination upon intake. Additionally, shelters need to stay open weeknights and weekends when working people can adopt. Similarly, shelters should use innovative marketing, customer friendly open adoption processes, multiple off-site adoption locations, and frequent discounted adoption promotions to quickly move cats into good homes. Furthermore, implementing a program where fearful and aggressive cats are touched gently and spoken to softly likely will significantly reduce the number of cats labeled as “feral” and increase adoptions. Thus, anti-TNR ordinances do not prevent shelters from implementing other life saving policies.
Shelters Do Not Need to Leave Friendly Cats on the Street
Shelters do not need to neuter and release friendly cats or refuse to take these cats in given enough capacity exists within the New Jersey shelter system. In 2013, a group of animal welfare leaders, which included the Humane Society of the United States (“HSUS”) and the ASPCA, prepared a white paper stating a shelter should not impound cats if those cats or other cats in the shelter would subsequently be killed. The evidence supporting this policy, such as cats being more likely to find homes on the street than in traditional shelters, is quite strong. However, my analysis shows the entire New Jersey shelter system does have enough space to handle friendly cats. While certain shelters are space constrained and could benefit from refusing to admit healthy and friendly cats, other shelters in the state have more than enough capacity to step in and find these cats homes. Thus, New Jersey shelters do not need to resort to refusing to take in friendly cats or neutering and releasing friendly cats to avoid killing cats provided these shelters work together and follow best practices.
Kitten Nurseries and Ringworm Wards Key to Saving Vulnerable Cats
Orphaned kittens are typically automatically killed in traditional animal shelters due to the time commitment required to care for these animals. Unweaned kittens require bottle feeding as frequently as every 1-2 hours. As a result, kittens not placed into foster care are typically killed in most animal shelters.
Kitten nurseries or bottle baby wards radically increase the save rate for orphaned kittens still requiring milk. While foster care and rescue programs can save unweaned kittens, kitten nurseries are more efficient and make the job easier. Austin Animal Services, which is the animal control shelter in Austin, Texas, killed 1,200 plus kittens a year before Austin Pets Alive created a bottle baby program. Volunteers work in two hour shifts to feed and care for the kittens. Additionally, nursing mothers are pulled from the city shelter and used to help nurse highly vulnerable young kittens who are orphaned. Kittens are put on antibiotics and treated for fleas and worms immediately to help prevent complications from transitioning from breast milk to formula. Austin Pets Alive has pulled as many as 1,600 kittens a year from the city shelter and saved nearly 90% of these kittens in recent years through this bottle baby program. Best Friends created a kitten nursery in South Salt Lake City, Utah and saved 1,400 kittens from Salt Lake City area shelters. Thus, kitten nursery programs can save young and vulnerable kittens.
Ringworm ward programs easily save cats with this skin fungus. In traditional animal shelters, cats with ringworm are killed due to the risk that other animals and humans will catch this skin fungus. Austin Pets Alive created a specific “Ringworm Ward” program to treat and adopt out these cats. These cats are treated both topically and orally in an isolated area. After the cats are no longer contagious, the cats are sent to foster homes to complete their treatment and regrow their hair. Austin Pets Alive uses steeply discounted adoption fees of only $15 along with catchy slogans like “Adopt a Fun Guy (Fungi)”, “Lord of the Ringworm”, and “Hairy(less) Potter” to quickly place these cats and open up space for additional cats with ringworm. 100% of cats entering this program are saved. Thus, shelters can save cats with ringworm.
Regional kitten nurseries and ringworm wards are the practical solution to saving these vulnerable cats. Given the New Jersey shelter system has significant excess capacity to care for cats, certain shelters should convert some of that excess space for use as kitten nurseries and ringworm wards. Creating regional centers to care for unweaned kittens and cats with ringworm would allow the programs to run at a large enough scale to work efficiently. Shelters, such as Associated Humane Societies-Popcorn Park, Monmouth SPCA, and St. Hubert’s-Madison appear to have the space and financial resources to implement these programs. Furthermore, the Animal Welfare Federation of New Jersey (“AWFNJ”) should take the steps needed to create kitten nurseries and ringworm wards in regional centers throughout the state. Surely, the AWFNJ has the connections to convince key decision makers to implement these programs and obtain any necessary funding. Thus, New Jersey shelter leaders must immediately take the steps needed to save the large numbers of treatable kittens and cats with ringworm in our state’s shelters.
Results Require New Jersey Animal Shelters to Take Action
The findings from this analysis mandate New Jersey animal shelters change their ways. While TNR remains a significant issue, most shelters are clearly not taking steps to save large numbers of healthy and treatable cats. Many shelters are not vaccinating upon intake, charging excessive adoption fees, making it too difficult to adopt, not being open when working people can go to shelters, leaving cat enclosures empty, not trying to rehabilitate fearful and aggressive cats and not using barn cat, foster care, kitten nursery and ringworm ward programs. Simply put, too many shelters are not doing what it takes to save lives. With more than one in three cats entering New Jersey’s shelters dying, going missing or being unaccounted for, our state’s shelters are failing their cats.
New Jersey shelters have a cat crisis and it is time for the killing to stop. We have the information and even the blueprints from numerous communities which stopped killing and started saving their cats. It is time the excuses end and action begins. The public is fed up with the killing and demands shelters save their animals. Our state’s animal welfare organizations need to get on board the lifesaving wagon or risk getting run over by it. Which will they choose?
Appendix Life Saving Model Assumptions
The Life Saving Model utilizes the following basic animal shelter population equations to calculate the targeted cat outcomes for each facility:
Daily capacity or population = Daily animal intake x average length of stay
Average length of stay = Daily capacity or population/daily intake
Each shelter’s community cat intake (i.e. owner surrenders, strays, cruelty cases), number of cats returned to owners, and maximum cat capacity were taken from its 2015 “Shelter/Pound Annual Report” submitted to the New Jersey Department of Health. You can see the full data set I compiled from these reports here.
- Community cat intake and cats returned to owners were initially estimated for each month by dividing the annual figures by 12. In order to take into account the extra space in low intake months and reduced space in high intake months, we multiply that number by each month’s percentage of the average month. For example, assume 240 cats were taken in during the year and the average month equals 20 cats (240/12). In July, the cat intake is 120% higher than the average month and we therefore multiply 20 cats by 1.2 to equal 24 cats. If 120 cats were returned to owners during the year, the estimated number of cats returned to owners in July would equal 12 cats (120/12 = 10; 10*1.2). The monthly intake percentages were based off the average of the 2015 cat intake data on New York Animal Care & Control’s and ACCT Philly’s web sites.
- The estimated number of community cats returned to owners each month are then assumed to stay 5 days on average at shelters based on data from other shelters across the country.
- The number of community cats euthanized (including animals who died or are missing) is set to equal 8% of intake. 8% is a reasonable standard euthanasia rate to use given other open admission animal shelters, such as Austin Animal Services, equal or exceed this target and New Jersey’s much lower per capita cat intake makes it easier to save lives. The average length of stay for euthanized cats is assumed to equal 8 days. I assume these cats have severe and untreatable health issues and are euthanized immediately after their required 7 day hold period.
- The average length of stay used for adopted community cats was 42 days. This estimate was roughly halfway between the average cat length of stay figures for a number of no kill animal control shelters. For example, the average length of stay for cats in recent years was 14.2 days at Texas’s Williamson County Animal Shelter, less than 18 days at Nevada Humane Society, 19 days (25 days for cats and 8 days for kittens) at Colorado’s Longmont Humane Society, 33 days (32 days for cats and 34 days for kittens) at New Hampshire SPCA, 35 days at Montana’s Flathead County Animal Shelter, 40 days at Lynchburg Humane Society, and 61 days for adopted cats only at New York’s Tompkins County SPCA. While the average length of stay of adopted cats at these shelters other than Tompkins County SPCA may have been slightly higher since this data is for all cats and not just those adopted, the difference is not likely significant given adoptions represent most of the outcomes at these shelters. Unfortunately, I was not able to break down the adoption length of stay figures by age or breed for New Jersey’s shelters like I did in my analysis on dogs due to a lack of detailed cat intake data at New Jersey animal shelters. Upon reviewing cats up for adoption at several New Jersey animal control shelters and a few of the high performing facilities above, I did not see any significant differences in types of cats taken in. In the future, I hope to refine this analysis further.
- The average length of stay used for community cats adopted out from rescue oriented shelters was 30 days. Rescue oriented animal shelters typically carefully select animals taken into their shelters. Based on the San Francisco’s SPCA’s 21 day and Tony La Russa’s Animal Rescue Foundation’s 23 day average length of stay figures reported a number of years ago, I used a shorter length of stay for community cats adopted from New Jersey animal shelters without animal control contracts. I chose 30 days as a conservative estimate.
- Cats transferred to rescue or other facilities are assumed to stay at shelters 8 days on average based on the assumption strays can’t be released until the 7 day hold period elapses.
- Community cats not returned to owners or euthanized are initially assumed as adopted for each month outside of kitten season (i.e. November-March). However, if the calculated length of stay exceeds the shelter’s required length of stay, cats are moved from adoption (i.e. with a longer length of stay) to rescue (i.e. shorter length of stay) until the calculated length of stay each month approximately equals the required length of stay.
- During kitten season (April-October), animal control shelters are assumed to send a certain percentage of cats to rescues even if they have excess space. Due to the large numbers of kittens coming into shelters during these months, I assume shelters will not be able to place all of them into foster homes or a kitten nursery at this time. As a result, I assume animal control shelters will send 10% of their annual community cat intake to rescues based on the shelters’ estimated relative cat intake each month. For example, if a shelter took 100 cats in during the year and August made up 50% of the total cat intake from April to November, 5 cats would go to rescue in August (i.e. 100*10% = 10 cats; 10*50% = 5 cats). I used 10% based off the rescue percentage of cat intake in 2014 at Kansas City’s KC Pet Project. KC Pet Project is a no kill open admission shelter with an inadequate facility and is a good comparison for some of our state’s run down shelters. Shelters requiring rescue support due to space constraints are assumed to send these additional cats to rescues during kitten season.
- Shelters are not expected to use the excess space created by fosters taking kittens to rescue and adopt out additional cats. This is based on the assumption that the kittens will return to shelters once old enough to safely stay at the facilities.
- Required length of stay = Shelter’s reported capacity/adjusted daily intake for the month. Adjusted daily intake for month = Adjusted monthly intake per first bullet above/the number of days in the month.
- Shelters with excess capacity are assumed to use the extra space to rescue and adopt out cats from other New Jersey animal shelters. Given some of these cats will be young and highly vulnerable kittens, I assume 5% of these rescues will be euthanized for humane reasons. I used 5% based off Austin Pets Alive’s and Austin Humane Society’s weighted average cat euthanasia rate in 2014. These two shelters pull many cats from Austin Animal Services, which is the city’s animal control shelter, and their cat euthanasia rate is a reasonable proxy for the percentage of hopelessly suffering cats rescued from animal control shelters. To the extent all healthy and treatable New Jersey animal shelter cats are saved, I assume additional cats are pulled from nearby states. The average length of stay for rescued and adopted cats is the same as the cats taken in by animal control shelters (i.e. 42 days). Similarly, I used 8 days as the average length of stay for rescued and euthanized cats from other shelters.
- Each month’s targeted outcomes are added to determine how many cats New Jersey animal shelters should adopt out, send to rescue and rescue from other nearby animal shelters.
- Space constrained shelters were assumed to adopt out their easiest to adopt animals first until they run out of space. To estimate the average adoption length of stay, I used cat adoption length of stay data from Perth Amboy Animal Shelter from 2014 and the first half of 2015. I broke the adoption length of stay data into 5 groups that each made up 20% of the data. The average adoption length of stay for each of these 5 groups was calculated. The average adoption length of stay of each group was divided by the average length of stay for all of the adopted cats in the Perth Amboy Animal Shelter data set. Those percentages were then multiplied by the average cat adoption length of stay determined in the model above and used to determine the adoption lengths of stay used for space-constrained shelters.
- The targeted number of cats adopted were capped at 8 cats per 1,000 people in each county. If the model yielded a higher result than this cap, the targeted numbers of cats adopted were equal to this cap. For shelters in these counties (except Passaic County), I calculated the cap at the county level and then reduced the number of cats adopted for the county to equal the cap. I excluded West Milford from Passaic County due the town’s large distance from the population centers in the rest of the county. Each shelter’s percentage of total targeted adoptions in the county from the unmodified model were applied to the the total reduction in the number of cats adopted in the county to yield the targeted numbers of cats adopted in the modified model. Rescued and euthanized cats for these shelters were reduced based on the modified model’s assumption that shelters adopted out and euthanized 95% and 5% of rescued cats.


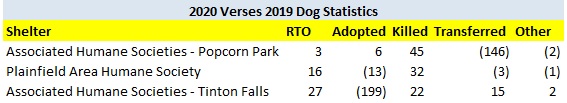


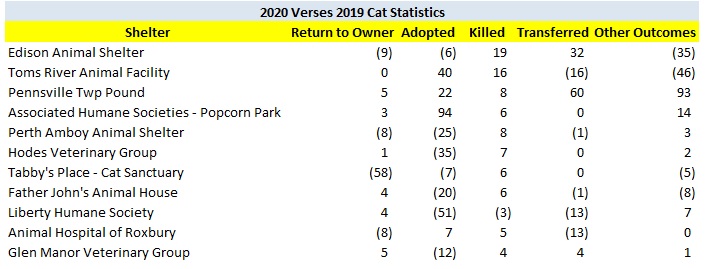
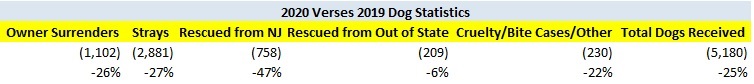


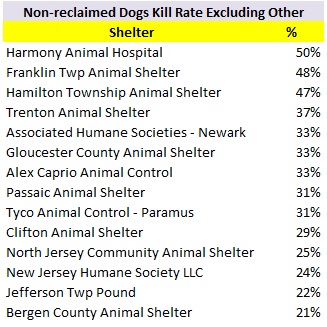


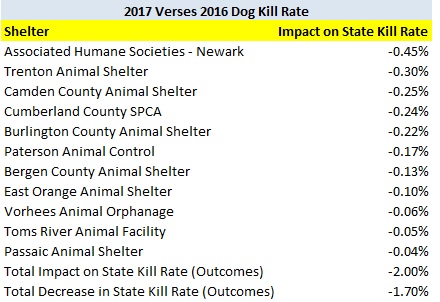


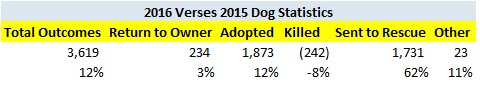
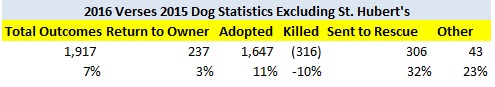 The following shelters contributed most to the decrease in the statewide dog kill rate.