In a blog from earlier this year, I disclosed New Jersey’s depressing animal shelter statistics. This blog explains why so many dogs are losing their lives in the state’s animal shelters and whether these facilities can end the killing.
Successful organizations set measurable goals and regularly monitor their performance. Examples include financial budgets, customer and employee satisfaction surveys, and product reliability metrics. Unfortunately, many animal shelters for far too long have failed to set lifesaving goals and standards. Municipalities, donors and volunteers need to know where their resources will be best utilized. Time and money are scarce resources and people should allocate these assets to organizations who will best utilize them. As a result, animal shelters need to set goals and hold their leadership and staff accountable for achieving these objectives.
Model Assesses New Jersey Animal Shelters’ Life Saving Performance
In order to assess how good of a job New Jersey animal shelters are doing, I’ve developed an analysis I call the “Life Saving Model.” While shelter performance is dependent on many variables, such as finances, facility design, local laws, etc., the most critical factor impacting potential life saving is animal holding capacity. Without having enough physical space and foster homes, a shelter might not have enough time to find loving homes for its animals. Shelters can overcome financial limitations through creative fundraising or recruiting more volunteers. Similarly, organizations can save their dogs despite having run down facilities if these groups enthusiastically implement policies to get animals into loving homes quickly. As a result, my analysis focuses on making the best use of space to save the maximum number of New Jersey and nearby states dogs.
The Life Saving Model measures the number of local animals a shelter should adopt out, rescue from other facilities, send to rescues or other shelters, and euthanize. The targeted outcomes take into account each facility’s physical capacity plus the amount of foster homes it should use and the number and types of dogs the organization receives from its community (i.e. strays, owner surrenders, cruelty/bite cases). I assume a target euthanasia rate, take the number of dogs actually returned to owners and then estimate how many community dogs a shelter should adopt out. To the extent space runs out, I then calculate how many dogs the shelter must send to rescues. If the shelter has excess space after properly serving its local community, the facility uses that room to rescue and adopt out dogs from nearby areas. The targeted results calculated from this model are compared to the actual or estimated actual results from each shelter below.
The model expands facility capacity to include the number of foster homes shelters should use. Based on a target American Pets Alive and other progressive shelter directors communicated at the 2019 American Pets Alive Conference, shelters should have 3% of their annual dog intake in foster homes at any one time. These estimates are based on what several no kill animal control shelters already accomplish. Given fostering increases capacity and provides more humane care to animals, it is critical shelters have large scale foster programs. Therefore, I added 3% of each shelter’s annual dog intake to the shelter’s physical capacity.
For shelters with animal control contracts, I place 10% of all dogs that are not reclaimed by owners into the targeted sent to rescue category. Austin Pets Alive used data from Austin Animal Center, which is the local municipal shelter, to determine large dogs with behavioral challenges are part of the last 10% of animals losing their lives. While shelters can save most of these dogs through behavioral rehabilitation and/or foster programs, I decided to put an estimate of these dogs into the sent to rescue category since that is another good outcome for these dogs.
This year I modified the model to have shelters euthanize 1% of the dogs rescued from other shelters. While I believe my model in prior years accurately reflected the New Jersey animal shelter system as a whole, the model’s euthanized dog targets for shelters who primarily rescue animals from other shelters may have been a bit too strict.
My analysis caps pit bull adoptions at 2 pit bulls per 1,000 people within each New Jersey county. In other words, the targeted numbers of dogs rescued from other shelters and adopted below are the lesser of
- Number predicted by model
- Number determined by capping pit bull adoptions at 2 pit bulls per 1,000 people in the county
In simple terms, a shelter is expected to achieve this per capita adoption rate unless the facility lacks enough space. If a shelter does not have sufficient room, it won’t have the time to reach all the potential adopters and requires assistance from rescues and/or other facilities. Given my model assumes 80% of rescued dogs are pit bull like dogs, my targeted numbers of dogs rescued and adopted are quite low as detailed in the section below. For example, shelters in counties where dog adoptions are capped have extra space that they do not use to adopt out other dog breeds.
To read specific details and assumptions used in the model, please see the Appendix at the end of this blog.
New Jersey Animal Shelters Contain Enough Space to Save All of New Jersey’s Dogs and Many More from Other States
New Jersey’s animal shelter system has enough space to save all of the state’s healthy and treatable dogs. The table below details the targeted numbers of dog outcomes the New Jersey animal shelter system should achieve. Out of the 20,531 New Jersey dogs coming into the state’s animal shelters in 2019, 9,834 and 1,092 dogs should have been adopted out and sent to other shelters/rescues by the facilities originally taking the dogs in. However, other New Jersey animal shelters had more than enough capacity to rescue the 1,092 dogs from space constrained facilities. Thus, New Jersey animal shelters should be able to able to adopt out every single healthy and treatable dog taken in from the state and not require any support from rescue organizations without physical facilities from a space perspective.
New Jersey animal shelters have enough excess space to save many dogs from out of state as well. Specifically, New Jersey animal shelters had enough physical capacity to rescue at least 12,429 dogs from out of state after achieving a 95% live release rate for New Jersey dogs. To put this number into perspective, New Jersey animal shelters could make both New York City and Philadelphia no kill cities for dogs and increase those cities’ dog live release rates to 95% in 2019 as follows:
- New York City – 1,047 additional dogs need saving
- Philadelphia – 417 additional dogs need saving
Additionally, New Jersey animal shelters could pull at least another 10,965 dogs from other locations outside of the state. Of course, some New Jersey animal shelters do pull some dogs from New York City and Philadelphia animal control shelters. However, most of these dogs are likely easy to adopt and therefore have short lengths of stay. As a result, the additional number of dogs New Jersey animal shelters could save from New York City, Philadelphia and elsewhere is probably not much lower than the figures above. Thus, New Jersey animal shelters could make New Jersey a no kill state for dogs as well as many other places.
These adoption goals are quite achievable when comparing the performance of well-run animal control shelters across the country. New Jersey animal shelters would only need to adopt out 2.6 dogs per 1,000 people in the state (1.2 dogs if no dogs rescued from out of state). As a comparison, recent per capita dog adoption numbers from several high performing no kill open admission shelters are as follows:
- Lynchburg Humane Society (Lynchburg, Virginia) – 14.3 dogs per 1,000 people
- Longmont Humane Society (Longmont, Colorado area) – 9.0 dogs per 1,000 people
- Lake County Animal Shelter (Lake County, Florida) – 4.6 dogs per 1,000 people
- Williamson County Animal Shelter (Williamson County, Texas) – 4.6 dogs per 1,000 people
Thus, many communities are already adopting out around two to six times as many dogs as the goal set for New Jersey animal shelters.
Some naysayers may claim New Jersey would have a more difficult time due to the state’s shelters taking in many pit bulls. However, this is a myth. My model estimates New Jersey animal shelters would need to adopt out roughly 0.4 pit bulls per 1,000 people to save 95% of New Jersey’s dogs. Our shelters would only need to adopt out around 1.5 pit bulls per 1,000 people if New Jersey shelters also rescued and adopted out the targeted number of pit bulls from other states. As a comparison, Florida’s Lake County Animal Shelter adopted out 1.32 pit bulls per 1,000 people in 2019. However, the shelter director believes the number is actually higher since the facility adopts out a good number of pit bull like dogs without a pit bull label. Furthermore, the pit bull adoption targets are even more reasonable given the model assumes there are roughly 1/3 of the number of dogs from other breeds to compete with in the New Jersey adoption market compared to Lake County, Florida.

Animal Deaths Vary Widely at New Jersey Animal Shelters
The goal of any properly managed animal shelter is to save all of its healthy and treatable animals. In some cases, such as selective admission rescue oriented shelters, it is pretty easy to not kill animals. In addition, other animal shelters with easy to service animal control contracts (i.e. few animals impounded, most strays quickly returned to owners) can avoid unnecessary killing due to having lots of extra space. As a result, some shelters may have an easier time than others in preventing killing at their shelters.
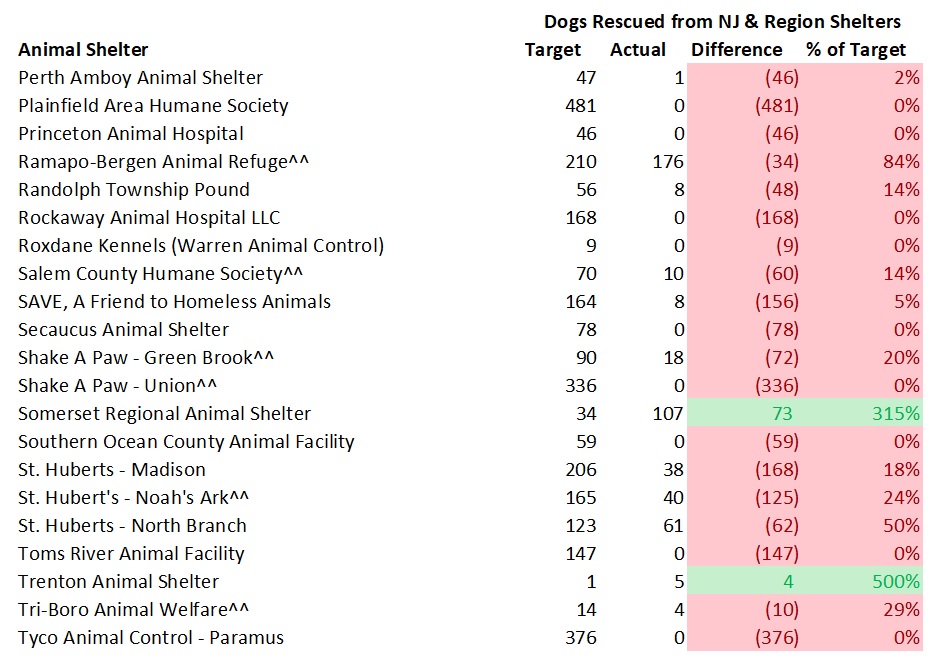
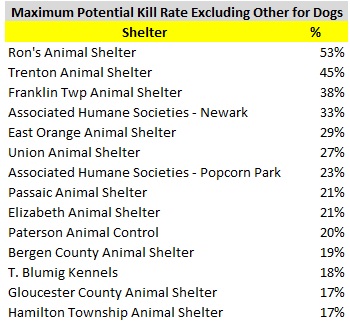
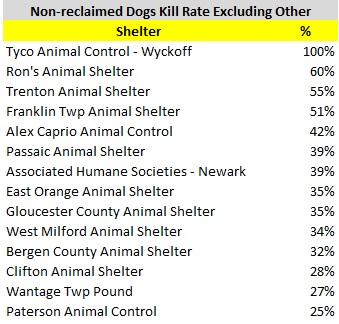
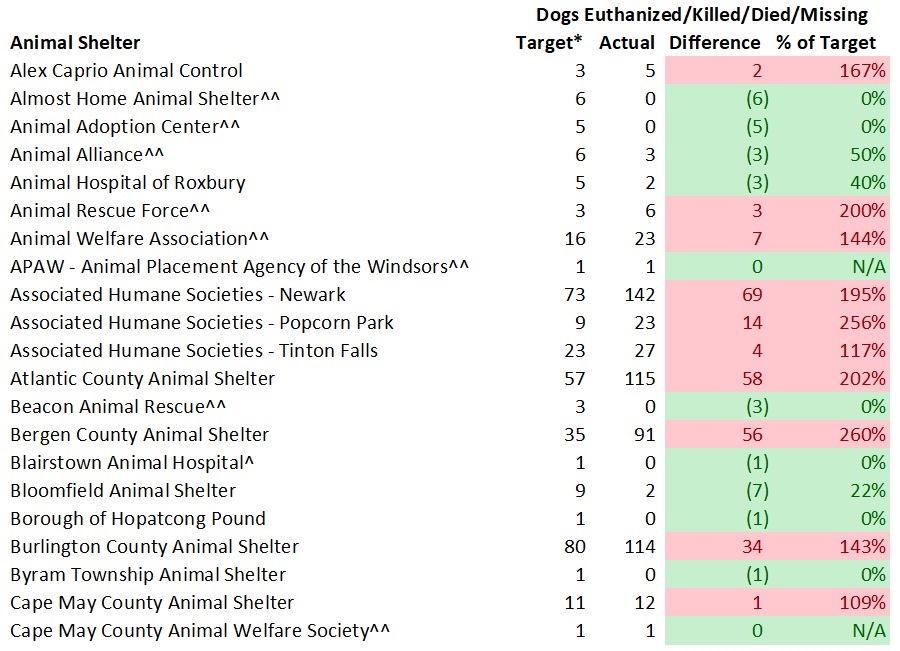
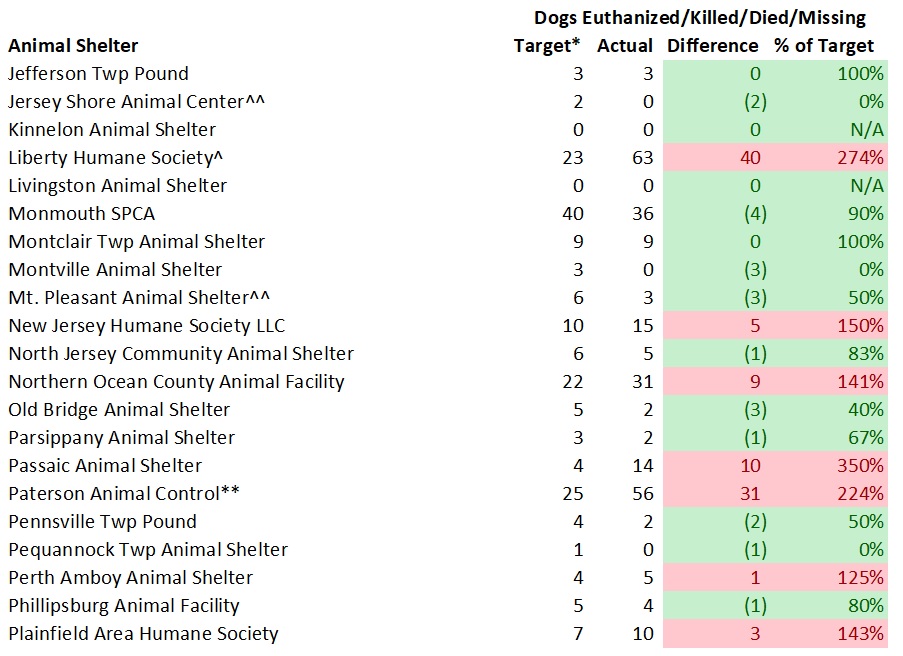
The tables below detail how many dogs should lose their lives at each state animal shelter per my model and the actual numbers of dogs that did. The model’s targets have shelters euthanizing 5% of community dogs (strays, owner surrenders, cruelty/bite cases, etc.) and 1% of dogs rescued from other shelters. All missing or lost dogs are assumed “dead” based on the assumption they died or went to a very bad place. Based on my review of a number of shelters’ underlying documents, virtually all of the dogs in the “Other” outcome category died or went missing. Shelters having the number of dogs losing their lives at or below my targets and above my targets are highlighted in green and red in the tables below.
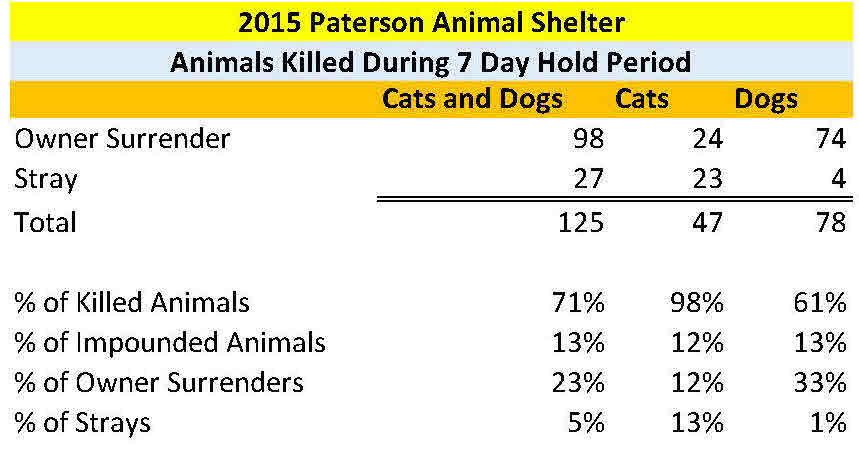
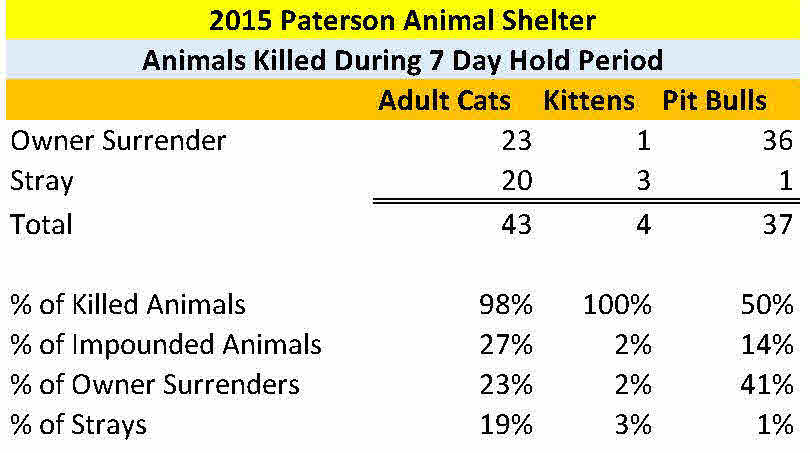
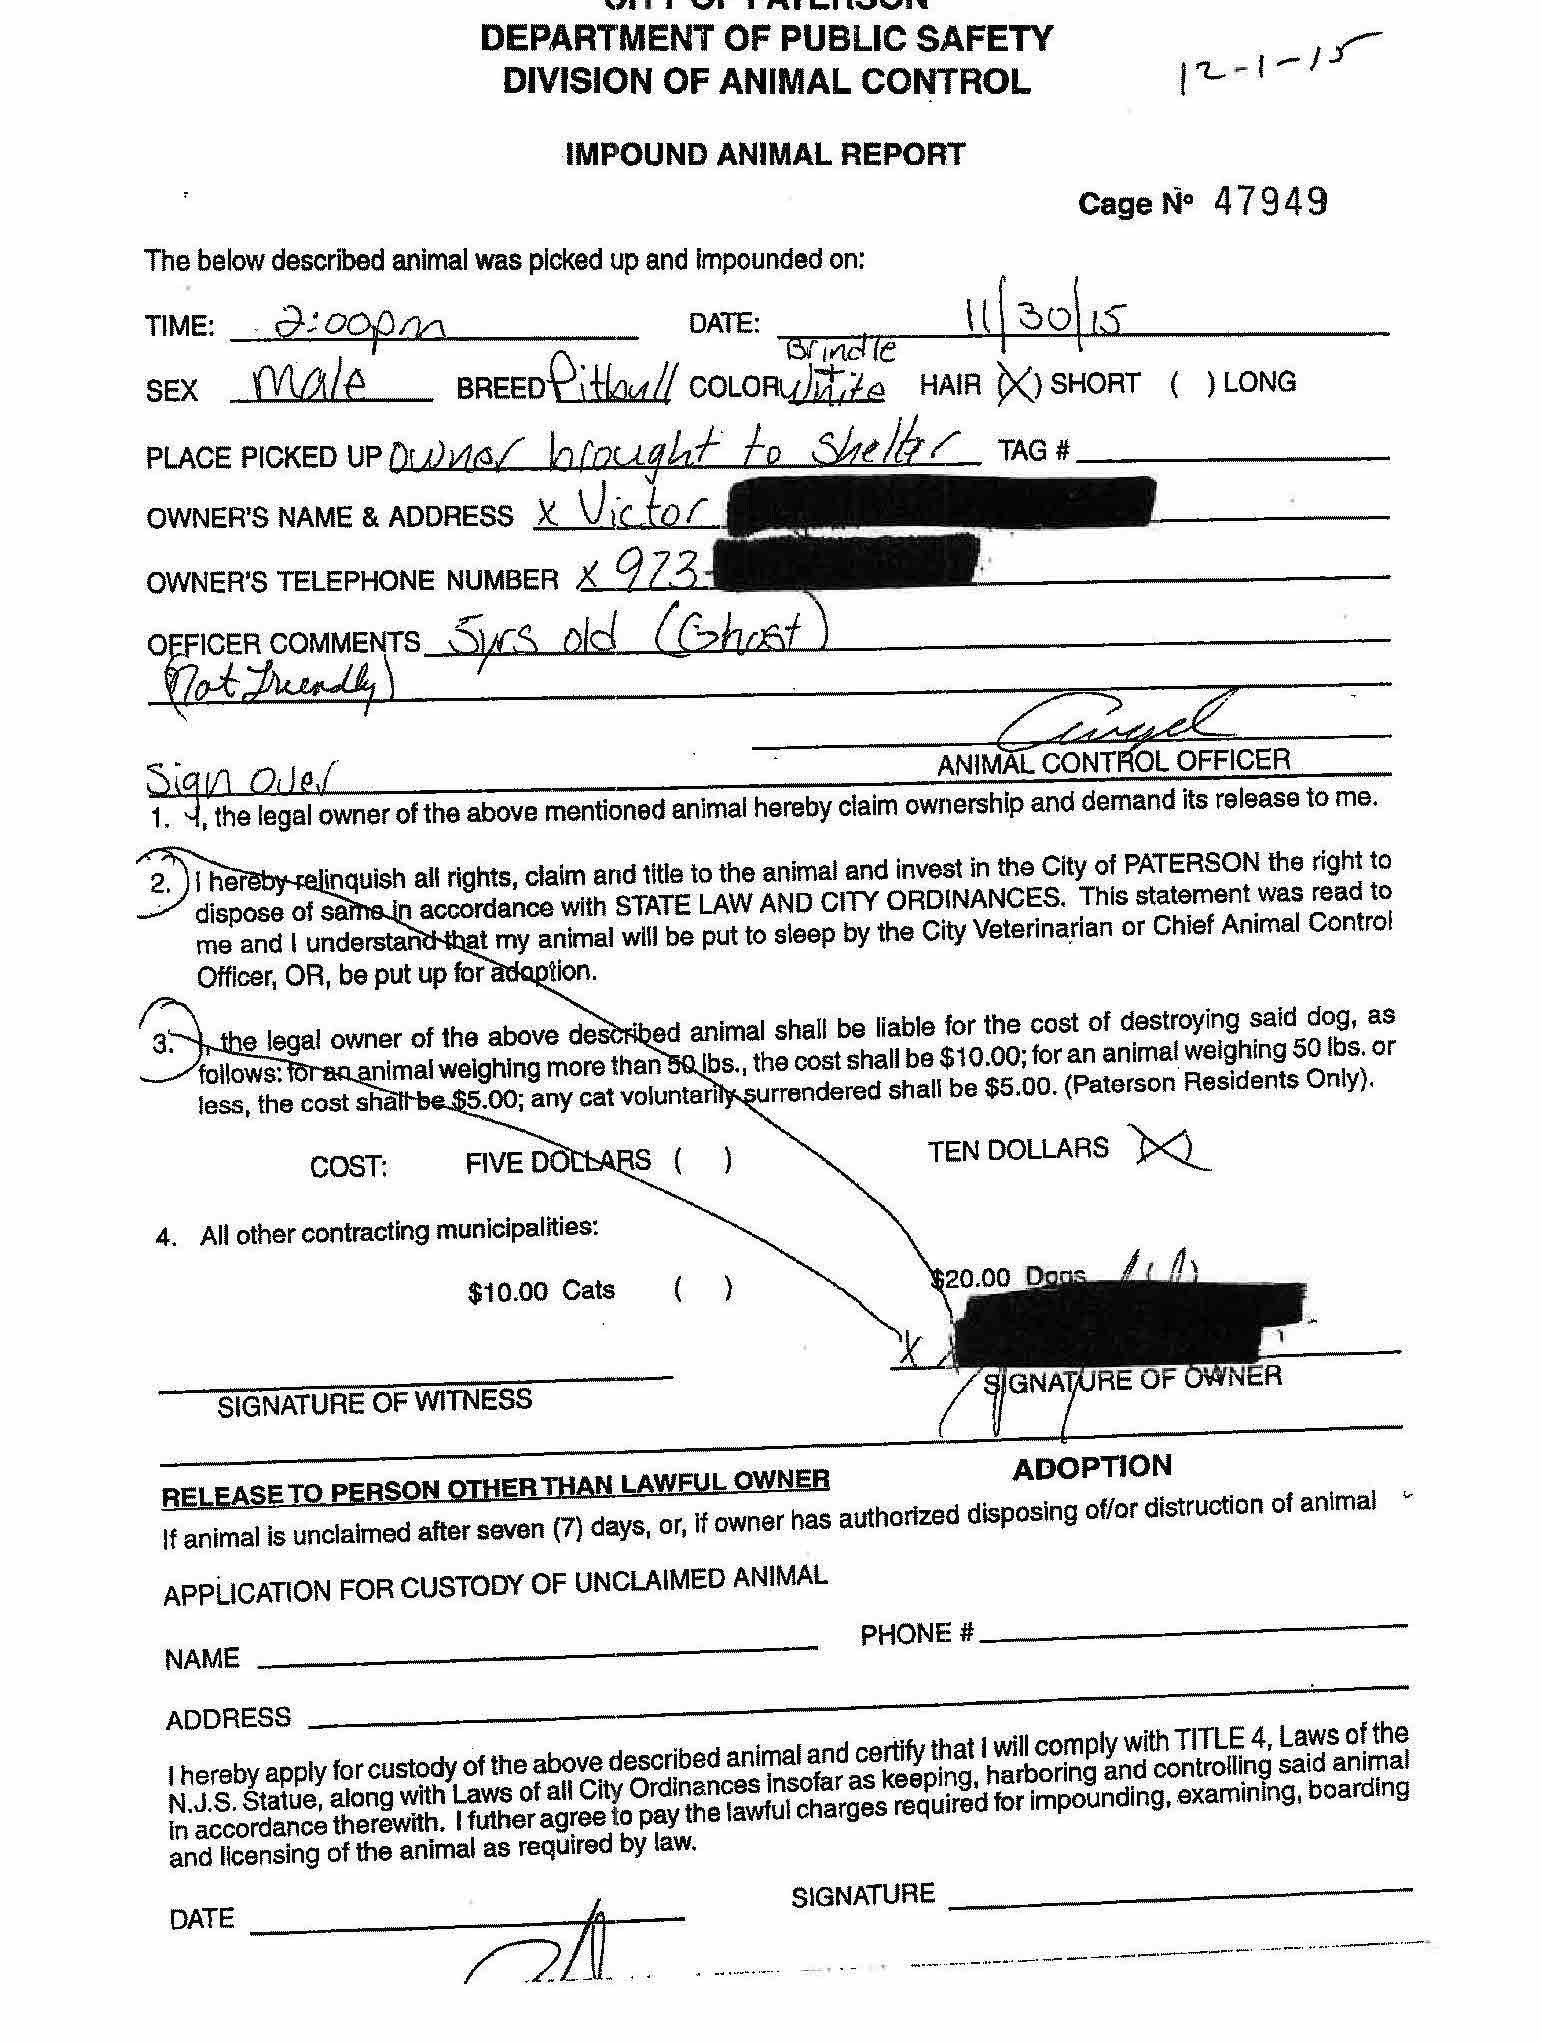
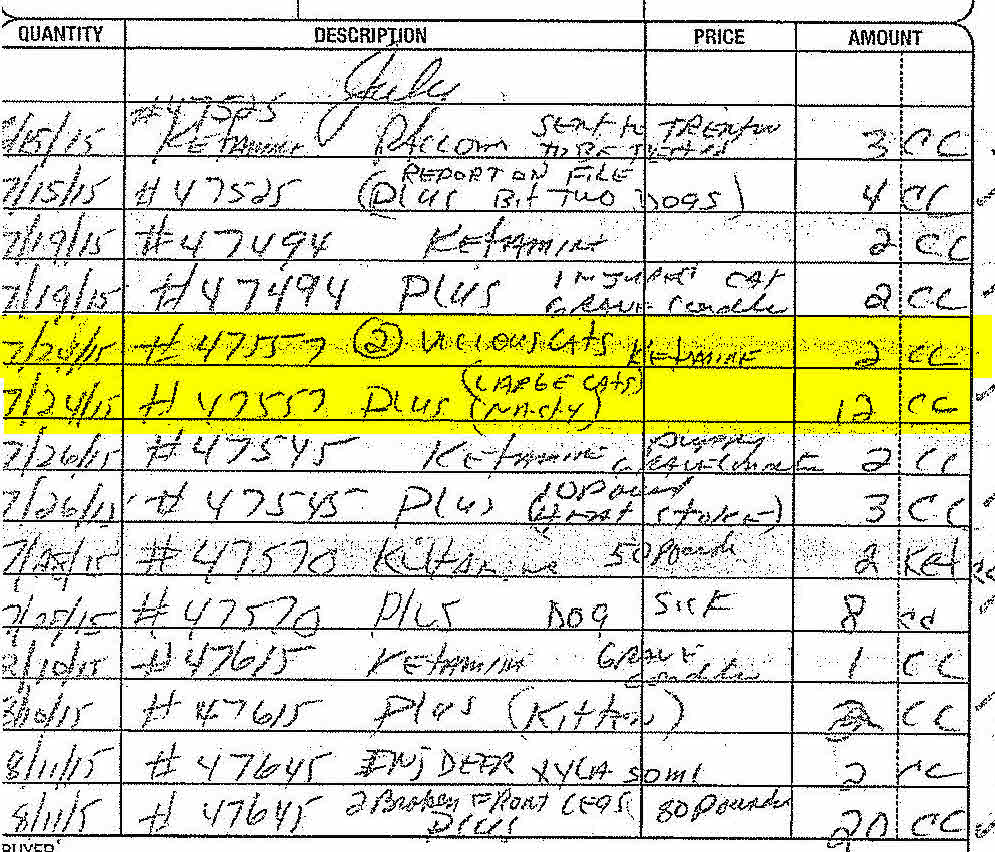
The largest number of dogs unnecessarily dying occurred at a relatively small number of shelters. Overall, 880 dogs needlessly lost their lives at New Jersey animal shelters in 2019 (i.e. the sum of all shelters killing too many dogs). 13 out of 92 or 14% of the shelters accounted for 81% of the dogs unnecessarily losing their lives under the model’s assumptions. Associated Humane Societies’ three shelters needlessly killed 87 dogs per the model or 10% of the total dogs unnecessarily dying in the state’s shelters. Trenton Animal Shelter, Gloucester County Animal Shelter, Bergen County Animal Shelter and Paterson Animal Control, which all broke state law in recent years, needlessly killed 177 dogs per the model or 20% of the total dogs unnecessarily dying in the state’s shelters. Shelters with the greatest number of unnecessary dog deaths are as follows:
- St. Hubert’s – Madison (104)
- Gloucester County Animal Shelter (90)
- Associated Humane Societies – Newark (69)
- Toms River Animal Facility (62)
- Atlantic County Animal Shelter (58)
- Bergen County Animal Shelter (56)
- Trenton Animal Shelter (51)
- Humane Society of Atlantic County (48)
- Homeward Bound Pet Adoption Center (41)
- Liberty Humane Society (40)
- Burlington County Animal Shelter (34)
- Paterson Animal Control (31)
- South Jersey Regional Animal Shelter (25)
Thus, the bulk of the dogs unnecessarily dying at New Jersey animals shelters occurs at a small number of facilities.


Most New Jersey Animal Shelters Require Little Rescue Assistance
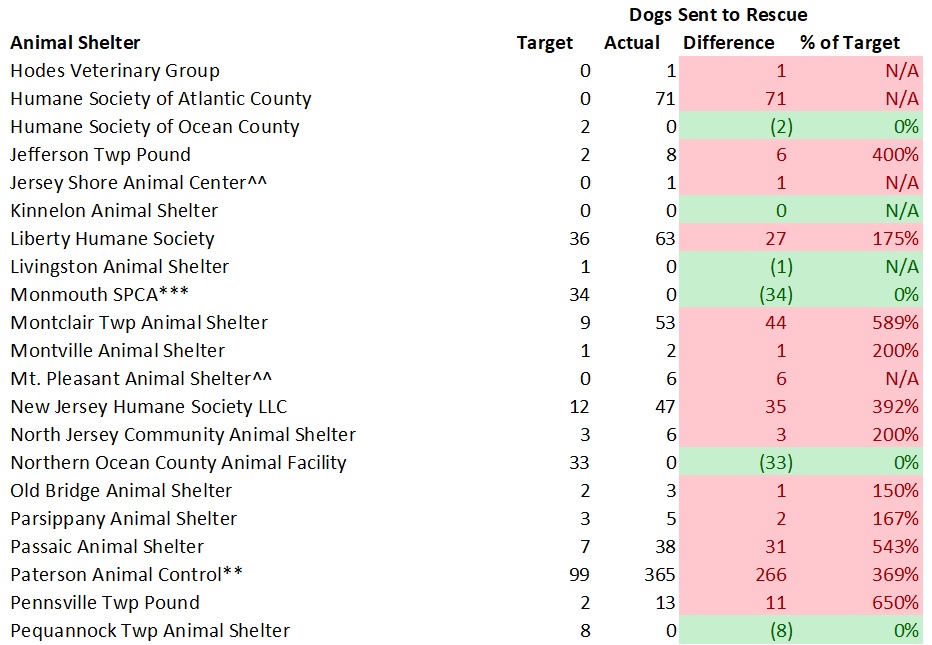
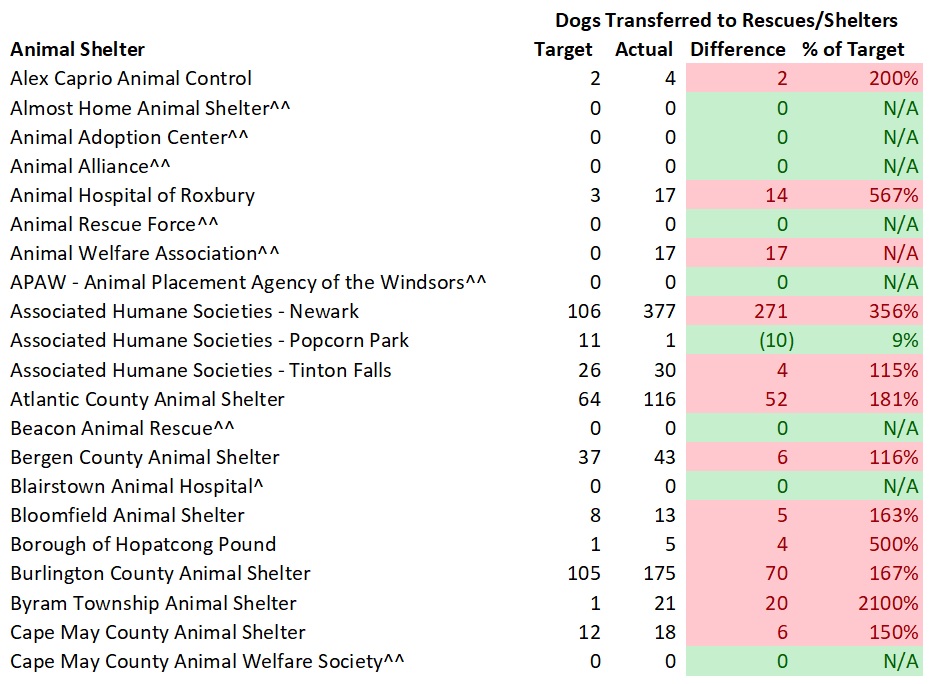
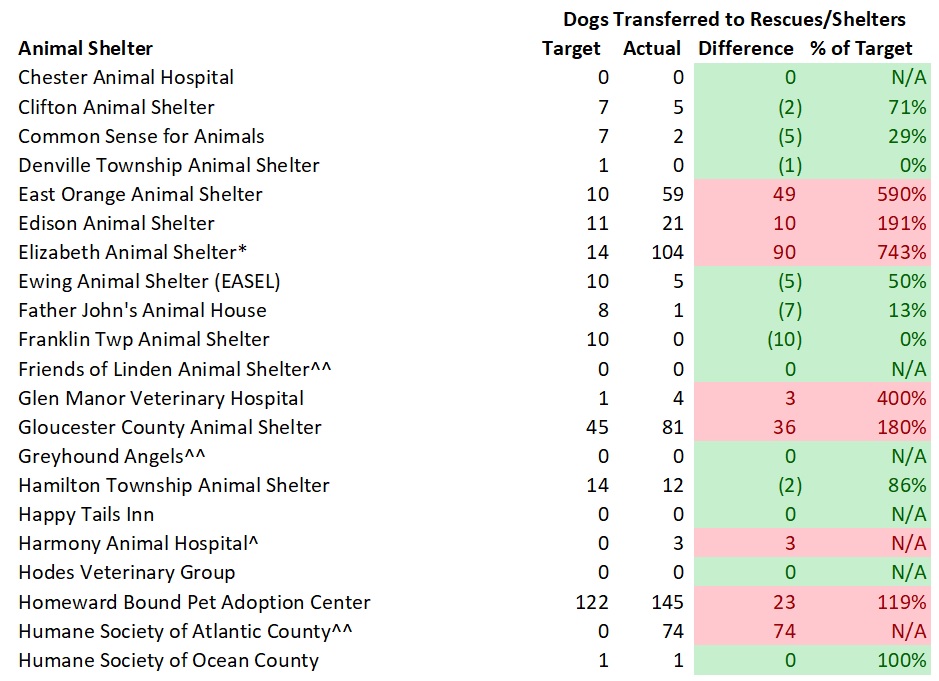
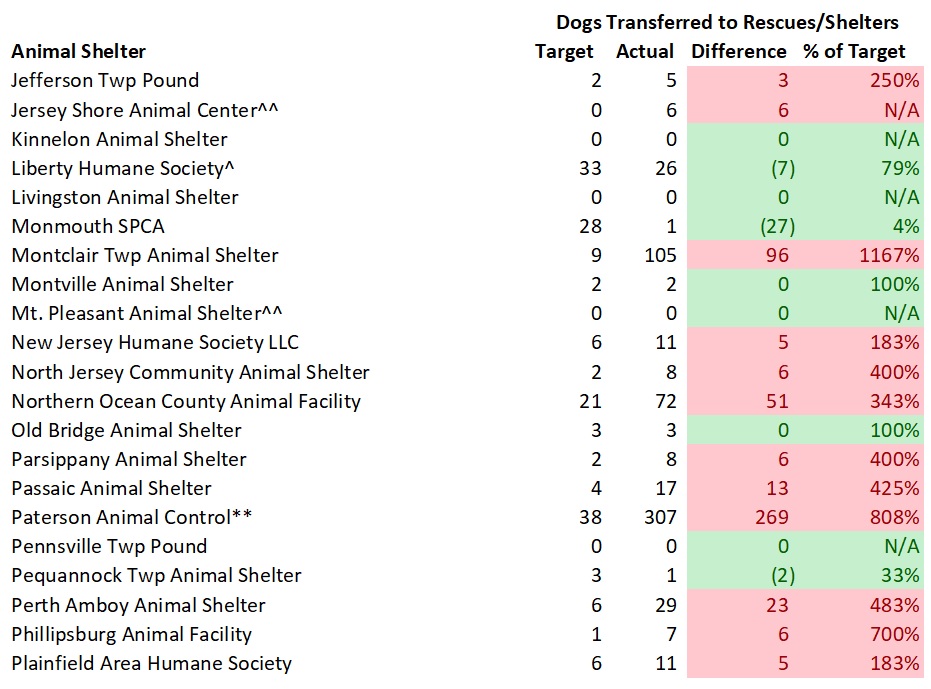
Some animal shelters will require more support from rescues and animal shelters with excess space than others. If a shelter has relatively high intake, very limited space, and few stray dogs returned to owners, it will need more help than other shelters. In an ideal world, rescues would take all shelter animals. However, due to limited numbers of foster homes, lesser ability to find foster homes due to many rescue organizations’ small sizes, and most rescues’ restrictive adoption policies, all shelters cannot heavily rely on rescues. The tables below compare the number of dogs a shelter should transfer to other organizations per the model and the number of dogs actually sent to other animal welfare groups. Shelters marked in green are receiving less than the expected rescue support while facilities marked in red are receiving too much rescue help.
Overall, most New Jersey animal shelters require little rescue support if space-constrained facilities fast-track their most highly adoptable dogs. Shelter medicine experts advocate prioritizing the processing of highly adoptable animals to make the best use of space and reduce disease. For example, making sure these animals are the first to get spayed/neutered and vaccinated and receive microchips to ensure they can leave as soon as the shelter finds a good home.
46 shelters received too much help, 26 facilities received just enough assistance and 20 shelters received too little help from other animal welfare organizations. However, the excess dogs rescued (1,653 dogs) at shelters receiving too much assistance was far higher than the rescue deficits at other shelters (173 dogs) resulting in the state’s shelters sending 1,480 more dogs than needed to rescues and other animal welfare organizations. Some shelters, such as Elizabeth Animal Shelter and Paterson Animal Control, report transfers to rescues and other shelters as adoptions. While I made adjustments for these facilities based on my reviews of these facilities underlying records in past years, its certainly possible other shelters incorrectly reported their data (i.e. counting animals sent to rescues as adoptions). Nonetheless, the New Jersey shelter system as a whole is receiving enough rescue assistance, but some shelters are hurt by rescues pulling animals from less needy facilities.
Rescue groups and shelters with extra space should pull dogs from kill shelters with the highest rescue “target” numbers and deficits in the tables below. If shelters not needing rescue support get that extra help, these shelters will not take the steps necessary to properly run their facilities. As a result of enabling poorly performing shelters and not pulling dogs from truly space constrained facilities, rescuing dogs from shelters with enough space leads to less lifesaving.
Shelters receiving less than needed rescue support should also examine their own policies and performance. Are the shelter’s operating processes allowing too many animals to get sick and therefore discouraging organizations to rescue their animals due to subsequent medical costs? Does the shelter actively reach out to rescues/other shelters and treat them with respect? Does the shelter make it convenient for other organizations to pull their animals?
Given killing animals for space is intolerable, the space-constrained shelters need to expand their effective dog capacity. These facilities could use extra space in their buildings to house dogs on a short-term basis. These shelters can enter into arrangements with local veterinarians to house and adopt out some dogs. Additionally, creating a pet owner surrender prevention program, implementing a proper managed intake policy (i.e. where animals are impounded when in danger and waiting periods for owner surrenders are relatively short) and making serious efforts to return lost dogs to owners could free up space in these shelters. Finally, space-constrained shelters with multiple animal control contracts should terminate some of these arrangements to bring their capacity for care in line with the number of dogs they take in. As a result, space constrained shelters still need to take active steps to reduce killing rather than simply solely relying on rescue support.
In certain circumstances, it may make sense for shelters with excess space to send dogs to rescues. For example, a unique breed or a dog needing very specialized behavioral or medical rehabilitation. However, these cases are accounted for in my targeted sent to rescue figures for animal control shelters.


Most New Jersey Animal Shelters Fail to Come Close to Reaching Their Local Dog Adoption Potential
We can assess each shelter’s contribution to making New Jersey and nearby areas no kill. While a shelter may be able to avoid killing healthy and treatable animals, it still may not live up to its potential for adopting out local dogs. On the other hand, a space constrained shelter may kill healthy and treatable dogs, but still do a good job adopting animals out.
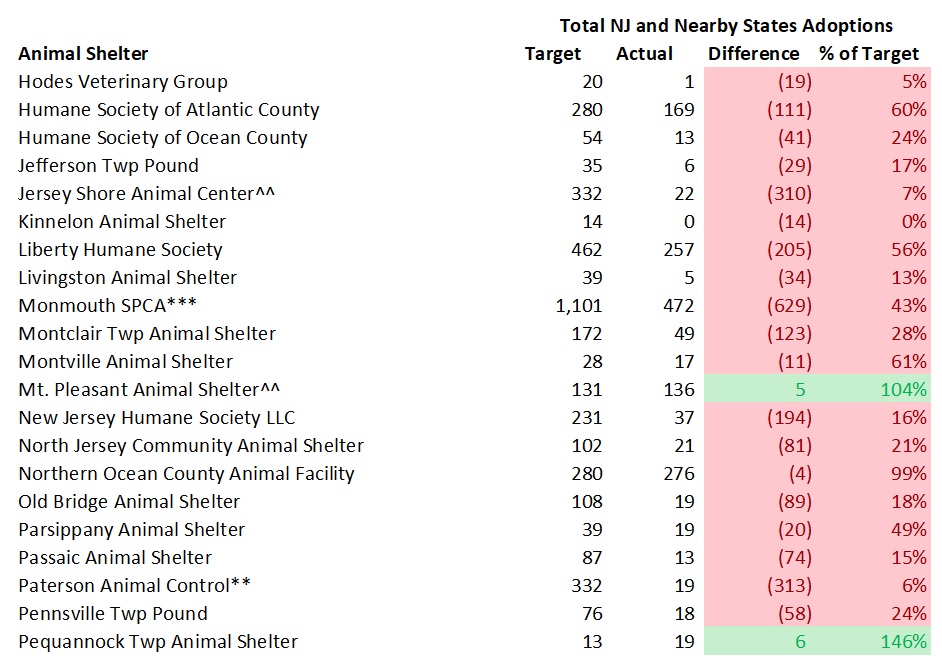
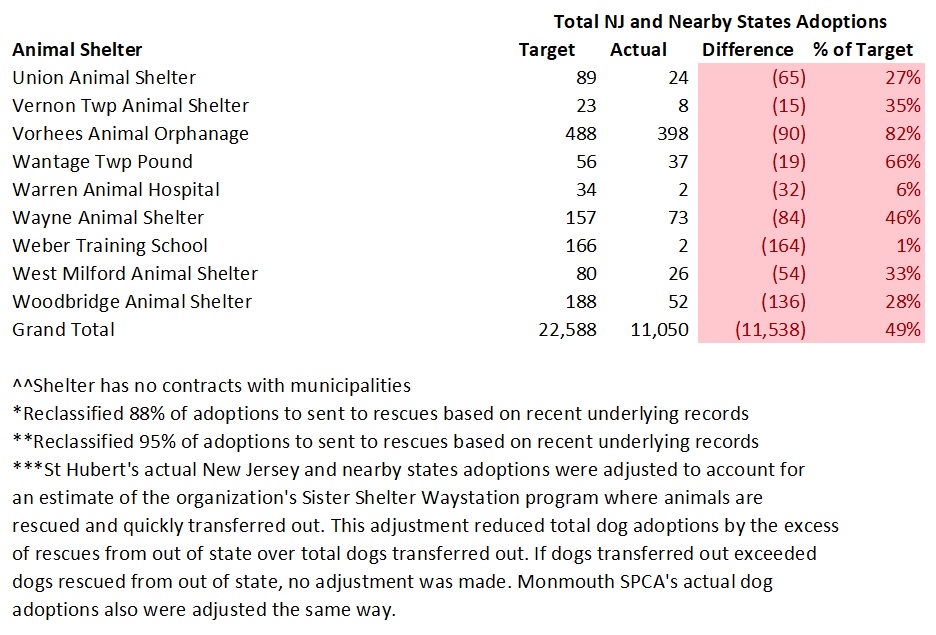
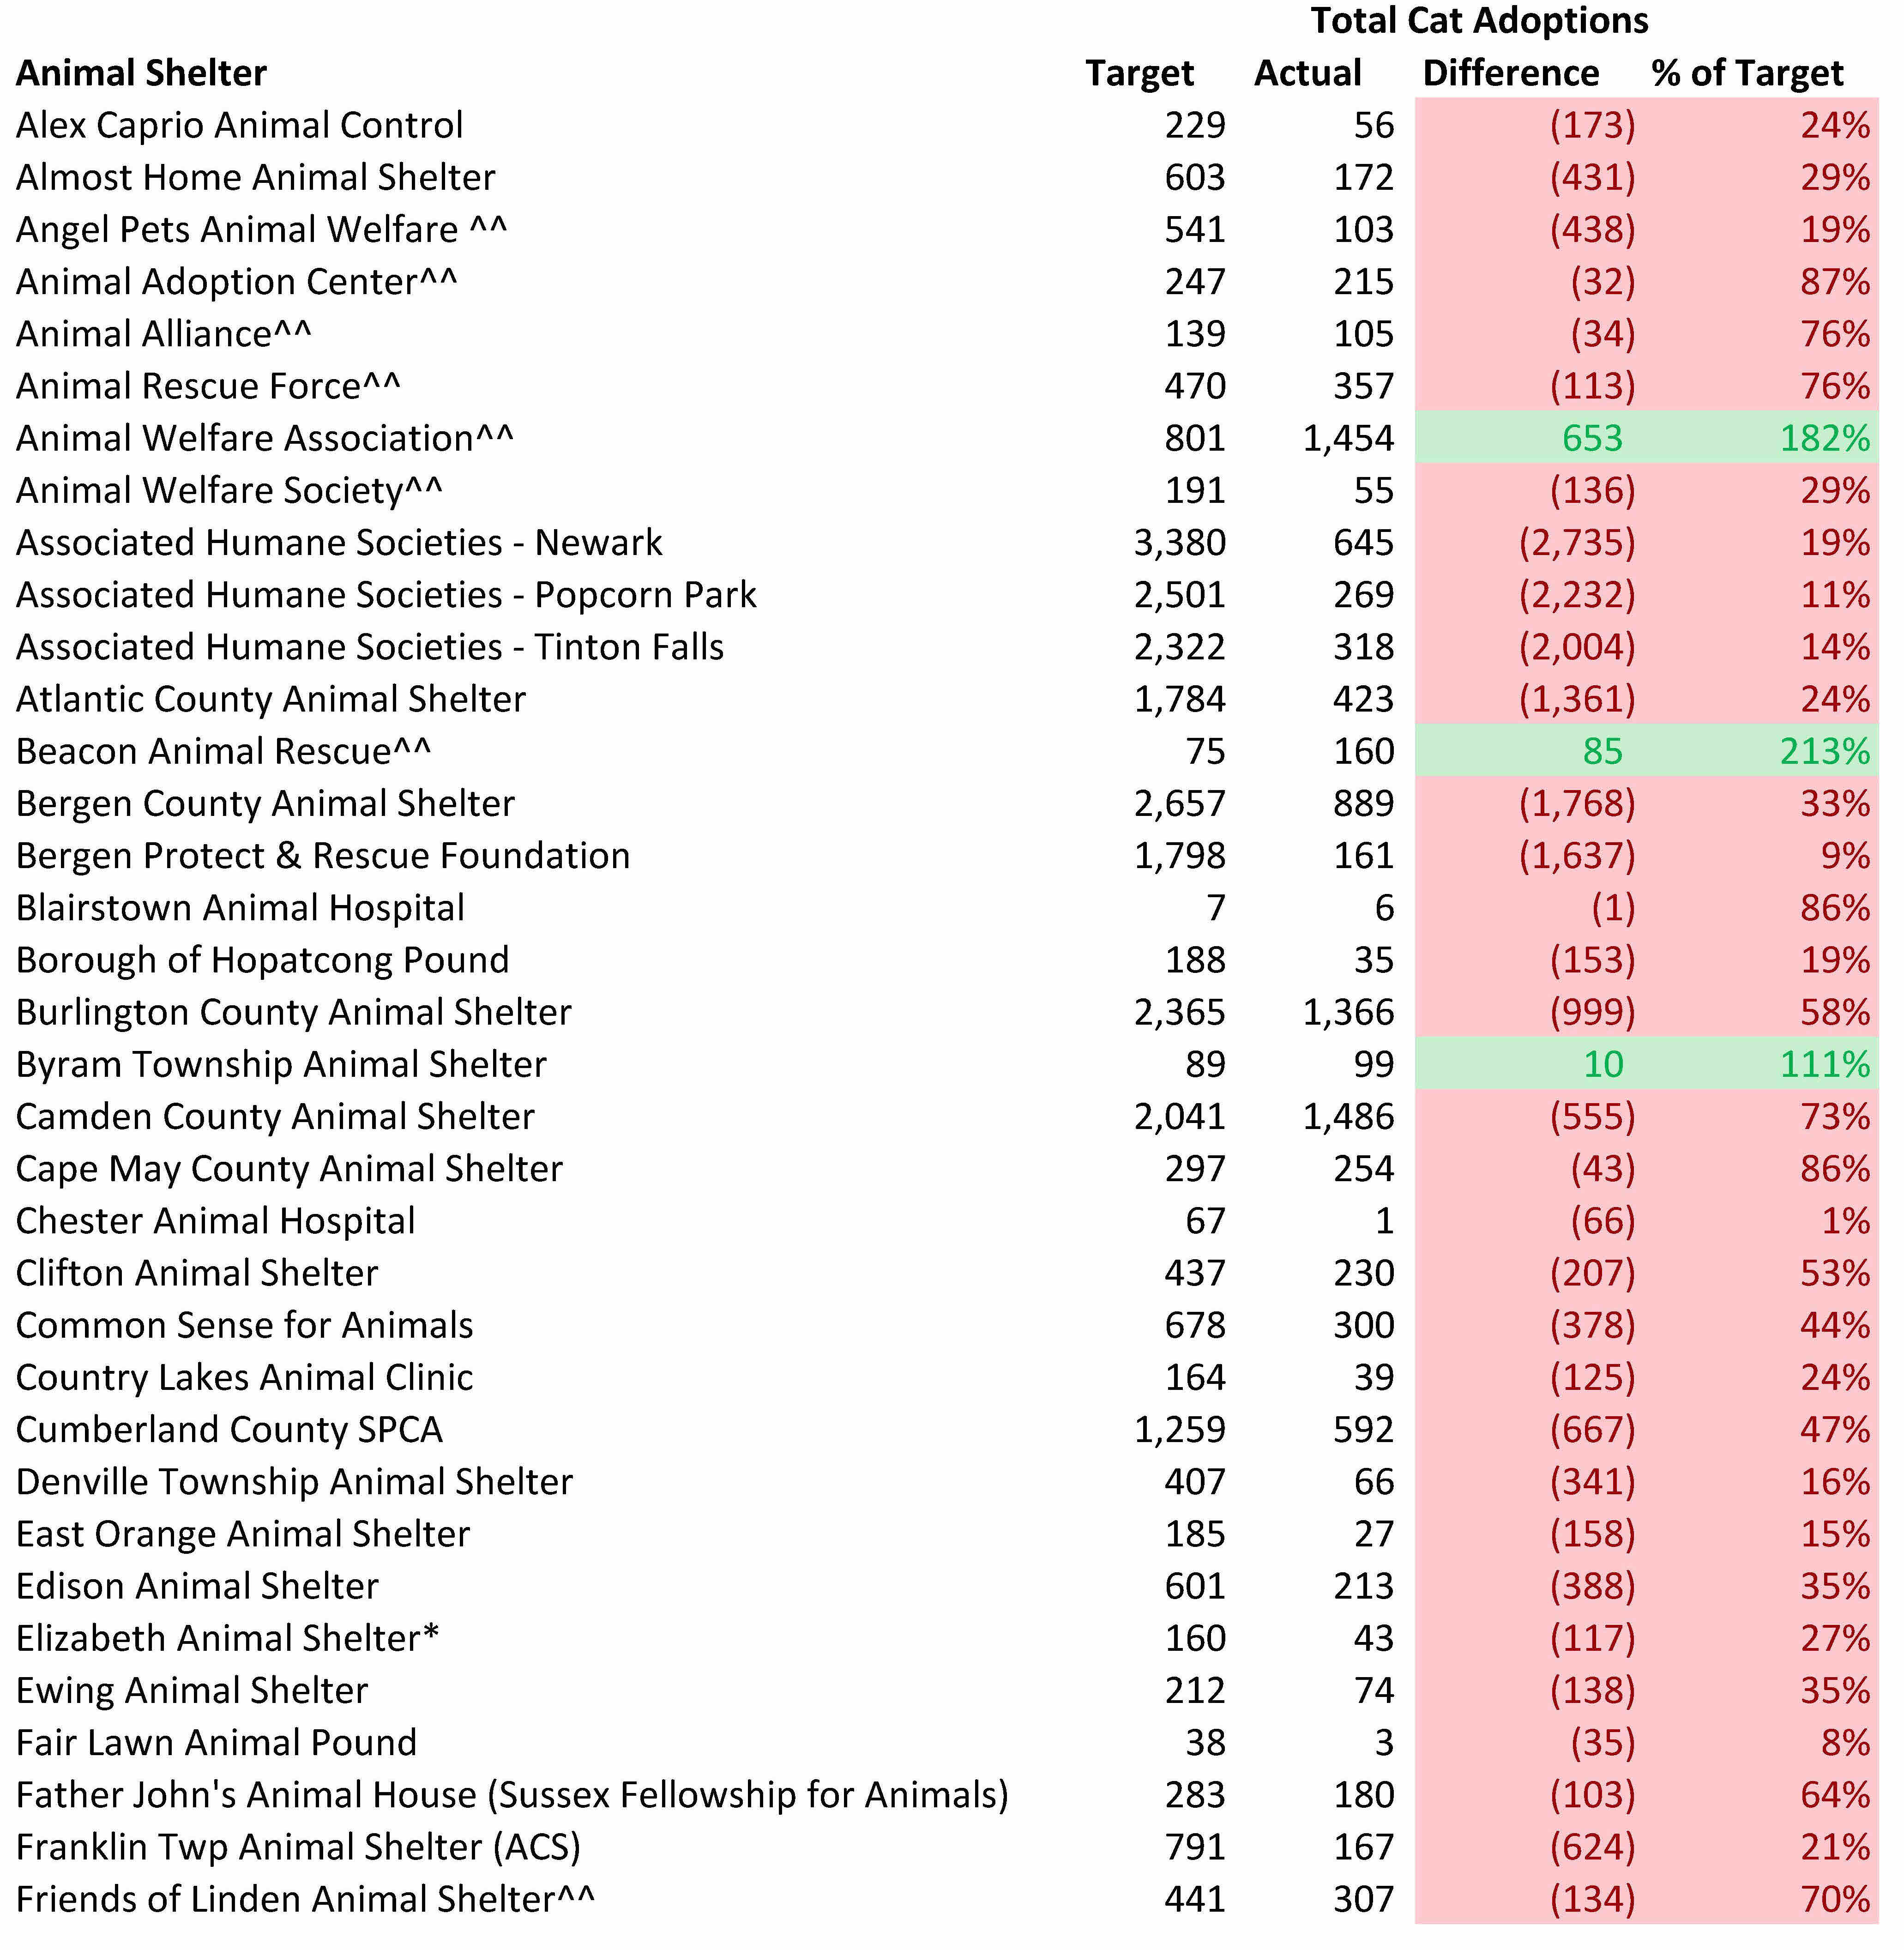
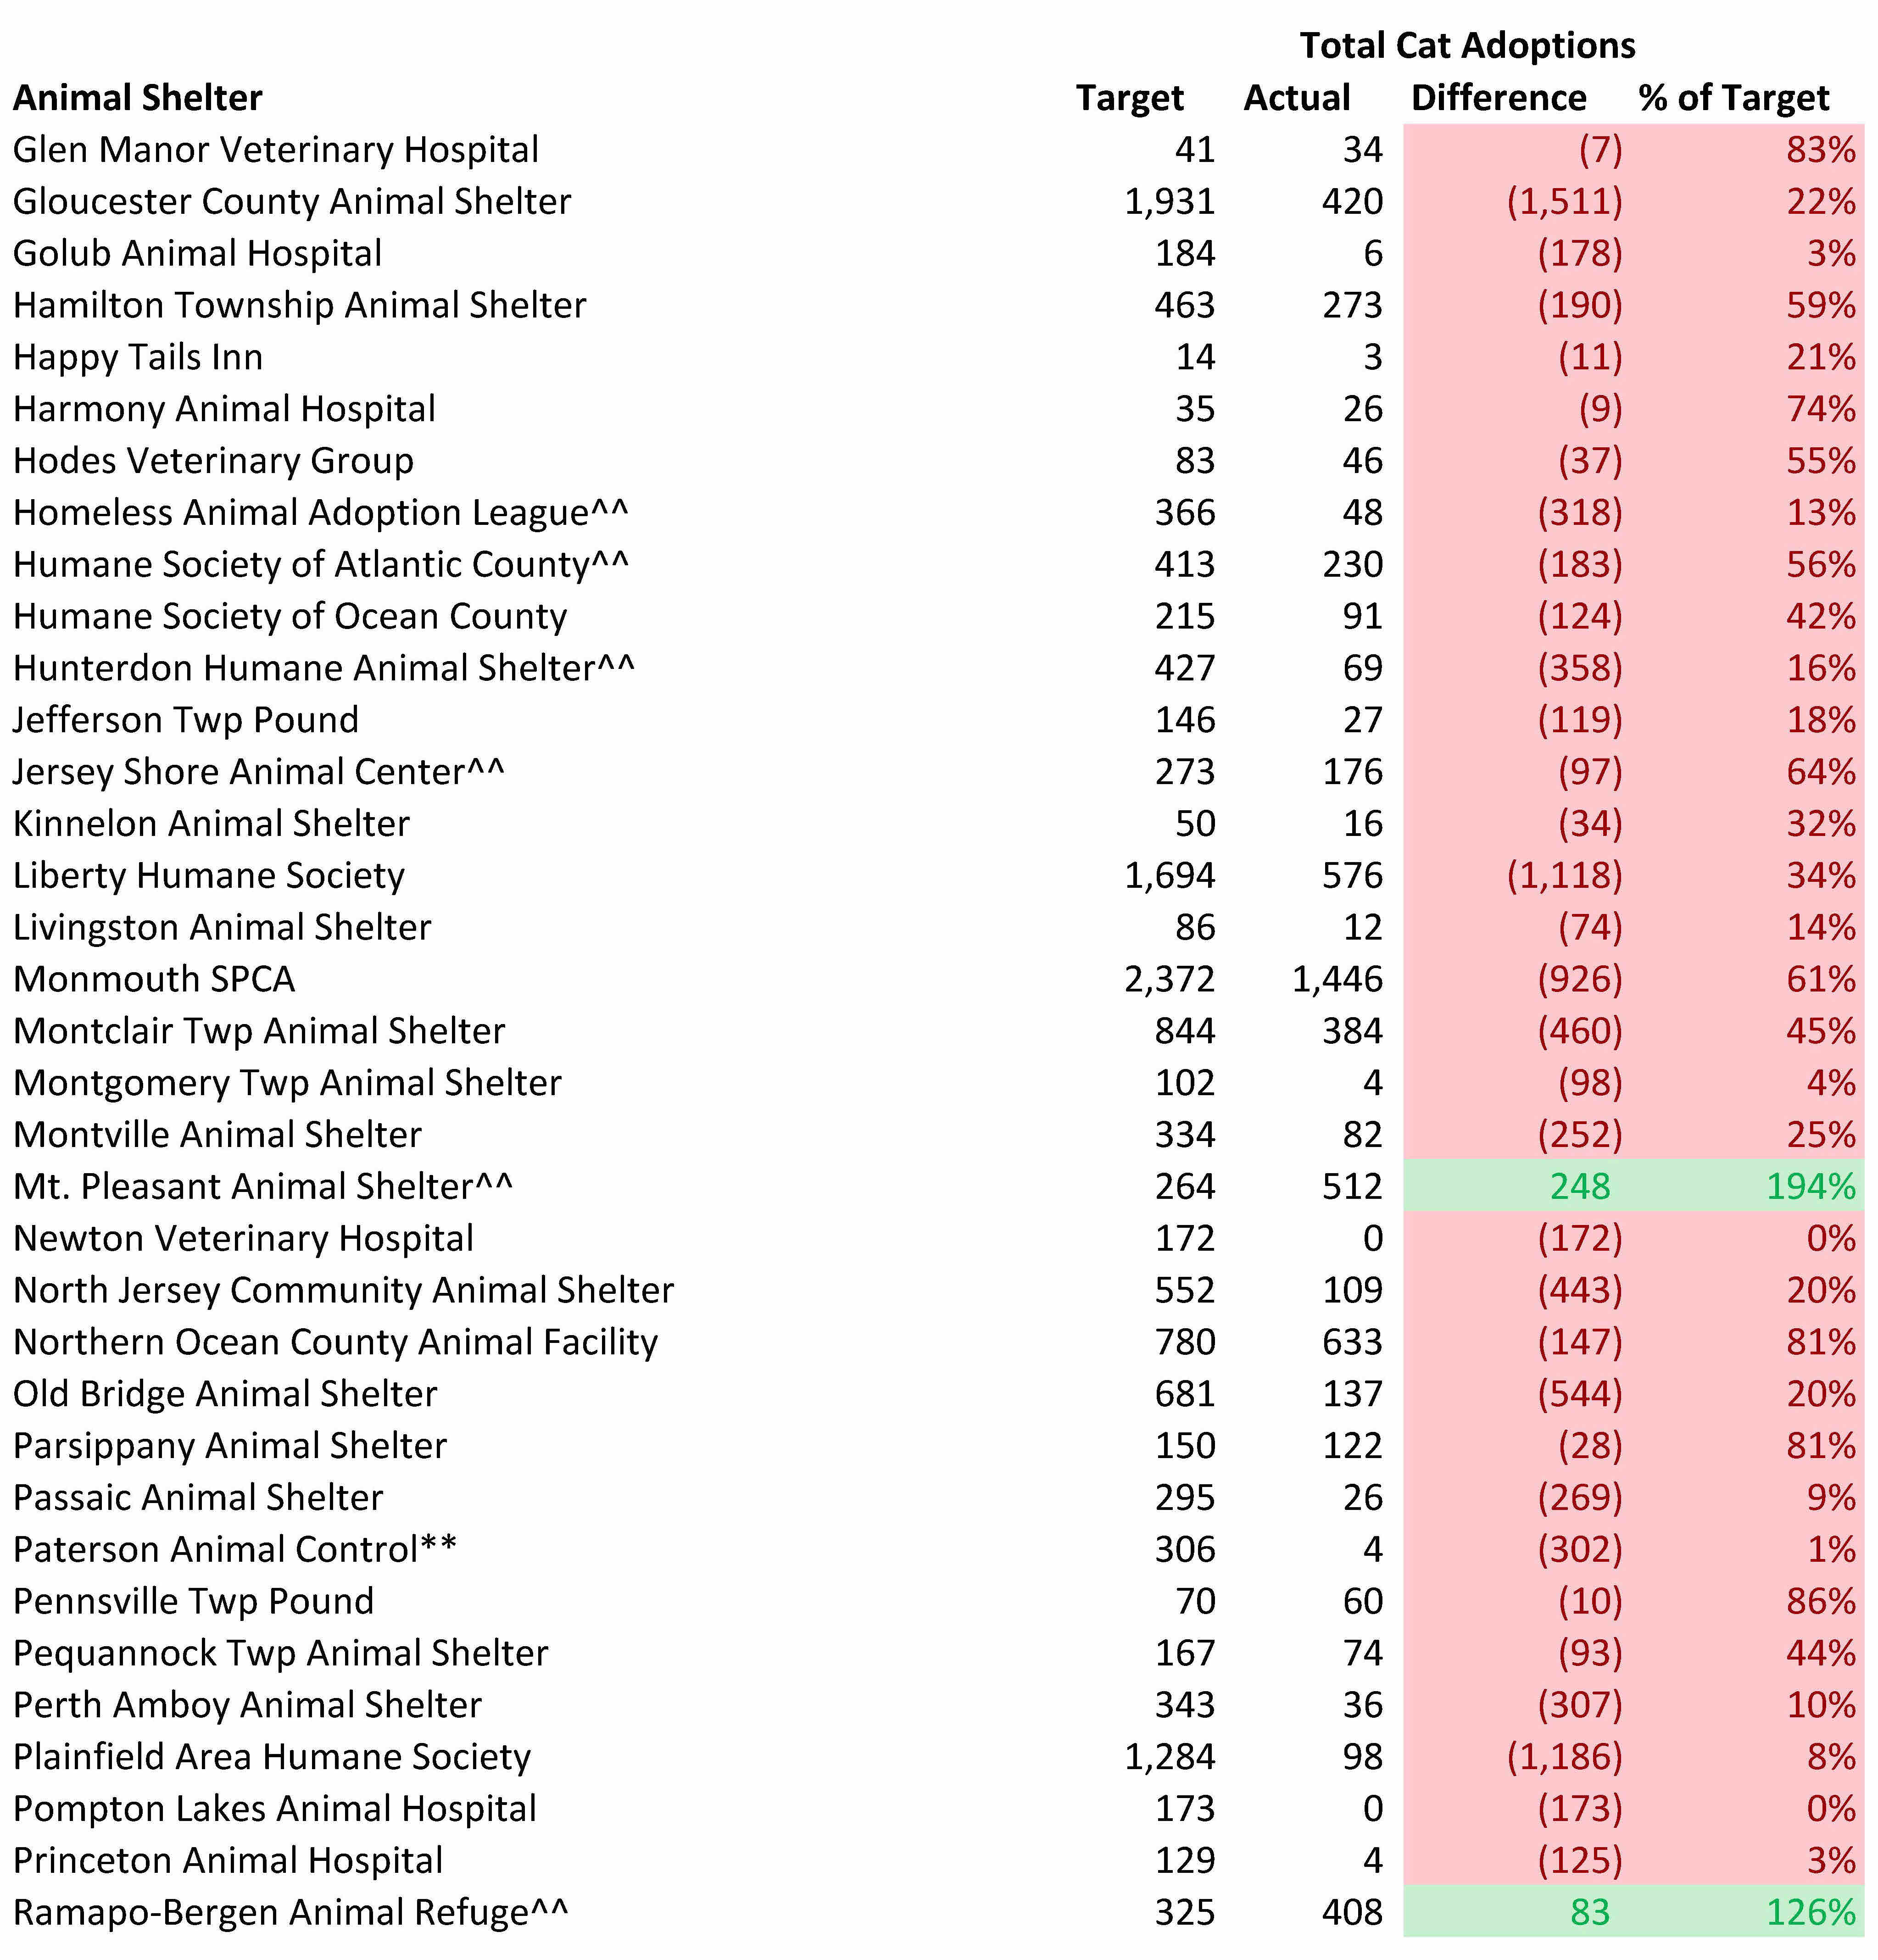
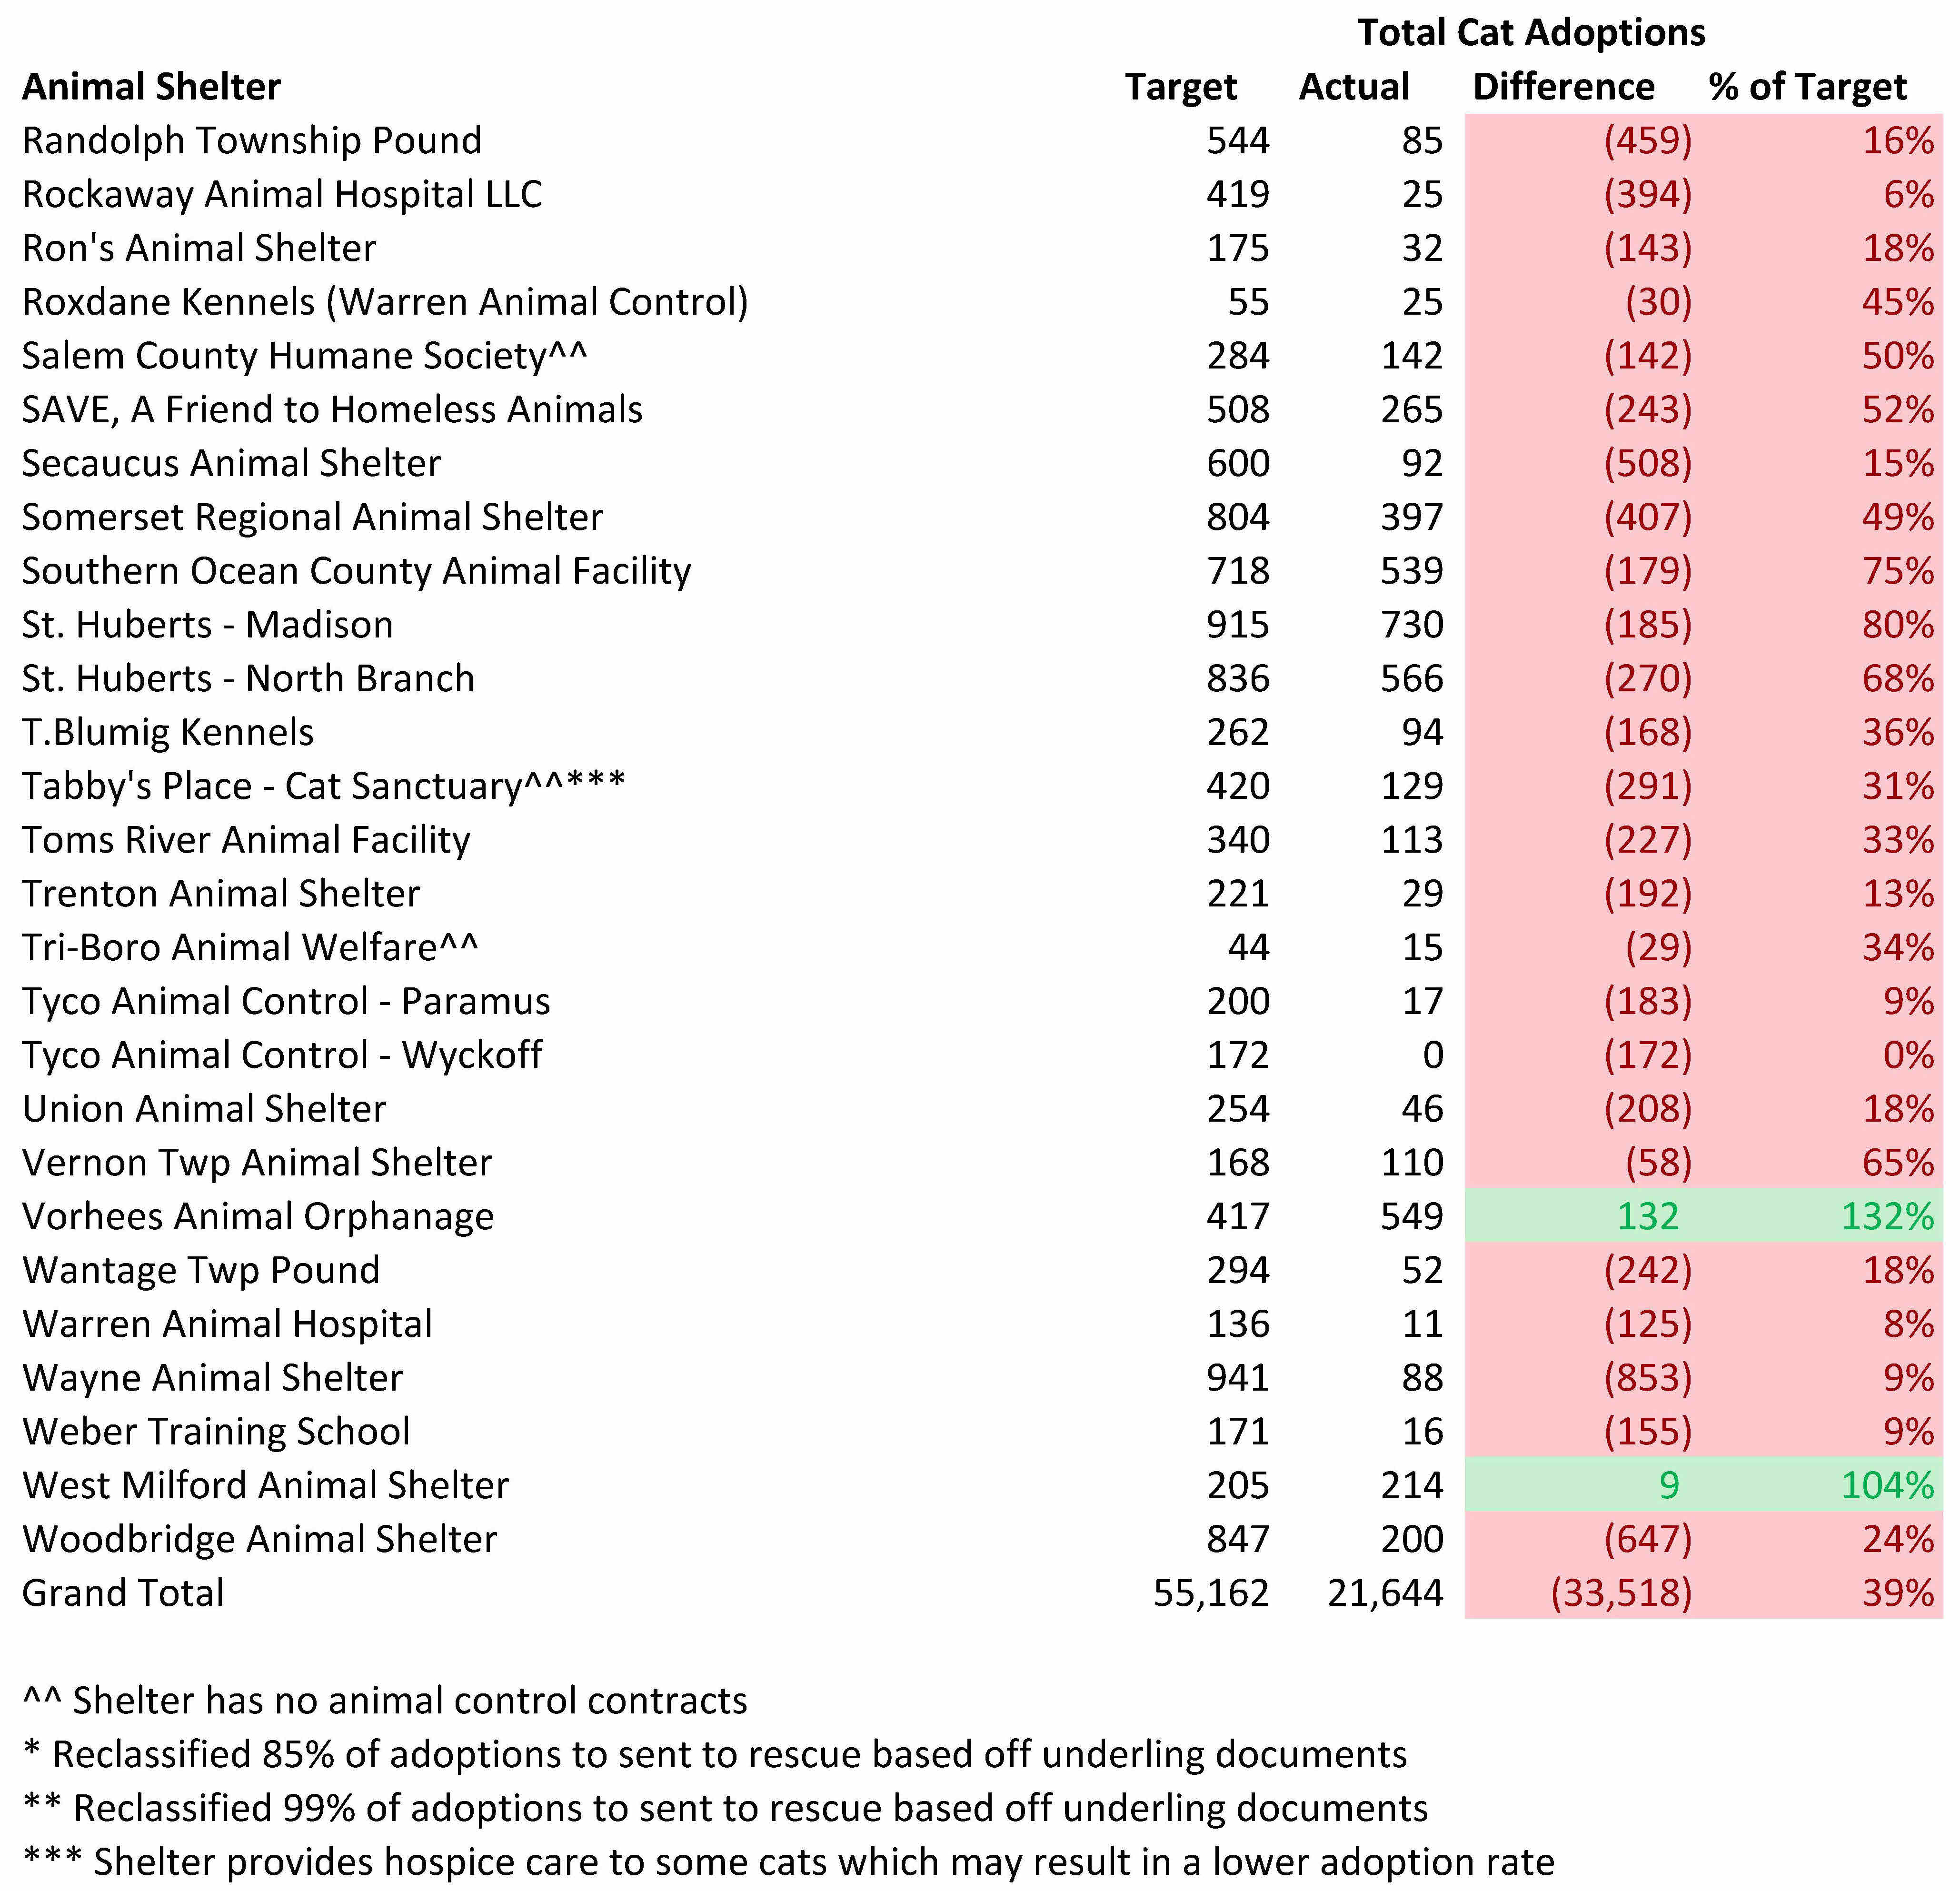
The tables below compare the number of dogs from New Jersey and nearby states each animal shelter should adopt out with the estimated number of local dogs actually adopted out.
Many rescue oriented shelters likely pull much easier to adopt dogs than the bulk of dogs needing to get rescued from local facilities. Thus, the results from rescue oriented shelters may look better than they actually are.
Few organizations reached or exceeded their adoption targets. Specifically, only 7 out of 92 shelters met the adoption goals computed by the Life Saving Model. Thus, the overwhelming number of New Jersey animal shelters need to step up their adoption efforts.
Common Sense for Animals exceeded its adoption target, but this may at least partially be due to inaccurate records. While this organization exceeded its adoption targets, the shelter’s figures were off by 69 dogs using the methodology outlined in another blog.
Morris County animal shelters’ higher than targeted local dog adoption results are a bit misleading. These facilities benefited from the method I used to cap adoptions in the county and reduce adoption targets. For example, St. Hubert’s Noah’s Ark’s actual adoptions percentage of its targeted adoptions figures dropped from 159% to 64% when I looked at the unadjusted model. Similarly, Pequannock Animal Shelter’s and Denville Animal Shelter’s actual adoptions percentage of their targeted adoptions figure dropped from 240% to 100% and 100% to 40% when I looked at the unadjusted method. Since Morris County has many shelters that collectively have a very large capacity (i.e. very high adoption potential), my model reduces all Morris County animal shelters’ target adoptions to my county adoption cap. In addition, Pequannock Animal Shelter lists a dog capacity of just one dog at its shelter that is significantly less than the number of dog kennels I’ve seen at the facility in the past. Also, Tri-Boro Animal Welfare lists an unusually small dog capacity of just four dogs which lowered their adoption target. Therefore, these shelters have relatively low dog adoption targets. Additionally, St. Hubert’s-Noah’s Ark may rescue a number of dogs from other St. Hubert’s facilities and those dogs may come from out of state. Thus, these shelters really didn’t do an excellent job adopting out local dogs.
Similarly, Humane Society of Atlantic County and Humane Society of Ocean County also benefited from my model capping adoptions in their counties. Since much larger shelters exist in those counties, these smaller shelters had their adopting targets capped at a relatively low level. Humane Society of Atlantic County’s and Humane Society of Ocean County’s actual adoptions percentage of their targeted adoptions figures dropped from 106% to 91% and 125% to 44% when I looked at the unadjusted method.
Shelters adopting out the fewest animals in total relative to their targets were as follows:
- Associated Humane Societies-Newark – 1,241 fewer dogs adopted than targeted
- Monmouth SPCA – 529 fewer dogs adopted than targeted
- Associated Humane Societies-Popcorn Park – 506 fewer dogs adopted than targeted
- Plainfield Area Humane Society – 494 fewer dogs adopted than targeted
- Tyco Animal Control – Paramus – 433 fewer dogs adopted than targeted
- Bergen County Animal Shelter – 428 fewer dogs adopted than targeted
- Gloucester County Animal Shelter – 388 fewer dogs adopted than targeted
- Burlington County Animal Shelter – 358 fewer dogs adopted than targeted
- Atlantic County Animal Shelter – 335 fewer dogs adopted than targeted
- Paterson Animal Control – 311 fewer dogs adopted than targeted
- Shake a Paw-Union – 310 fewer dogs adopted than targeted
- Greyhound Angels – 290 fewer dogs adopted than targeted
- Montclair Township Animal Shelter – 280 fewer dogs adopted than targeted
- New Jersey Humane Society – 275 fewer dogs adopted than targeted
- Hamilton Township Animal Shelter – 274 fewer dogs adopted than targeted
Several shelters’ poor performance is quite predictable. Associated Humane Societies-Newark, Paterson Animal Shelter, Shake a Paw-Union, New Jersey Humane Society, Gloucester County Animal Shelter, Monmouth SPCA, Hamilton Township Animal Shelter and Bergen County Animal Shelter had troublesome stories involving the shelters and/or prominent people affiliated with these organizations in recent years. Tyco Animal Control performed poorly due to this for profit company having a regressive view of animal sheltering. Shake a Paw-Union’s low local adoption numbers are not surprising since it also operates a for profit pet store. Monmouth SPCA and Montclair Township Animal Shelter transported in many dogs from outside of New Jersey during 2019 that reduced their ability to save local dogs.
While Homeward Bound Pet Adoption Center (formerly Camden County Animal Shelter) did not meet my adoption target, it came close. This shelter does offer fee waived adoptions of senior animals to people over 60 years old and free adoptions to those who served in the military. Additionally, the shelter has a pretty customer friendly adoption process.


Shelters Fail to Use Excess Space to Save Local Dogs
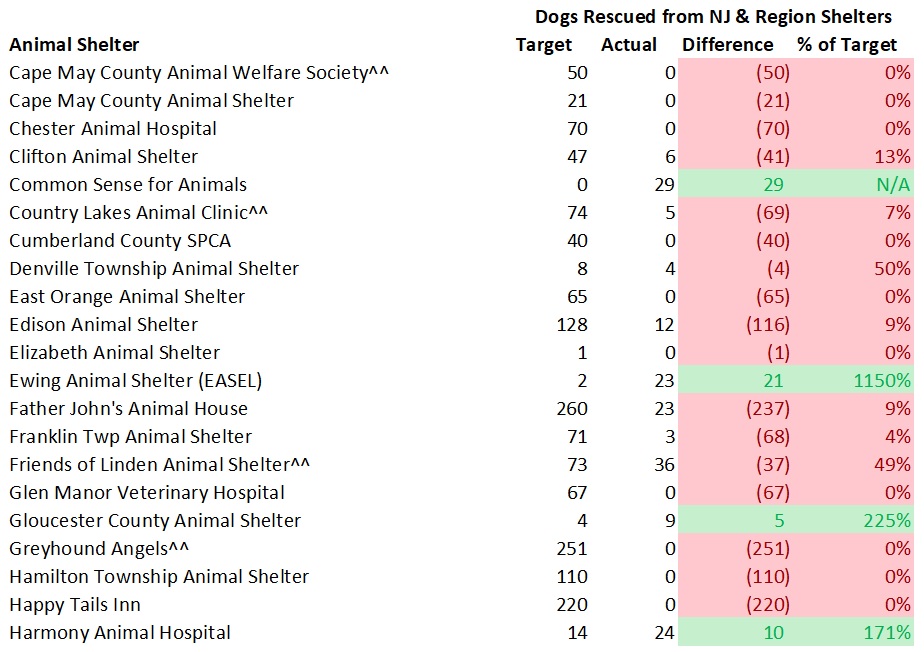
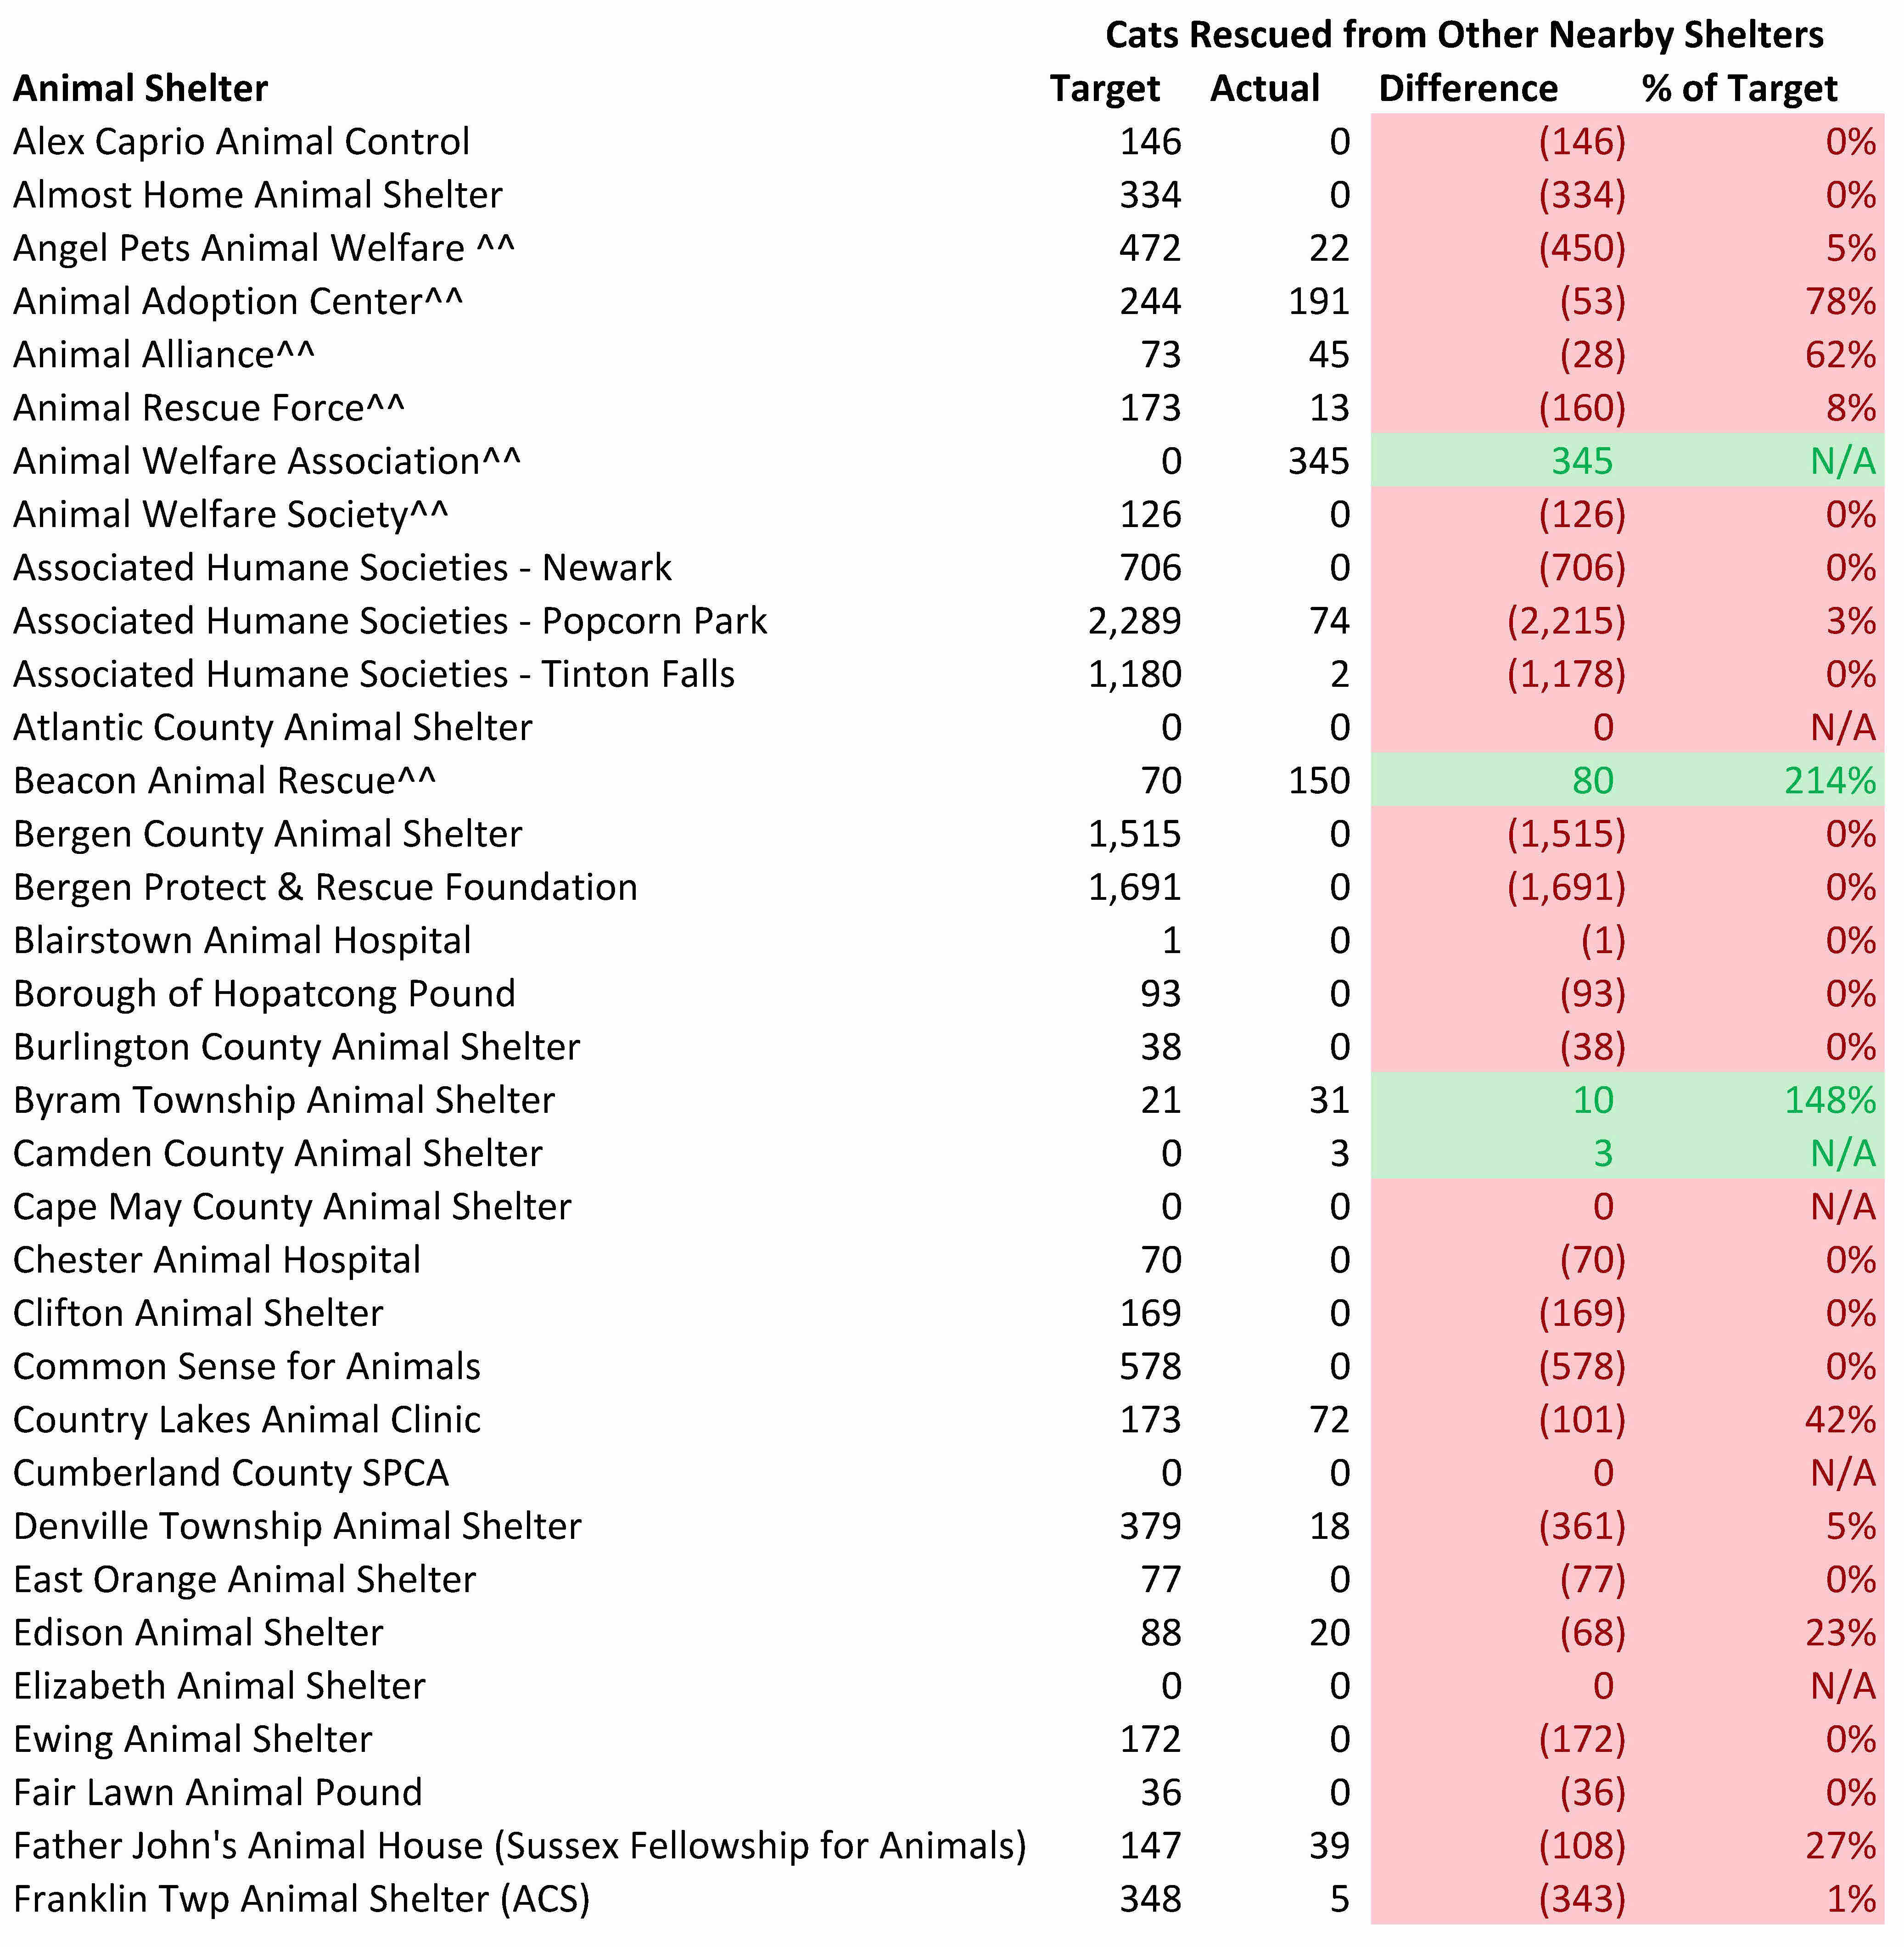
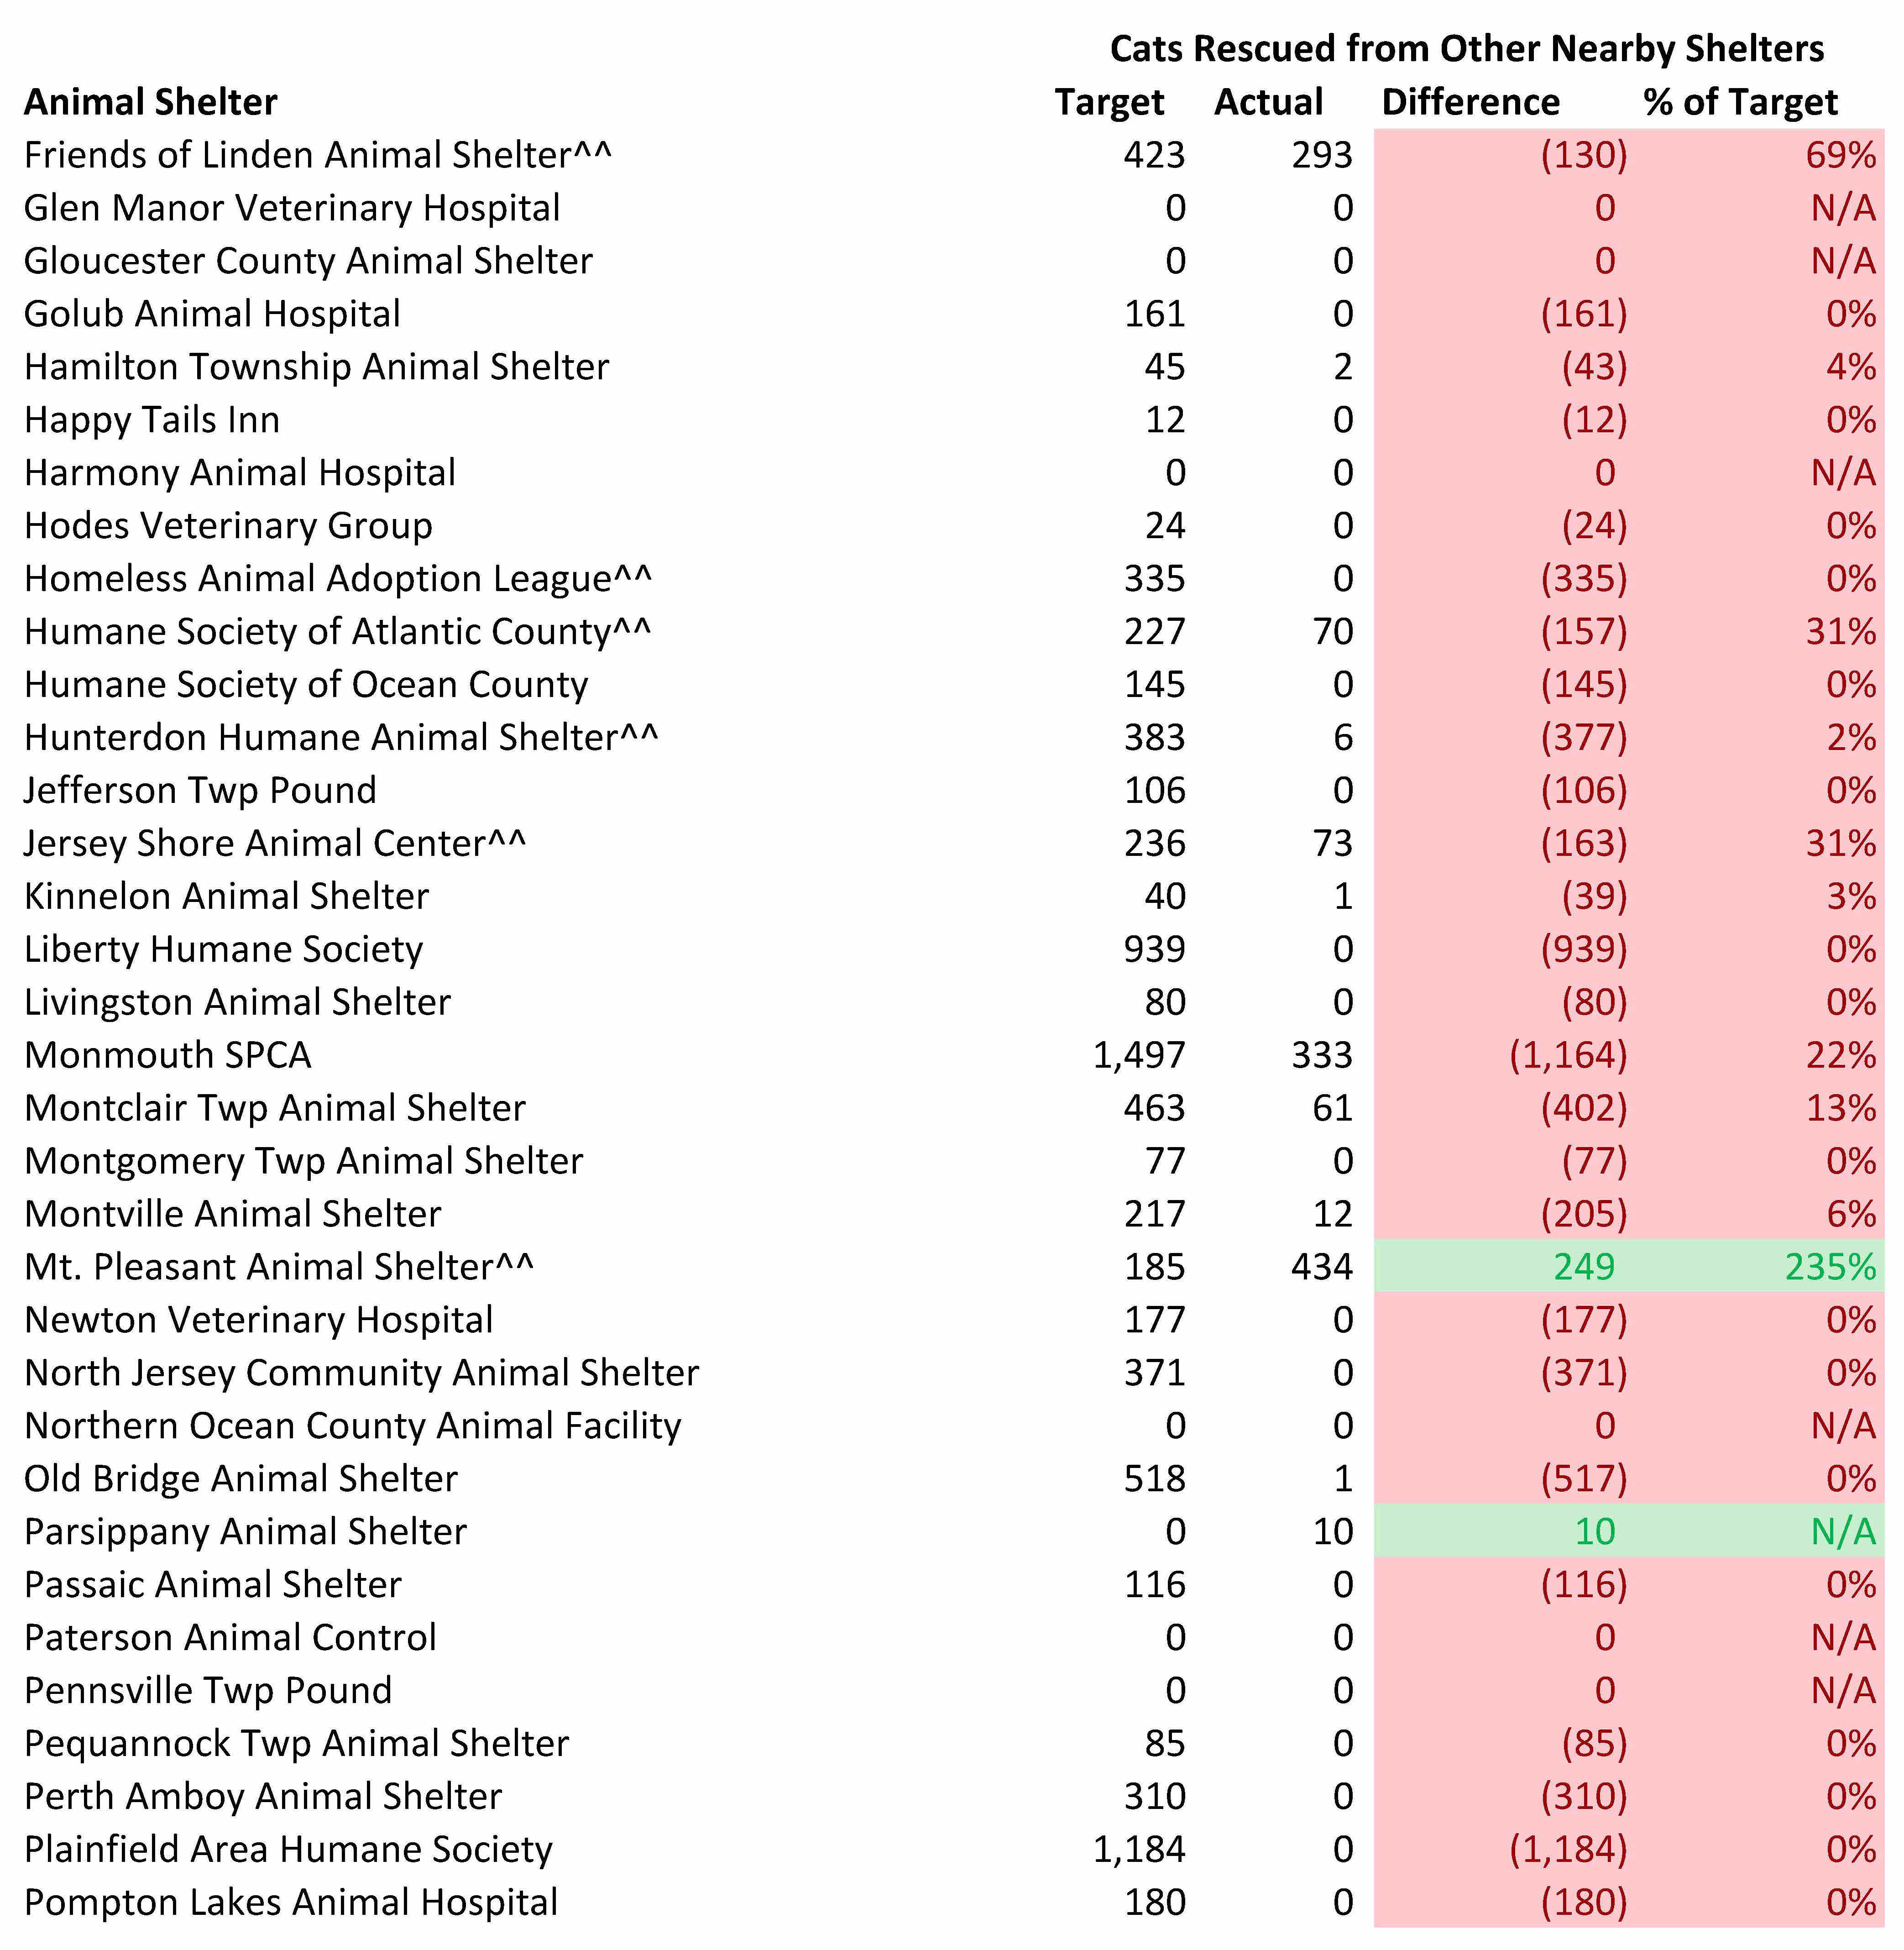
To further examine New Jersey animal shelters’ performance in saving the state’s homeless dogs, I compared the targeted number of dogs each shelter should pull from nearby shelters and compared it to the number actually rescued from local facilities. I assume all reported out of state rescued dogs came from southern states or other far away places. While some of the out of state rescued dogs may have comes from nearby areas, I believe this is a small number and does not significantly impact the results.
Virtually all New Jersey animal shelters are failing to rescue the number of local dogs they should. 90 of the 92 shelters should rescue some dogs from other local shelters. In fact, 43 of the 90 shelters with targeted excess capacity failed to rescue even a single dog from a New Jersey animal shelter. Of the 90 shelters that should have rescued dogs, only four shelters met or exceeded their local dog rescue targets. However, two of those shelters, Humane Society of Atlantic County and St. Hubert’s-Noah’s Ark, may not have truly helped the number of medium to large size local dogs they should based on these shelters taking easier to adopt animals and possibly out of state animals (i.e. St. Hubert’s-Noah’s Ark may have rescued out of state transported dogs from other St. Hubert’s facilities that originally came from the south).
As mentioned above, many shelters local rescue numbers are inflated due to these organizations cherry picking highly adoptable animals to rescue. Thus, nearly all New Jersey animal shelters with targeted excess capacity are failing to do their share in ending the killing of local healthy and treatable dogs.
Shelters can overcome challenges in rescuing dogs from outside their service area. In some cases, municipalities may frown on government run shelters using taxpayer funds to rescue dogs from elsewhere. However, shelter directors at these facilities can encourage individuals to form a non-profit or raise money on their own to pay for these rescued dogs. Additionally, shelters with limited capacity or even some of the well-off private shelters could contribute funding for each dog rescued. For example, Maddie’s Fund paid an approximate $160 subsidy to rescues pulling dogs from New York Animal Care & Control. Similarly, private shelters with excess space, but limited financial resources, could expand their fundraising efforts to save more local dogs. Thus, perceived obstacles to rescuing local dogs can and should be overcome.


New Jersey Animal Shelters Need to Form Life-Saving Coalitions
The improper allocation of space within the state’s animal shelter system requires organizations to form coalitions. While putting a competent and compassionate director in every shelter would likely be even more effective, that will likely take time to do. No kill coalitions between animal control facilities and selective admission shelters have been used in places, such as Portland, Oregon, Reno, Nevada, Jacksonville, Florida and Austin, Texas to radically increase life saving. Maddie’s Fund, which has supported using coalitions for over a decade, has many resources for organizations seeking to collaborate with each other. Thus, New Jersey animal shelters need to formally work together, develop quantifiable and measurable goals (such as the targeted outcomes in this blog), and hold each organization accountable for meeting these benchmarks.
Sobering Results Require Shelter Leaders to Critically Examine Themselves
Shelters should examine the reasons why their adoption numbers fall far short of these benchmarks. In some cases, shelters need to expand the hours they are open for adoptions. Many shelters should switch from an overly judgmental adoption process based on black and white rules to a conversational one focused on educating the adopter. Organizations will need to radically increase their off-site events and do same day adoptions. Similarly, many shelters must reduce adoption fees and run frequent promotions. Executive Directors should monitor the latest life-saving programs on Maddie’s Fund’s, American Pets Alive Conference’s, and the Best Friends National Conference’s web sites and put some of these policies into place. Shelter management teams will need to ensure their facilities are clean and customers are treated with respect (this can be measured by encouraging the public to complete surveys). Thus, poorly performing shelters need to stop making excuses and do what it takes to reach their adoption potential.
We can turn New Jersey, New York City and Philadelphia into no kill communities. It is time we give our money and volunteer efforts to organizations who raise their performance to help us reach that goal. To do otherwise, would betray all the animals whose lives are on the line.
Appendix – Life Saving Model Assumptions
The Life Saving Model utilizes the following basic animal shelter population equations to calculate the targeted dog outcomes for each facility:
Daily capacity or population = Daily animal intake x average length of stay
Average length of stay = Daily capacity or population/daily intake
Each shelter’s community dog intake (i.e. owner surrenders, strays, cruelty bite cases), number of dogs returned to owners, and maximum dog capacity were taken from its 2019 “Shelter/Pound Annual Report” submitted to the New Jersey Department of Health. Additionally, I added 3% of each shelter’s annual dog intake to account for foster capacity shelters should use based on American Pets Alive guidelines. Thus, total dog capacity equaled the shelter’s capacity plus foster capacity.
My model revised Tom’s River Animal Facility’s and Pennsville Township Pound’s community intake due to errors in their Shelter/Pound Annual Reports resulting in owner reclaims exceeding the beginning population plus 2019 community intake. Therefore, I increased the 2019 community intake to ensure the beginning population plus 2019 intake equaled the ending population.
Harmony Animal Hospital’s number of dogs returned to owners in community intake were reduced since the shelter had no beginning population or 2019 community intake. The model assumed these dogs were returned to the facilities the shelter rescued the animals from in 2019.
This data was then used as follows:
- Community dog intake and dogs returned to owners were initially estimated for each month by dividing the annual figures by 12. In order to take into account the extra space in low intake months and reduced space in high intake months, we multiply that number by each month’s percentage of the average month. For example, assume 240 dogs were taken in during the year and the average month equals 20 dogs (240/12). In July, the dog intake is 120% higher than the average month and we therefore multiply 20 dogs by 1.2 to equal 24 dogs. If 120 dogs were returned to owners during the year, the estimated number of dogs returned to owners in July would equal 12 dogs (120/12 = 10; 10*1.2). The monthly intake percentages were based off the average of the 2019 dog intake data on New York Animal Care & Control’s and ACCT Philly’s web sites.
- The estimated number of community dogs returned to owners each month are then assumed to stay 5 days on average at shelters based on data from other shelters across the country. If anything, this estimate is conservative (i.e. average length of stay for dogs returned to owners may be less than 5 days and therefore frees up more shelter space for adoptions) based on some shelters returning the bulk of their dogs to owners within 3 days.
- The number of community dogs euthanized (including animals who died or are missing) is set to equal 5% of intake. 5% is a reasonable standard euthanasia rate for shelters in New Jersey to meet given few vulnerable stray puppies (i.e. who could die or require euthanasia) arrive in the state’s animal shelters. The average length of stay for euthanized dogs is assumed to equal 14.5 days. Half of dogs are assumed euthanized for untreatable aggression towards people and 21 days is the time estimated to make that determination. The other half of dogs are assumed euthanized for severe and untreatable health issues and I estimate these dogs are euthanized after 8 days (subsequent to the end of the stray hold and owner surrender protection periods).
- Adopted dogs are assumed to stay at shelters for varying lengths of time. Adoption length of stay was based on data from a study in the Journal of Applied Animal Welfare and the figures used (except for space-constrained shelters) are located in a prior blog on pit bull adoption. The data primarily comes from Tompkins County SPCA during a time it saved over 90% of its dogs. This was a fairly conservative data set to use as other no kill open admission shelters’ average length of stay are substantially shorter. Specifically, the following assumptions were made:
- 80% and 20% of each communities dogs (including pit bulls) were adults 1 year and older and under 1 year.
- Pit bulls were assumed to comprise 50%, 35% and 25% of community dog intake at poor, middle/upper middle class, and wealthy area animal control shelters. While some shelters may have pit bulls comprising more than 50% of their shelter dog population at a given time, this is due to pit bulls longer average length of stay. For example, a shelter with pit bulls making up 50% of their dog intake and pit bulls having an average length of stay three times longer than other dogs will have pit bulls constituting 75% of the dog population. Shelters without animal control contracts were assumed to only have pit bulls make up 10% of their community dogs (i.e. strays and owner surrenders) based on most of these shelters’ highly selective admission practices.
- Pit bull adoption length of stay was taken directly from the Journal of Applied Animal Welfare study. The average adoption lengths of stay for other breeds from this study were averaged and used for dogs other than pit bulls in the analysis
- Space constrained shelters were assumed to adopt out their easiest to adopt animals first until they ran out of space. To estimate the average adoption length of stay, I used pit bull adoption length of stay data from Greenhill Humane Society from March 2013 through May 2015. I broke the adoption length of stay data into 5 groups that each made up 20% of the data. The average adoption length of stay for each of these 5 groups was calculated. The average adoption length of stay of each group was divided by the average length of stay for all of the adopted pit bulls in the Greenhill Humane Society data set. Those percentages were then multiplied by the average dog adoption length of stay determined in the previous bullet and used to determine the adoption lengths of stay used for space-constrained shelters.
- Dogs transferred to rescue or other facilities are assumed to stay at shelters 8 days on average based on the assumption strays can’t be released until the 7 day hold period elapses.
- Community dogs not returned to owners or euthanized are initially assumed as adopted for each month. However, if the calculated length of stay exceeds the shelter’s required length of stay, dogs are moved from adoption (i.e. longer length of stay) to rescue (i.e. shorter length of stay) until the calculated length of stay each month approximately equals the required length of stay.
- Animal control shelters have a minimum of 10% of unclaimed dogs go to rescues. To the extent shelters transfer 10% of unclaimed dogs to rescues despite having space (i.e. reclassifying dogs from adoptions with a longer length of stay to rescues with a shorter length of stay), I do not require these facilities to use that space to rescue additional dogs.
- Required length of stay = Shelter’s total capacity/adjusted daily intake for the month. Adjusted daily intake for month = Adjusted monthly intake per first bullet above/the number of days in the month.
- Shelters with excess capacity are assumed to use the extra space to rescue and adopt out dogs from other New Jersey animal shelters. To the extent all healthy and treatable New Jersey animal shelter dogs are saved, I assume additional dogs are pulled from nearby states with similar types of dogs. The model assumes shelters adopt out 99% of rescued dogs and euthanize 1% of them. Based on pit bull type dogs having longer lengths of stay at shelters, I assume 80% of dogs rescued from local animal shelters are pit bulls and 20% are non-pit bulls. 80% and 20% of pit bull and non-pit bull type dogs are considered 1 year and older and under 1 year. The average length of stay for rescued pit bulls and other dogs are the same as the adoption length of stay figures above. Due to immateriality, I assumed the dogs rescued and euthanized stayed at the shelter the same amount of time as the dogs adopted out.
- Each month’s targeted outcomes are added to determine how many local dogs New Jersey animal shelters should adopt out, send to rescue, rescue from other nearby animal shelters and euthanize.
- The targeted number of dogs rescued and adopted were capped at 2 pit bulls per 1,000 people in each county. If the model yielded a higher result than this cap, the targeted numbers of dogs adopted were set to equal to this cap using the pit bull percentage assumptions above. For shelters in these counties (except Passaic County), I calculated the cap at the county level and then reduced the number of dogs adopted for the county to equal the cap. I excluded West Milford from Passaic County due the town’s large distance from the population centers in the rest of the county. Each shelter’s percentage of total targeted adoptions in the county from the unmodified model were applied to the the total reduction in the number of adoptions in the county to yield the targeted numbers of dogs adopted in the modified model. If the shelter also rescued animals from other shelters, the rescued numbers were also reduced since I assume rescued animals are adopted.