January 21, 2022 Update: Subsequent to my original analysis, St. Hubert’s-Madison submitted its statistics to the New Jersey Department of Health and the state health department revised its summary report on the state animals shelters‘ statistics.As a result, I updated this blog for the St. Hubert’s-Madison data.
Recently, I wrote a blog discussing decreased killing at New Jersey animal shelters in 2020. This blog will explore the 2020 statistics in more detail and assess the current status of the state’s animal shelters.
Most New Jersey animal shelters voluntarily report detailed data to state authorities. Earlier this year, I shared the 2020 summary statistics for New Jersey animal shelters on my Facebook page. Each year, the New Jersey Department of Health requests each licensed animal shelter in the state to submit animal shelter data for the previous year. Animal shelters voluntarily submit this data in the “Shelter/Pound Annual Report.” The New Jersey Department of Health takes these Shelter/Pound Annual Reports and compiles the number of dogs, cats and other animals impounded, redeemed, adopted and euthanized to prepare its Animal Intake and Disposition report. However, the Shelter/Pound Annual Reports include additional information on how animals were impounded (i.e. strays, owner surrenders, rescued from in-state facilities, rescued from out of state shelters, and cruelty/bite cases/other) and disposed of (i.e. returned to owner, adopted, sent to rescue/another shelter, and died/missing/other outcome). Additionally, the Shelter/Pound Annual Reports include the number of animals in shelters at the beginning and end of the year as well as the maximum number of animals facilities can hold. Thus, the Shelter/Pound Annual Reports include very important data not found in the New Jersey Department of Health’s summary report.
I compiled the data from these reports and analyze the results in this blog. 2020 statistics for each New Jersey animal shelter are listed at this link. You can also view each “Shelter/Pound Annual Report” at this link.
Garbage Data Raises Serious Questions About New Jersey Animal Shelters’ Statistics
Most New Jersey animal shelters do not properly account for their animals. Simple math dictates the number of animals at a facility at the beginning of the year, plus all animals coming in during the year, less all animals leaving for the period, should equal the number of animals a shelter has at the end of the year. Stunningly, 36 out of 66 shelters reporting these dog statistics and 42 out of 65 facilities submitting this cat data failed to get this right. This raises serious questions about the accuracy of these shelters’ reported statistics. 24 of the 36 shelters with flawed dog statistics and 23 of the 42 facilities with incorrect cat statistics should have had more animals at the end of the year than reported. While these errors could have been due to incorrect counts of the number of animals at facilities, these shelters may have not recorded outcomes, such as animals who were killed, died, or went missing. To put it another way, 1,302 cats and dogs should have had outcomes reported and did not. Thus, there is the potential that as many as 1,302 additional dogs and cats were killed, died or went missing from New Jersey animal shelters than were reported in 2020.
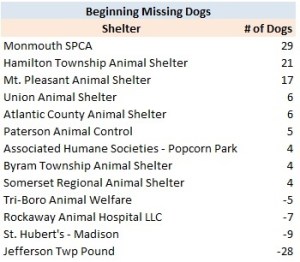
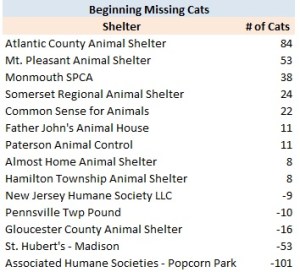
Even worse, a number of animal shelters reported having a different number of animals at the end of 2019 and at the beginning of 2020. Obviously, shelters should report the same number of animals at the end of the prior year and the start of the current year. However, 33 of 65 shelters reported different numbers of dogs at the end of 2019 and the beginning of 2020. Similarly, 29 of 63 shelters reported different numbers of cats at the end of 2019 and the beginning of 2020. The worst offenders are listed in the tables below:
Shelters may have failed to classify animals adopted out and sent to rescues properly. Both Paterson Animal Control and Elizabeth Animal Shelter reported no animals were sent to rescues and all dogs and cats leaving their facilities alive were owner reclaims or adoptions. However, intake and disposition records I reviewed at both of these shelters in recent years revealed almost all “adopted” animals are actually rescued. One has to wonder how many other facilities failed to properly classify adoptions and rescues properly. This data is very important as it provides details on the burden rescues and other shelters are taking on from these facilities.
We need better oversight of New Jersey animal shelters’ data reporting. Currently, these statistics are voluntarily reported and most shelters are not taking this seriously. For example, I noticed a large number of reports were submitted many months after the end of the year. This data should be easy to compile since facilities can utilize animal shelter software programs, some of which are free, to do this task. Furthermore, New Jersey animal shelter laws mandate facilities maintain much of the raw data found in the Shelter/Pound Annual Report. Unfortunately, New Jersey Department of Health inspections routinely find shelters do not properly keep records on animals. We need to make the data reporting mandatory for animal shelters as the shelter reform bill, S636, does along with serious penalties for significant errors (especially if deliberate). In order for animal shelters to take data reporting seriously, we may also need to require audits of these reports. Thus, these results show we need stronger laws and the New Jersey Department of Health to play a greater role in ensuring reported animal shelter statistics are in fact accurate.
Despite the errors in these reports, the data provided still reveals important information.
More Animals Losing Their Lives in New Jersey Animal Shelters Than Disclosed in Summary Report
The more detailed data in the Shelter/Pound Annual Reports allows one to more critically examine the percentage of locally impounded animals dying in New Jersey’s animal shelters. The following table summarizes my analysis of the kill rates calculated from the New Jersey Department of Health’s summary report and the data reported in the Shelter/Pound Annual Reports.
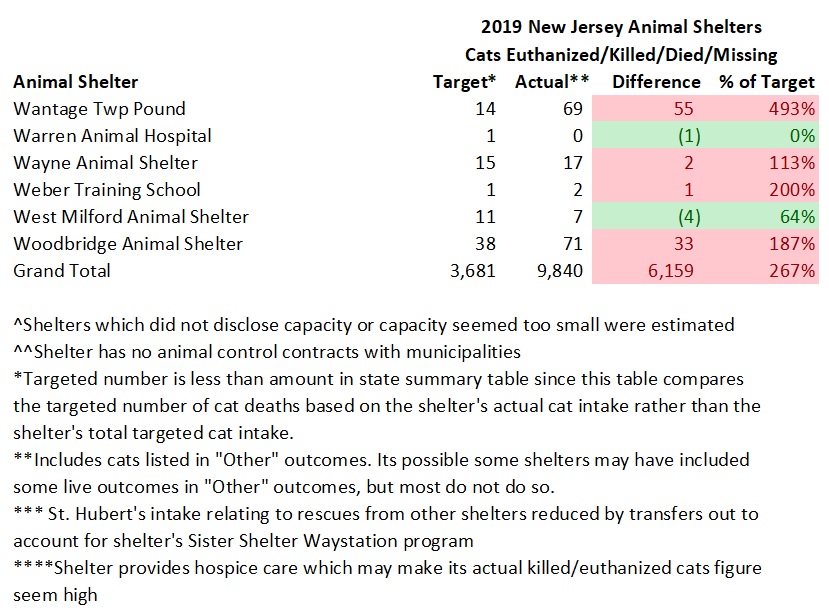
The statistics include an estimate to remove animals St. Hubert’s transfers in and quickly transfers out through its Sister Shelter WayStation program. Since St. Hubert’s is effectively acting as a middle man and not holding these animals very long, it makes sense to exclude these dogs and cats from the various kill rate statistics. If I did not exclude these animals, I would understate the dog and cat kill rates due to inflated intakes and outcomes numbers. Therefore, I removed all of St. Hubert’s dogs transferred out from the intake and outcomes figures in the metrics. Since St. Hubert’s primarily uses the Sister Shelter Waystation program to quickly transfer in cats and send them to out of state facilities, I only backed out the cats St. Hubert’s transferred to out of state organizations in the various kill rates. The dog kill rate (intake) increased from 3.6% to 4.1% and the cat kill rate (intake) remained at 9.8%.
The Animal Intake and Disposition report prepared by the New Jersey Department of Health only allows one to calculate the number of animals killed as a percentage of total animals impounded (i.e. intake). I prefer calculating the kill rate as a percentage of outcomes rather than intake as this metric directly compares positive and negative outcomes. Using intake may depress the kill rate since shelters can simply hold animals for a long time to the point of overcrowding. Calculating the kill rate based on outcomes rather than intake caused the dog kill rate to decrease from 4.1 to 4.0% and the cat kill rate to decrease from 9.8% to 9.7%. This decrease was due to outcomes exceeding intakes.
To calculate the statewide kill rate, we must also back out transfers from one New Jersey animal shelter to another state facility to avoid counting animals still in the state’s shelter system or registering two outcomes for the same animal (i.e. one New Jersey animal shelter transfers a dog or cat to another state facility which then adopts out the animal). This adjustment increased the dog kill rate from 4.0% to 4.3% and the cat kill rate from 9.7% to 10.7%.
In addition, we should increase the kill rate for animals who died or went missing in shelters. In the past, I’ve labeled this metric the death rate as these animals are likely dead or in a very bad situation. Unfortunately, the Shelter/Pound Annual Report includes animals who died or went missing in the “Other” outcome category. The “Other” category contains positive live releases, such as TNR for cats, at a few shelters. While including the “Other” category in the death rate for most shelters is appropriate (i.e. those facilities that don’t do TNR or don’t include cats released through TNR programs in “Other” outcomes), I’m no longer doing this due to an increasing number of shelters implementing TNR. Instead, I calculated the kill rate by subtracting out “Other” outcomes from total outcomes. If a shelter specifies the number of animals included in “Other” that left the shelter alive, I count this as “Other Live Release” and do not back these amounts out of total outcomes. After making this adjustment, the dog kill rate remained at 4.3% and the cat kill rate increased from 10.7% to 11.4%. For those interested in seeing the estimated death rates, you can find them in the supporting spreadsheet.
Also, many shelters transport easy to adopt animals from out of state which artificially increases live release rates. To properly calculate the percentage of New Jersey animals losing their lives, we need to adjust for transports. Unfortunately, shelters don’t break out their kill rates by local and out of state animals. However, most likely nearly all of the out of state animals (primarily puppies and easy to adopt dogs and cats) make it out of shelters alive. Therefore, I back out the number of out of state transports from total outcomes to estimate the local kill rate. This adjustment increases the New Jersey dog kill rate from 4.3% to 5.7% and the state’s cat kill rate from 11.4% to 11.6%.
Also, I estimate a maximum local kill rate by including the number of unaccounted for animals described in the section above. Making this adjustment increases the New Jersey dog kill rate from 5.7% to 10.3% and the state cat kill rate from 11.6% to 14.3%.
Some animal shelters quickly return large percentages of their animals to owners. At these shelters, the populations served are typically well-off and animals are licensed and have microchips. To account for the animals facilities actually have to shelter, I calculated a kill rate for non-reclaimed animals and a maximum potential kill rate for non-reclaimed local animals. The non-reclaimed kill rate and maximum potential kill rate for dogs is 6.2% and 18.0%. Non-reclaimed cats had a 12.2% kill rate and a 15.3% maximum potential kill rate. Thus, the percentage of New Jersey animals losing their lives in our state’s animal shelters may be much higher than the state summary report suggests.
Many Animals Killed Despite Low Statewide Death Rates
The goal of any properly managed animal shelter is to save all of its healthy and treatable animals. In some cases, such as selective admission rescue oriented shelters, it is pretty easy to not kill animals. In addition, other animal shelters with easy to service animal control contracts (i.e. few animals impounded, most strays quickly returned to owners) can avoid unnecessary killing due to having lots of extra space. As a result, some shelters may have an easier time than others in preventing killing at their shelters.
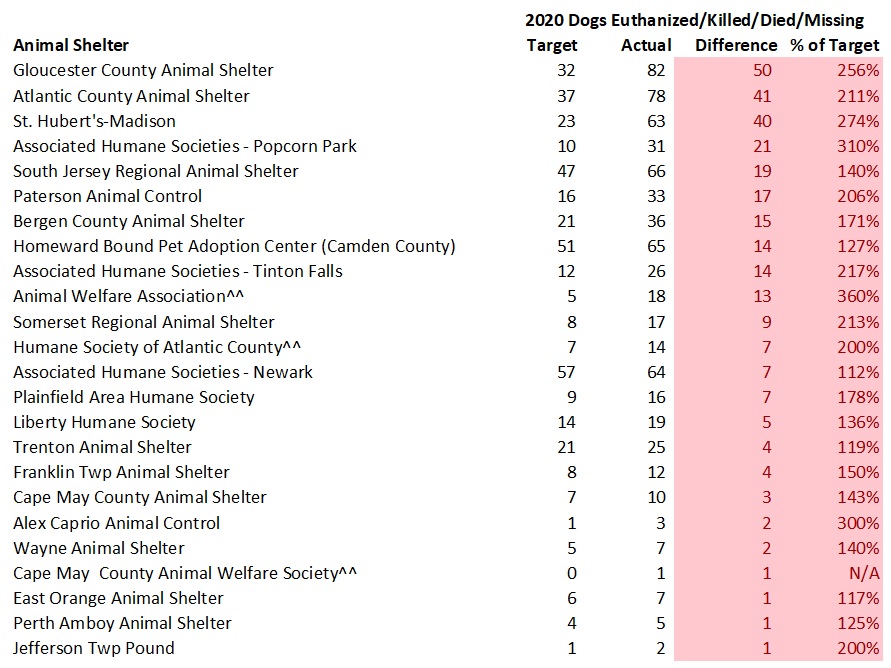
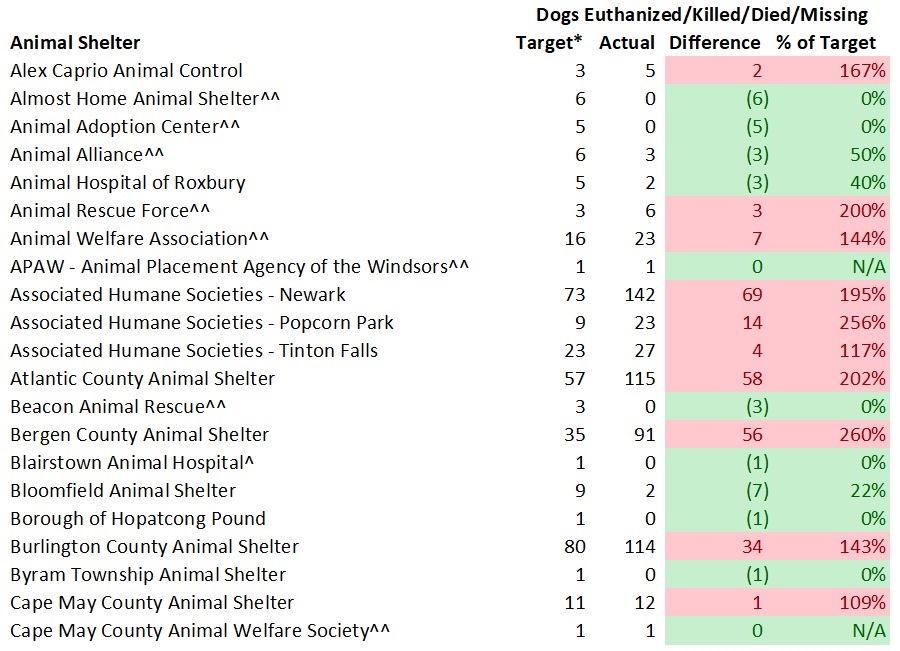
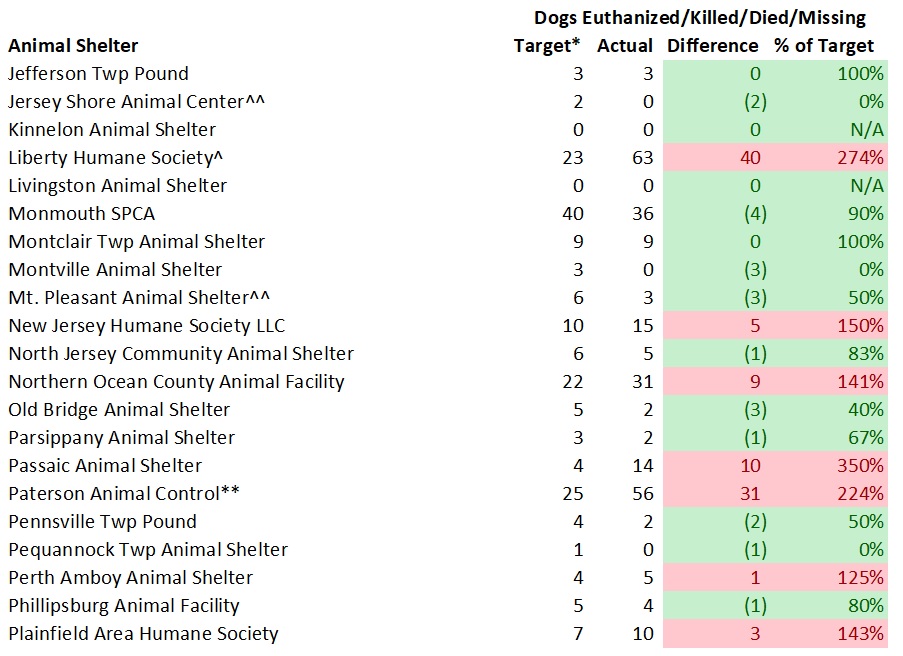
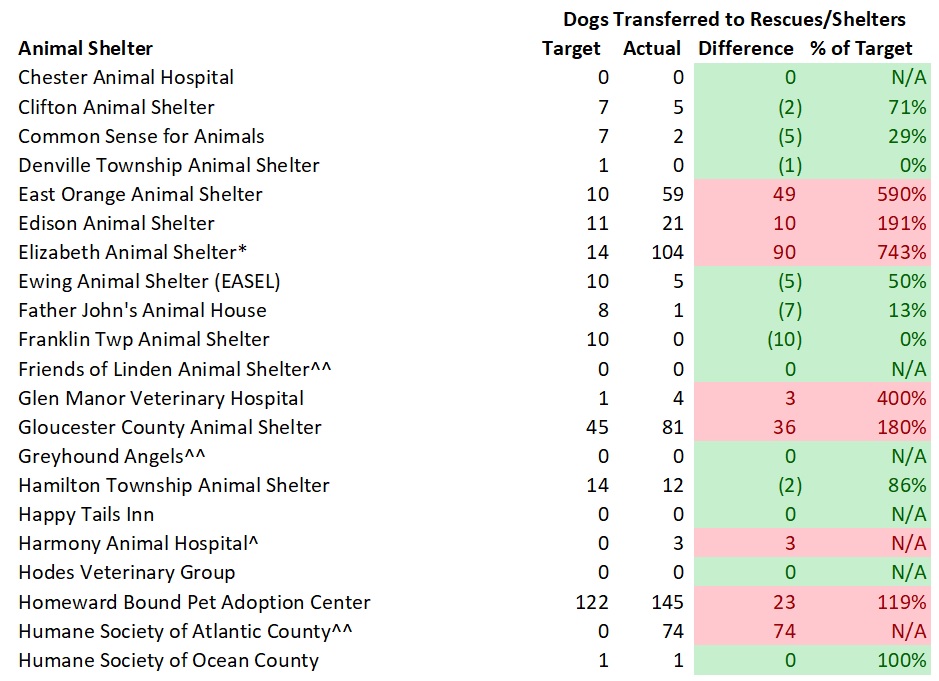
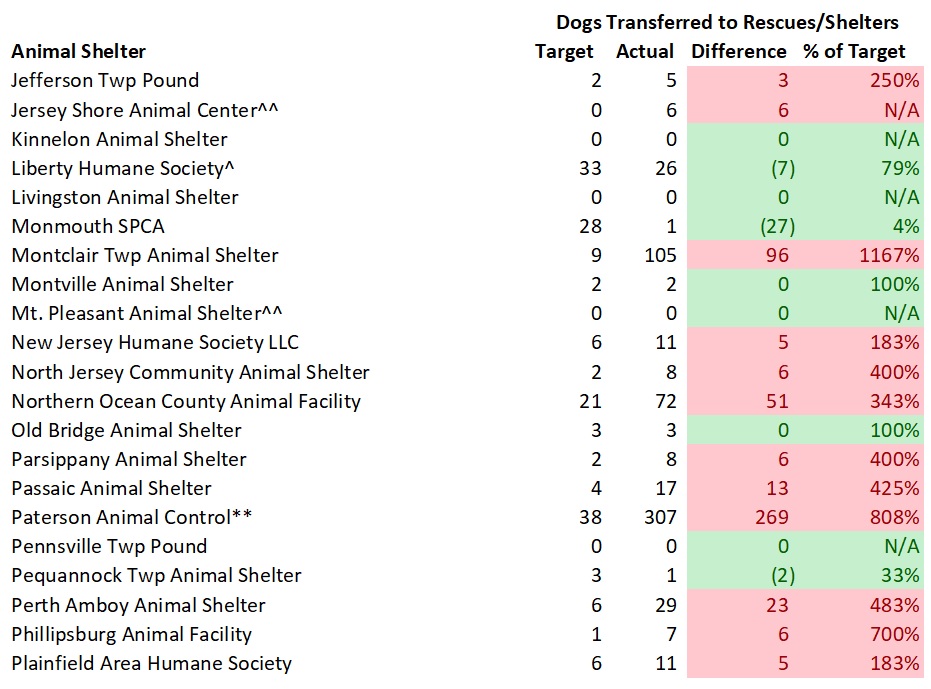
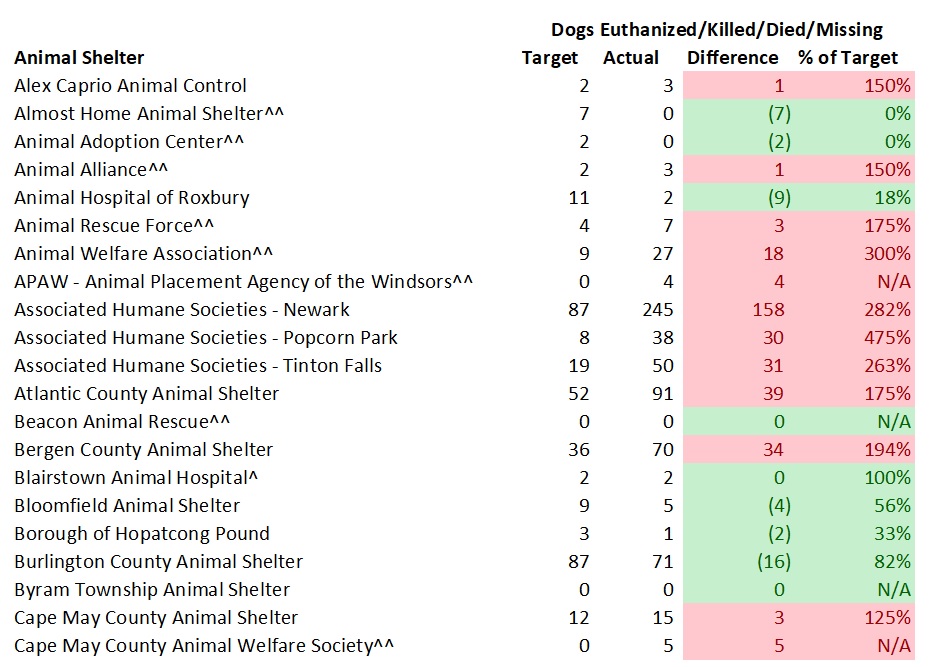
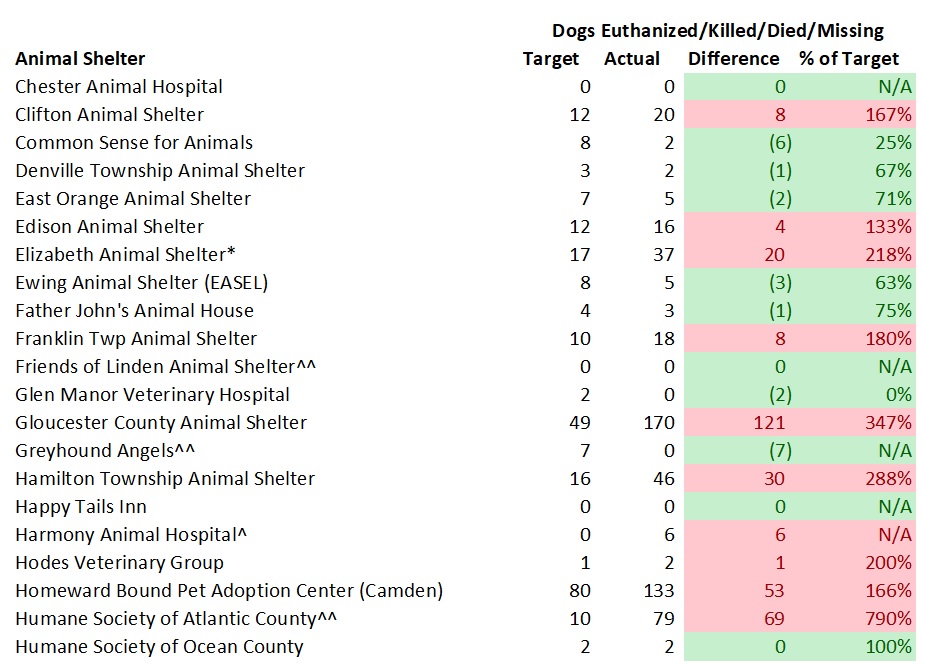
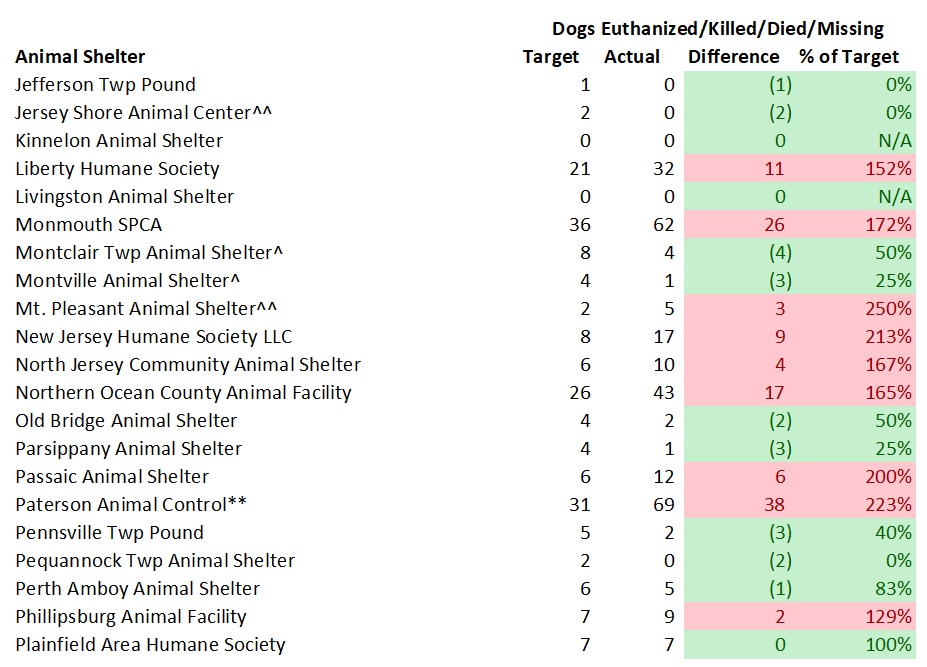
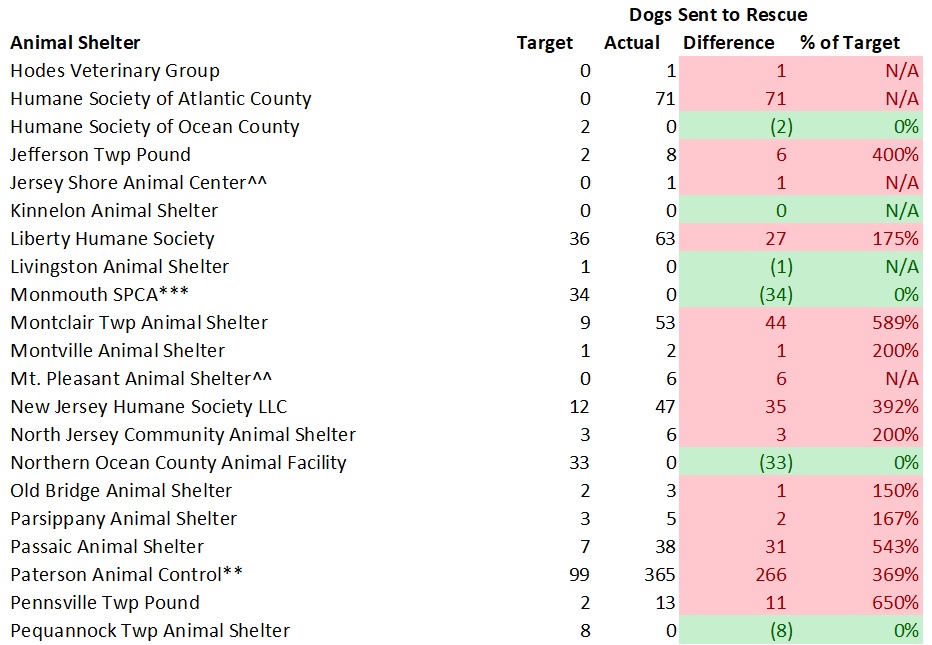
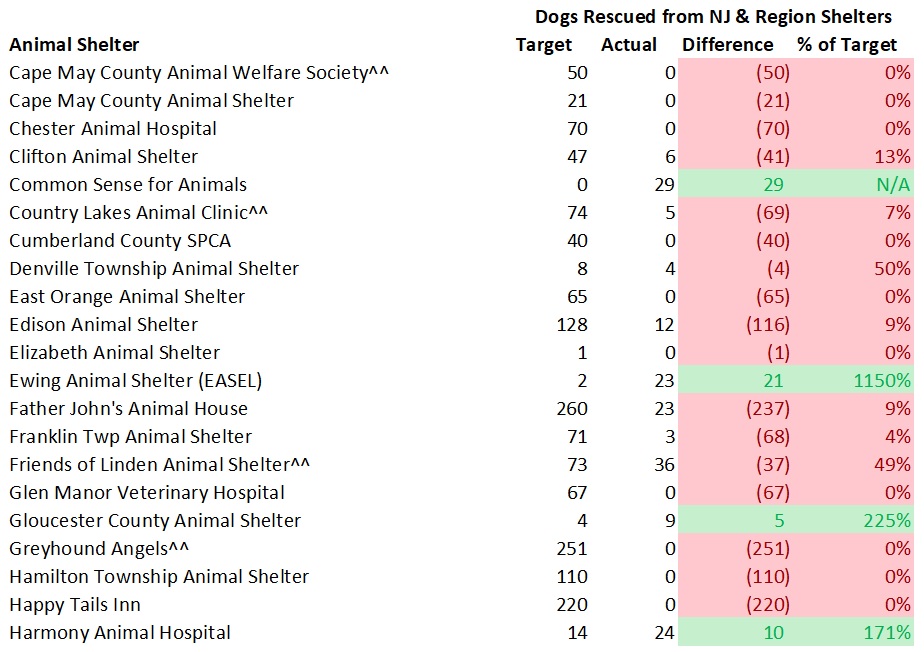
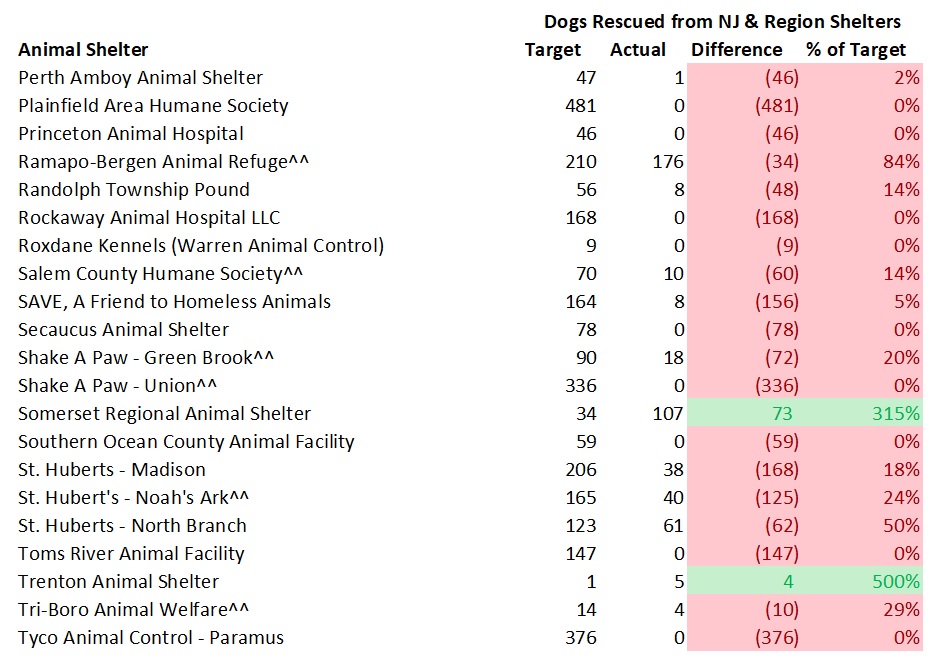
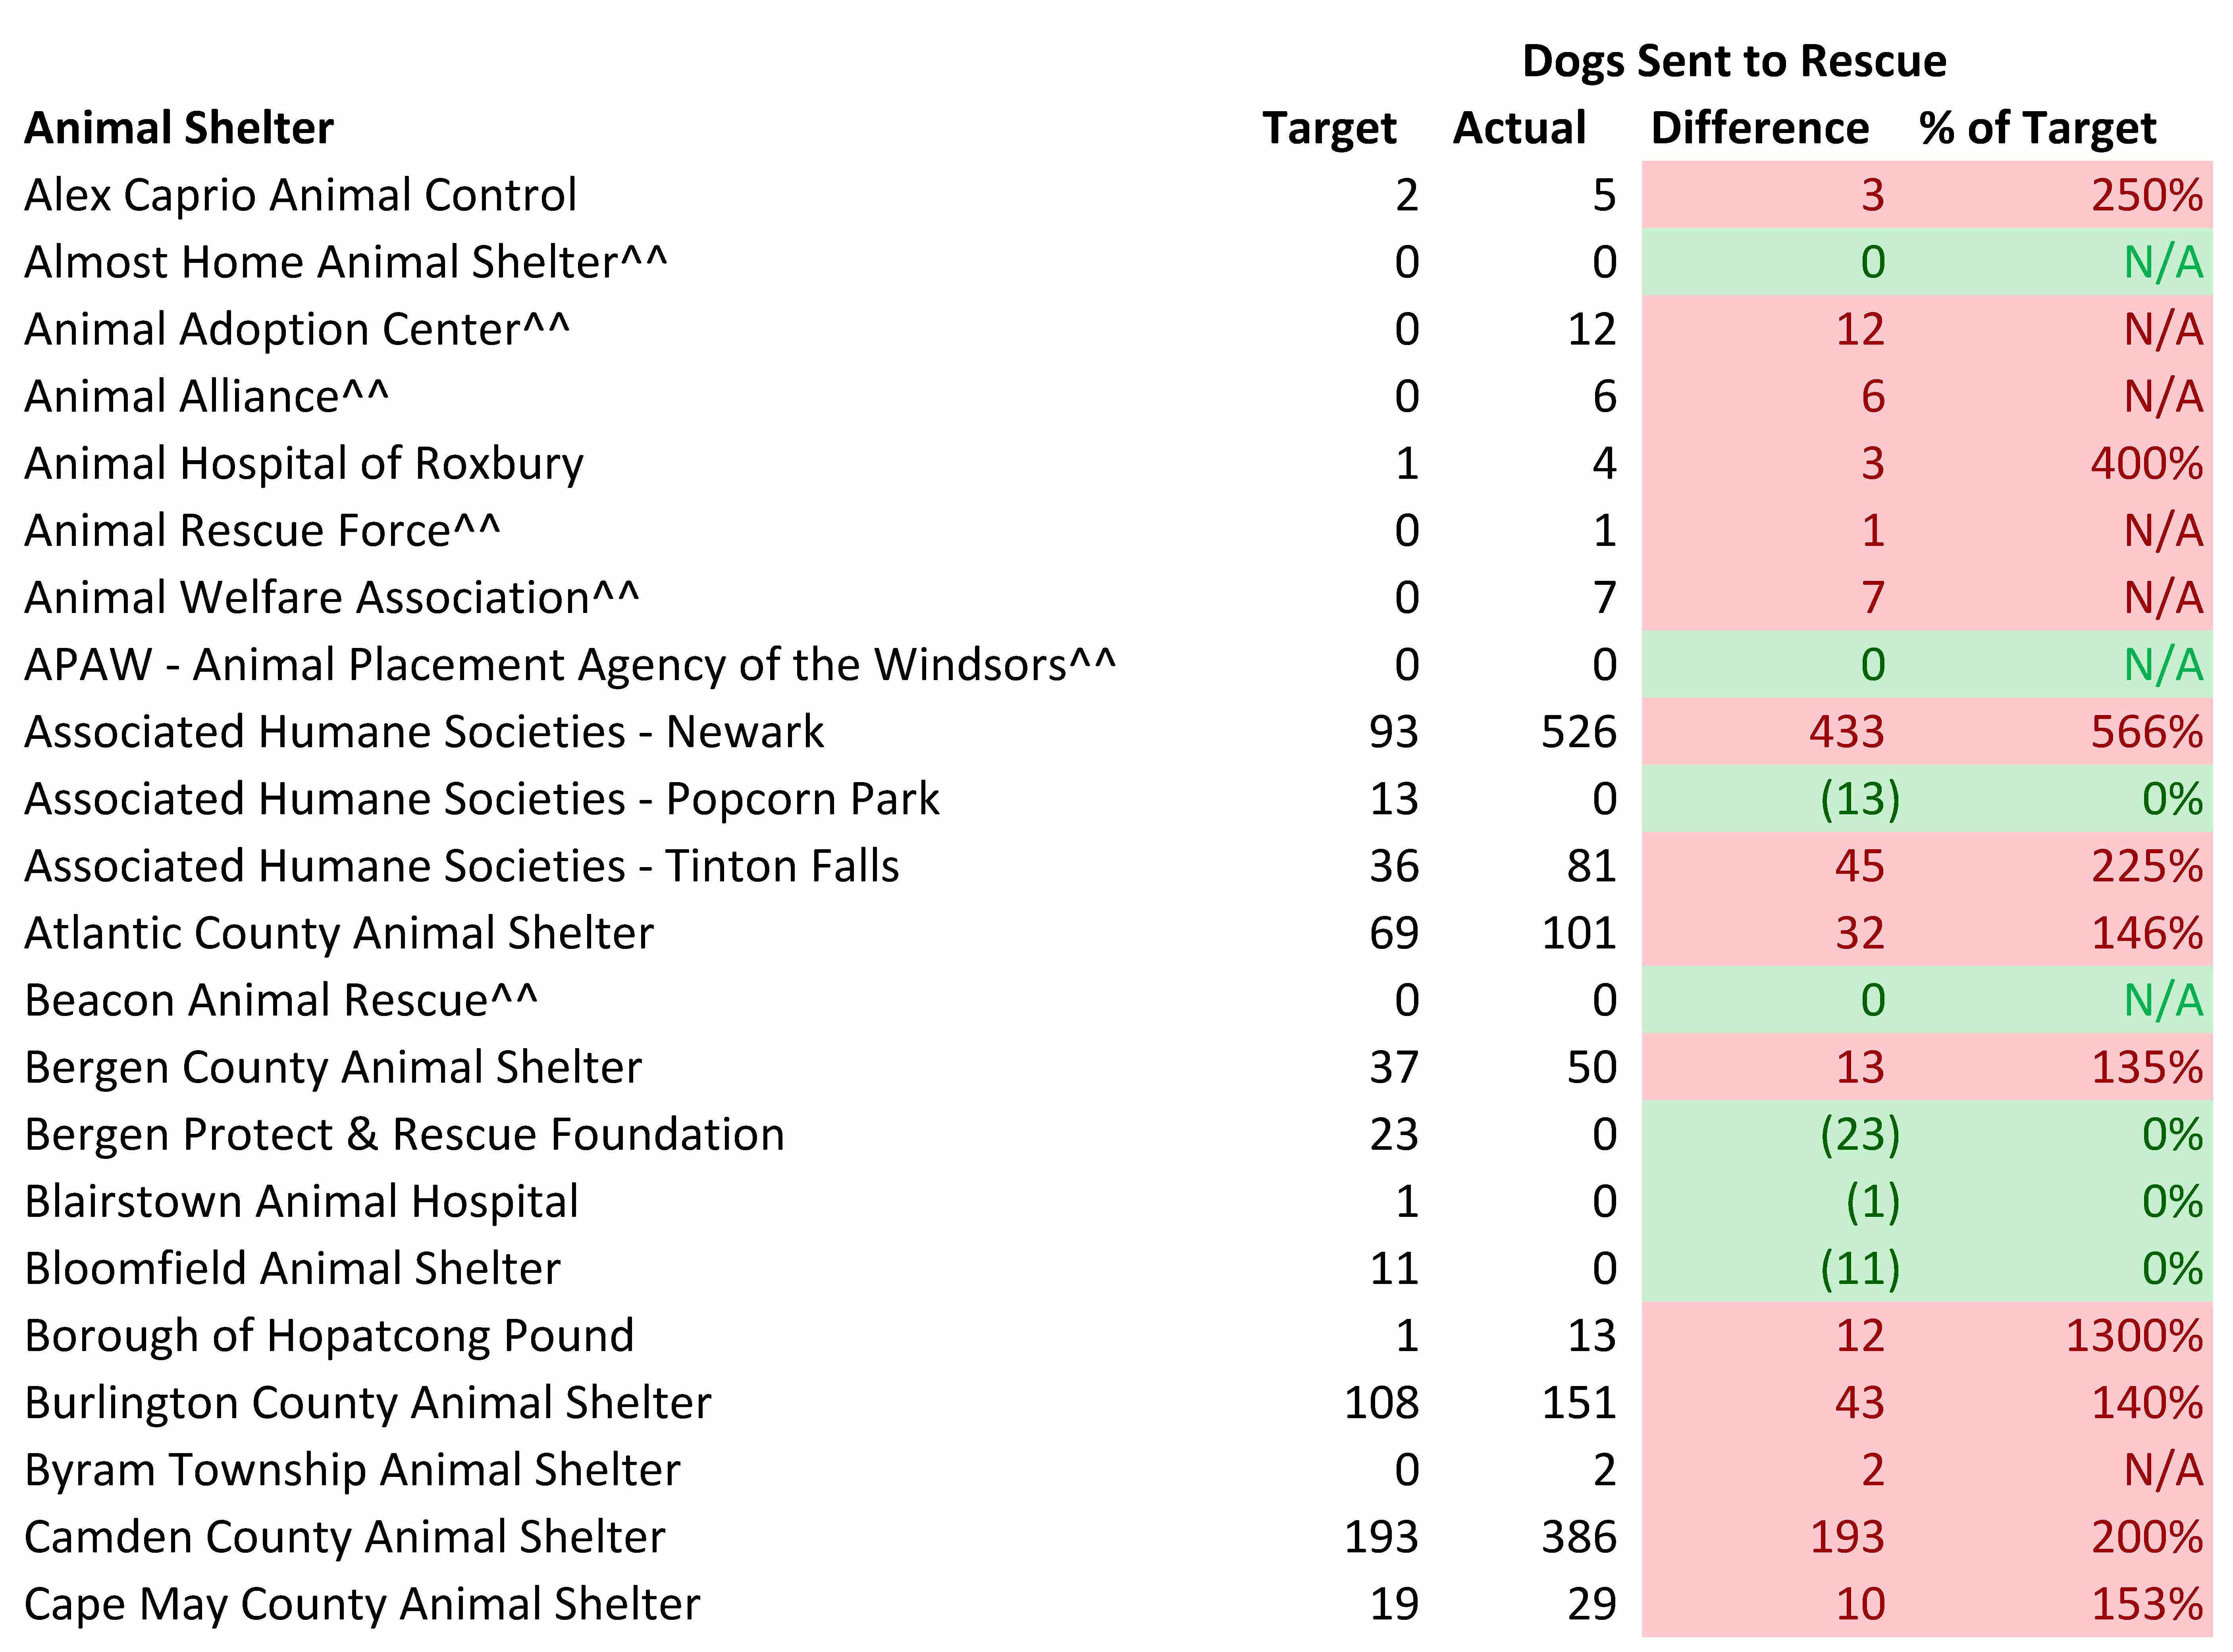
The tables below detail how many dogs should lose their lives at each state animal shelter per my model and the actual numbers of dogs that did. The model’s targets have shelters euthanizing 5% of community dogs (strays, owner surrenders, cruelty/bite cases, etc.) and 1% of dogs rescued from other shelters. All missing or lost dogs are assumed “dead” based on the assumption they died or went to a very bad place. Based on my review of a number of shelters’ underlying documents, virtually all of the dogs in the “Other” outcome category died or went missing. Shelters having the number of dogs losing their lives at or below my targets and above my targets are highlighted in green and red in the tables below.
The largest number of dogs unnecessarily dying occurred at a relatively small number of shelters. Overall, 301 dogs needlessly lost their lives at New Jersey animal shelters in 2020 (i.e. the sum of all shelters killing too many dogs). 10 out of 67 or 15% of the shelters accounted for 81% of the dogs unnecessarily losing their lives under the model’s assumptions. Thus, the bulk of the dogs unnecessarily dying at New Jersey animals shelters occurs at a small number of facilities.
If I use a stricter standard of shelters only having 2% of local dogs losing their lives (which a number of higher volume no kill animal control shelters in other places have achieved), the state’s shelters needlessly killed 555 dogs in 2020.
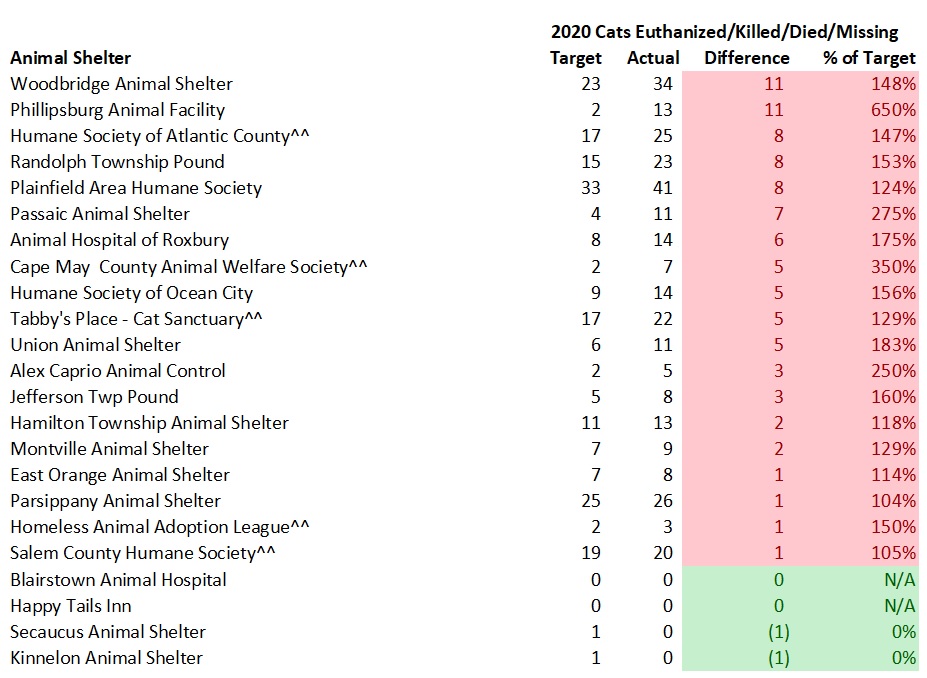
The tables below detail how many cats should lose their lives at each state animal shelter per my model (8% of strays, owner surrenders and other local cats and 5% of cats rescued from other shelters) and the actual numbers of cats that did. All missing or lost cats are assumed “dead” based on the assumption they died or went to a very bad place. Based on my review of a number of shelters’ underlying documents, virtually all of the cats in the “Other” outcome category died or went missing. While a small numbers of shelters could have included some live releases in the “Other” outcome category, it would be misleading to not count these deaths for the overwhelming majority of shelters. Shelters having the number of cats losing their lives at or below my targets and above my targets are highlighted in green and red in the tables below.
The largest number of cats unnecessarily dying occurred at a relatively small number of shelters. Overall, 3,105 cats needlessly lost their lives at New Jersey animal shelters in 2020 (i.e. the sum of all shelters killing too many cats). 10 out of 65 or 15% of the shelters accounted for 86% of the cats unnecessarily losing their lives under the model’s assumptions. Thus, almost all of the cats unnecessarily dying at New Jersey animals shelters happens at a small number of facilities.
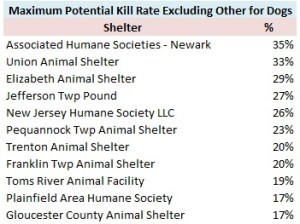
Kill Rates Extremely High at a Number of New Jersey Animal Shelters
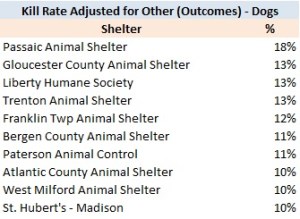
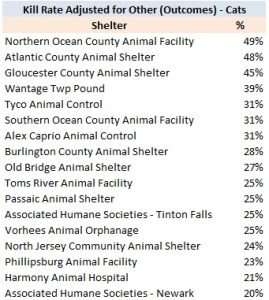
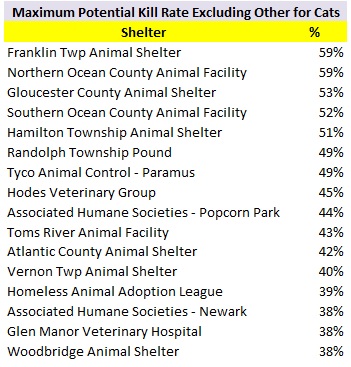
Dogs and cats are likely to lose their lives at a number of New Jersey animal shelters. Shelters with the highest kill rates for dogs and cats (excluding very low intake facilities) are listed in the following tables:
Thus, both dogs and cats have a very good chance of leaving many New Jersey animal shelters dead rather than alive.
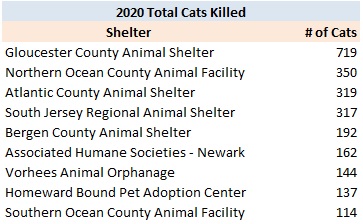
In terms of raw numbers, the following shelters killed the most animals:
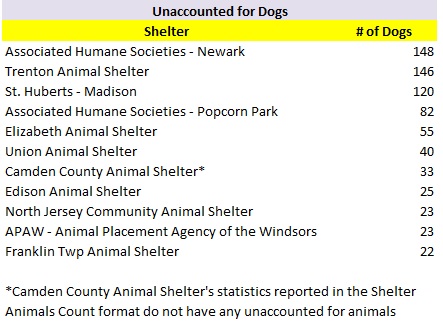
Many shelters fail to account for large numbers of their animals. As discussed above, a shelter’s number of animals at the end of the year should be calculated as follows:
Beginning number of animals + animals impounded – animals leaving the shelter
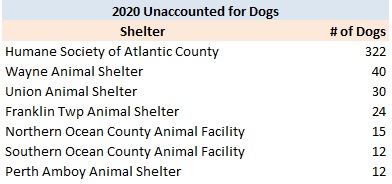
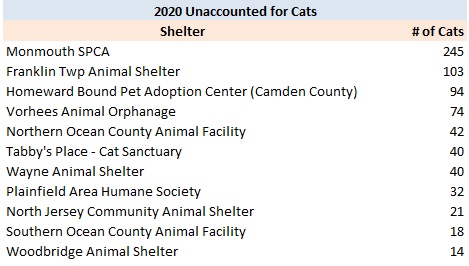
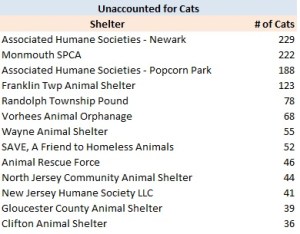
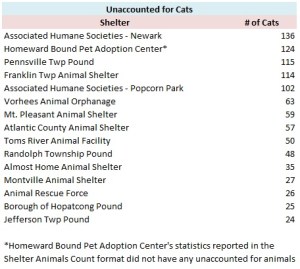
Unfortunately, a large number of shelters take in far more animals than they can explain where they went. Shelters having the highest numbers of unaccounted for dogs and cats are listed in the following tables:
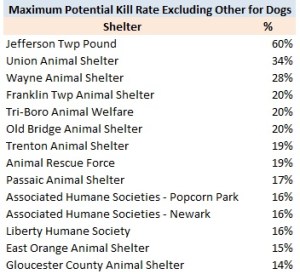
Dog and cat kill rates at many shelters may be even higher if these unaccounted for animals are counted as killed. If we only consider animal shelters which reported transporting few or no animals in 2020, facilities with the highest dog and cat kill rates considering the unaccounted for animals described above are as follows:
Thus, the plight of dogs and cats may be far worse in New Jersey animal shelters when we consider the unaccounted for animals.
Shelters Turn Their Backs on New Jersey’s Animals
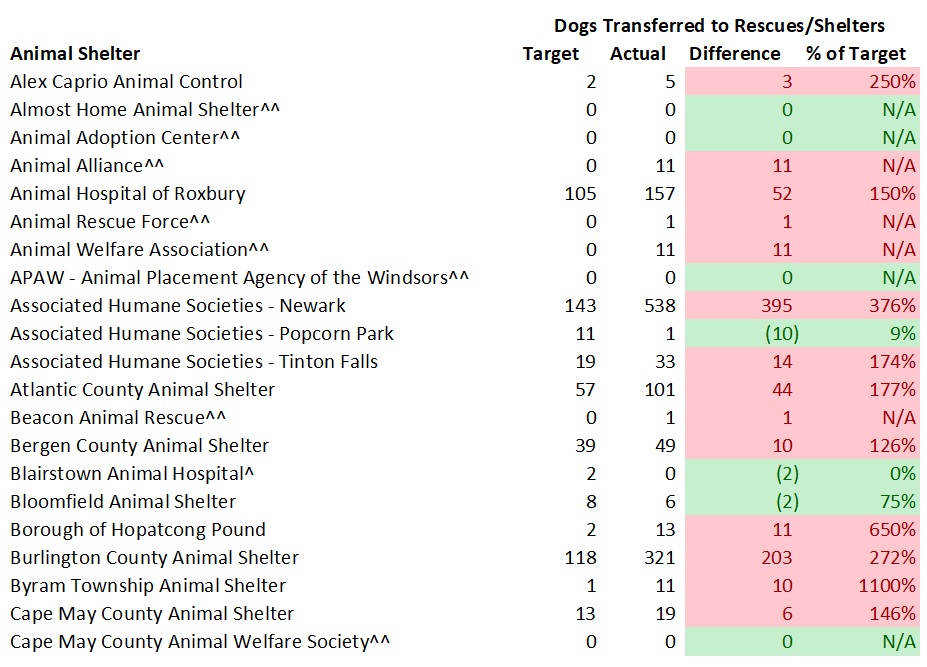
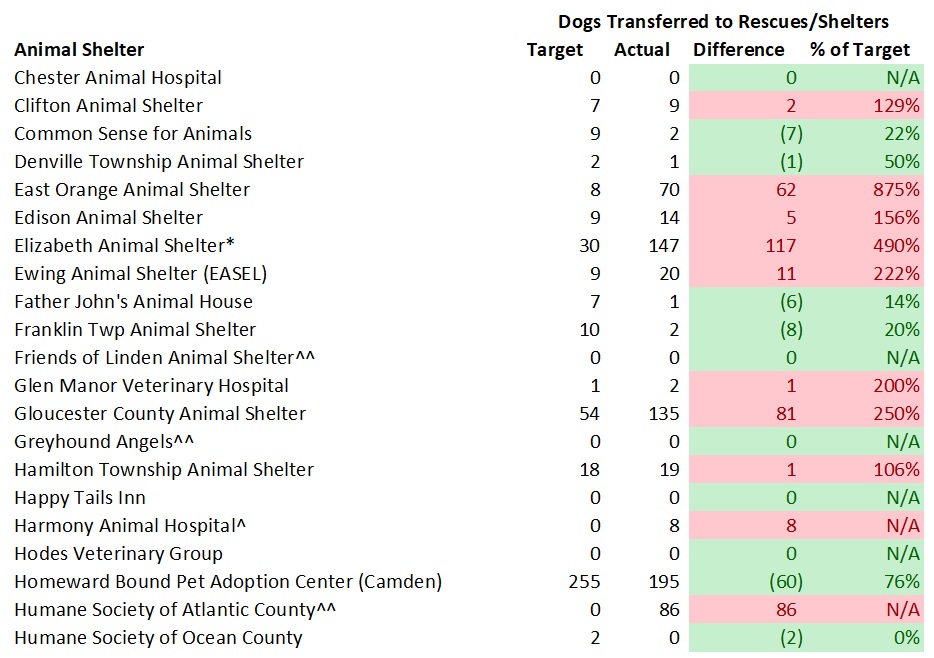
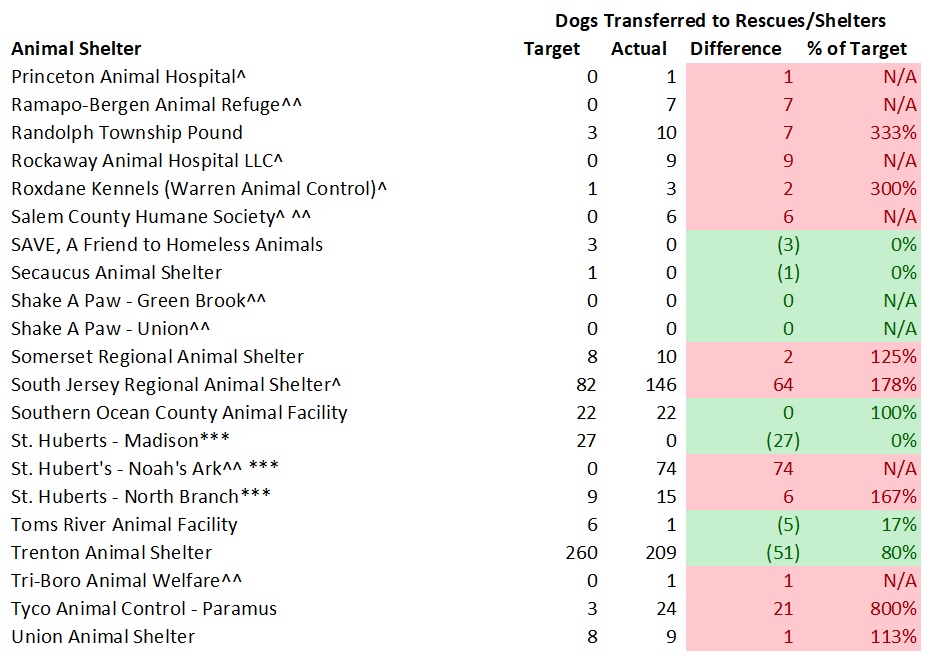
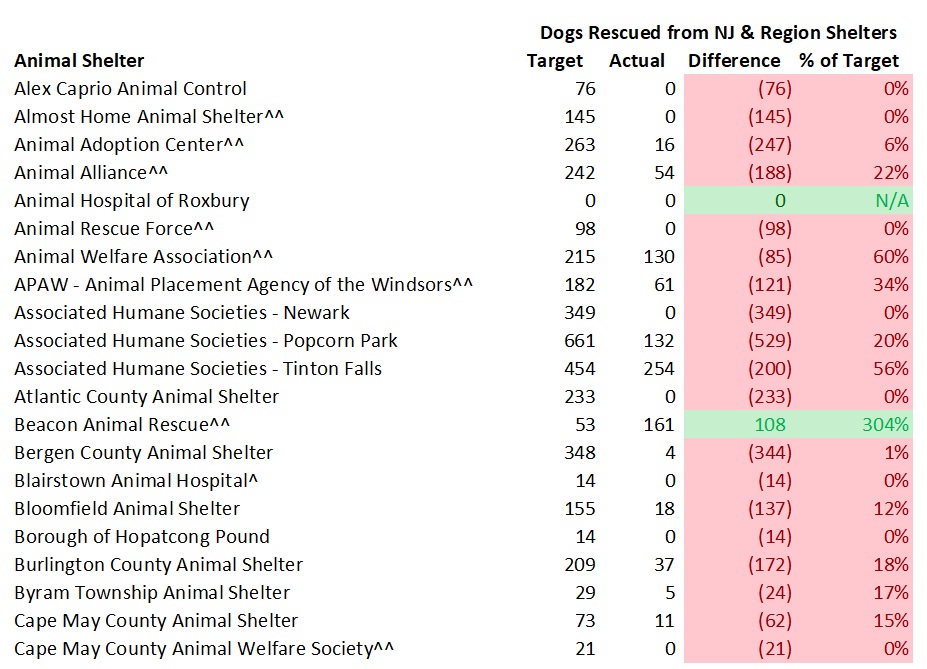
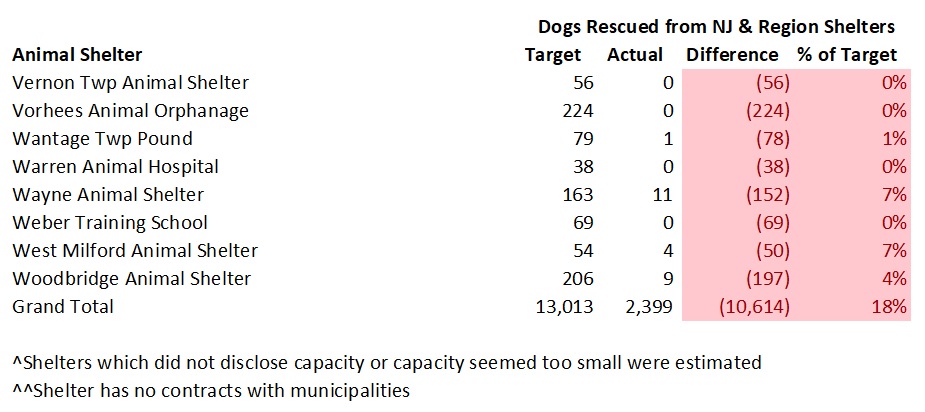
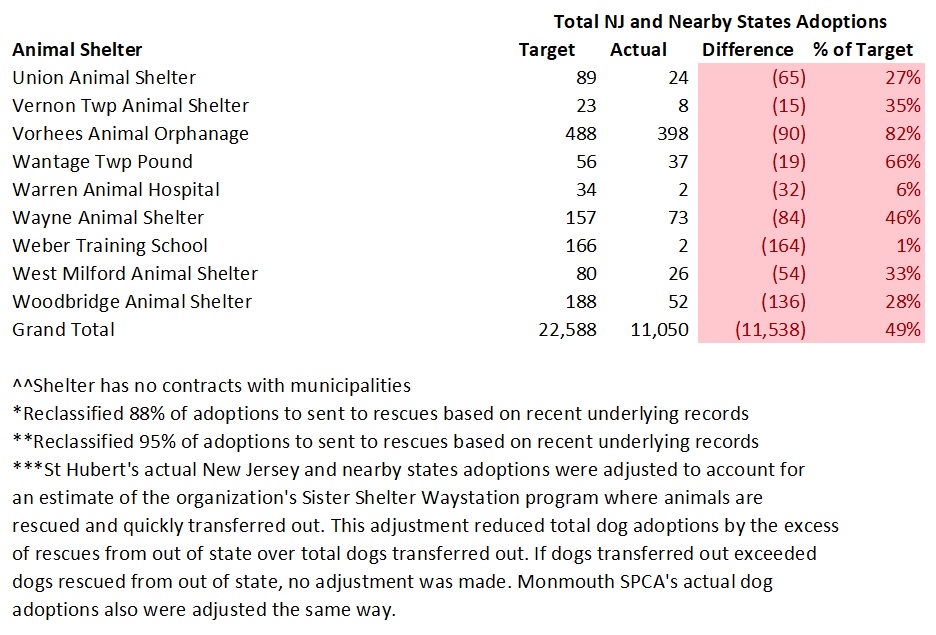
New Jersey animal shelters rescue far more dogs from out of state than from other New Jersey animal shelters. Specifically, New Jersey animal shelters transferred in 3,041 dogs from out of state animal shelters and only rescued 870 dogs from other New Jersey animal shelters. While fewer dogs were available for rescue in 2020, the pattern is consistent with past years.
While perhaps some shelters take animals from nearby New York or Pennsylvania animal control shelters, the overwhelming majority of these dogs most certainly came from down south. In fact, New Jersey animal shelters transported more dogs from out of state than dogs who were killed in New Jersey animal shelters. This number does not include additional out of state dogs transported into New Jersey by rescues operating without a physical facility. Shelters transporting the most dogs from out of state were as follows:
In 2020, several New Jersey animal shelters transported many cats from out of state. Its not clear if or how many of the cats EASEL took in from out of state were from nearby Pennsylvania or other places further away.
Shelters Do Far Worse with Animals Requiring New Homes
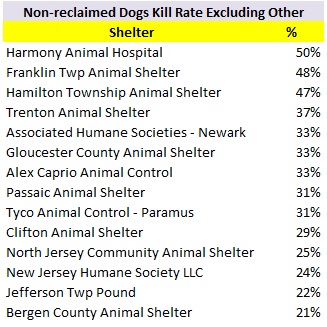
Since dogs reclaimed by their owners typically have licenses and/or microchips and quickly leave the shelter, its informative to look at dogs shelters have to find new homes for. To get a better idea of how organizations are doing with animals they actually have to shelter, I also examined what percentage of non-reclaimed dogs lose their lives at each facility. Shelters with the highest non-reclaimed dogs kill rates are as follows (excluding shelters taking few unclaimed dogs in):
Shelters with the highest maximum non-reclaimed dog kill rates are as follows (excluding facilities that reported transporting many dogs in and taking very few unclaimed animals in):
Shelters Leave Animal Enclosures Empty While Dogs and Cats Die
New Jersey animal shelters fail to use their space to save animals. Based on the average number of animals at all of New Jersey’s animal shelters at the beginning and the end of 2020, only 52% of dog and 74% of cat capacity was used. Given December is a low intake month, I also increased these populations to an average intake month. This adjustment only raised the dog capacity utilization to 54%. While this adjustment did increase the cat capacity utilization to 92%, it is highly unlikely this happened in reality. Shelter inspection reports I’ve reviewed often did not reveal significantly larger dog and cat populations in the summer and winter months. This is likely due to the influx of highly adoptable kittens having short lengths of stay and shelters killing cats with empty cages.
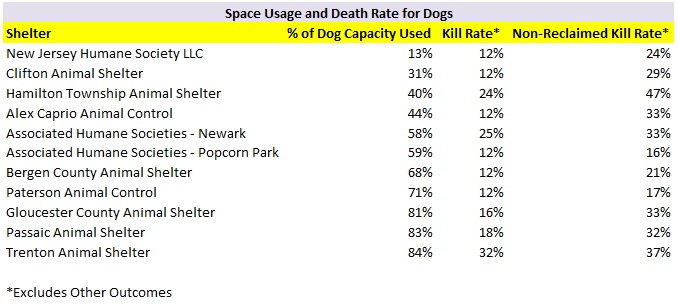
Many animal shelters with low kill rates failed to rescue animals with their excess space. Additionally, other shelters used little of their available space and still killed a large percentage of their animals. Some examples after increasing the population (and therefore capacity utilization) based on the adjustment discussed above are as follows:
Thus, many New Jersey animal shelters are killing dogs and cats despite having ample space to house these animals.
Shelters Show No Respect for Life for Animals Outside of Those Facilities
As I wrote in my last blog, 2020 was the most unusual year in the history of animal sheltering. The COVID-19 pandemic caused many shelters to restrict animal intake and the public, who were home more, lost fewer pets and fostered more animals. As a result, shelters took significantly fewer animals in and had more open animal enclosures than in the past.
On the other hand, many shelters across the country took it a step further and refused to help animals in need. Therefore, we must differentiate between shelters whose intake decreased due to pandemic related reasons and those who exploited COVID-19 to do less work and put animals at risk outside those facilities’ walls.
The following tables detail the shelters whose dog and cat intake decreased the most in 2020. As you can see, these shelters animal intake decreased significantly more than both the decrease for shelters across the country using PetPoint software (24% and 21% decrease for dogs and cats) and for New Jersey animal shelters as a whole (22% and 13% decrease for dogs and cats).
New Jersey’s animal shelters continue to fail the state’s animals. The state’s animal shelters only impounded 5.9 dogs and cats per 1,000 New Jersey residents in 2020. If we just count animals originating from New Jersey, the state’s animal shelters only impounded 5.2 dogs and cats per 1,000 people in 2020. As a comparison, Florida’s Lake County Animal Shelter took in 10.9 dogs and cats in 2020 and saved 98% of its dogs and 94% of its cats due to it fully implementing the No Kill Equation. Despite New Jersey shelters impounding a fraction of the animals many no kill communities take in on a per capita basis, the state’s animal control facilities continue to kill and allow animals to die under their care and outside their walls. Even worse, many of these shelters can’t even properly keep track of how many animals leave their facilities dead or alive. Our state’s animals deserve far better treatment than this. Contact your local city council members and mayor and demand better from the animal shelter serving your community. We can do so much better and it is time our shelters operate this way.
Cats are losing their lives at an alarming rate in New Jersey animal shelters. New Jersey animal shelters killed 7,255 cats or 17% of those cats having known outcomes in 2019. Additionally, a number of other cats died or went missing. This blog explores the reasons why this tragedy is occurring and whether we can end the massacre.
Model Assesses New Jersey Animal Shelters’ Life Saving Performance
In order to assess how good of a job New Jersey animal shelters are doing, I’ve developed an analysis I call the “Life Saving Model.” While shelter performance is dependent on many variables, such as finances, facility design, local laws, etc., the most critical factor impacting potential life saving is animal holding capacity. Without having enough physical space and foster homes, a shelter might not have enough time to find loving homes for its animals. Shelters can overcome financial limitations through creative fundraising or recruiting more volunteers. Similarly, organizations can save their cats despite having run down facilities if these groups enthusiastically implement policies to get animals into loving homes quickly. As a result, my analysis focuses on making the best use of space to save the maximum number of New Jersey and nearby areas cats.
The Life Saving Model measures the number of local animals a shelter should adopt out, rescue from other facilities, send to rescues or other shelters and euthanize to achieve no kill level live release rates. The targeted outcomes take into account each facility’s physical capacity plus the amount of foster homes it should use and the number of cats the organization receives from its community (i.e. strays, owner surrenders, cruelty cases, etc.). I assume a target euthanasia rate, take the number of cats actually returned to owners and then estimate how many community cats a shelter should adopt out. To the extent space runs out, I then calculate how many cats must be sent to rescue. If the shelter has excess space after properly serving its local community, the facility uses that room to rescue and adopt out cats from nearby areas. The targeted results calculated from this model are compared to the actual results from each shelter below.
The model expands shelter capacity to include the number of foster homes shelters should use. Based on a target I obtained from Target Zero’s now defunct “Humane Dash” tool, which I confirmed is appropriate with American Pets Alive leadership, shelters should have 7.5% of their annual cat intake in foster homes at any one time. These estimates are based on what several no kill animal control shelters already accomplish. Given fostering increases capacity and provides more humane care to animals, it is critical shelters have large scale foster programs. Therefore, I added 7.5% of each shelter’s annual cat intake to the shelter’s physical capacity.
The Life Saving Model requires a more complex analysis for cats than dogs in New Jersey. Generally speaking, New Jersey animal shelters receive few litters of young puppies who are vulnerable to disease. On the other hand, local shelters receive lots of young kittens, particularly during the April to October kitten season. These young kittens are highly vulnerable to disease and those without mothers require bottle feeding every 1-2 hours. Therefore, animal welfare organizations should not hold these kittens in a traditional shelter setting and instead should send these animals to foster homes or a kitten nursery at or outside of the facility. During the months outside of kitten season (i.e. November-March), my model assumes shelters will be able to place young kittens into their volunteers’ foster homes and/or in a kitten nursery run by the animal shelter. In kitten season with many young animals coming in, I assume a certain percentage of the cat intake will need to go to rescues or other shelters. For shelters who rescue cats, I assume a small percentage of the cats are young kittens who are hopelessly suffering and will require humane euthanasia. Thus, my Life Saving Model is a bit more complicated than the analysis I did for dogs.
To read specific details and assumptions used in the model, please see the Appendix at the end of this blog.
My analysis puts a cap on the targeted numbers of cats rescued from other shelters and adoptions. While my unmodified targeted numbers of rescued and adopted animals is achievable, I wanted to provide very conservative goals for New Jersey animal shelters.
My modified analysis capped cat adoptions at 6.2 cats per 1,000 people within each New Jersey county. In the past I used 8 cats per 1,000 people, but I decided to make the target more lenient this year as more shelters practice shelter/neuter return. In other words, the targeted numbers of cats rescued from other shelters and adopted below are the lesser of
Number predicted by model
Number determined by capping adoptions at 6.2 cats per 1,000 people in the county
In simple terms, a shelter is expected to achieve this per capita adoption rate unless the facility lacks enough space and foster homes. If a shelter does not have sufficient room, it won’t have the time to reach all the potential adopters and requires assistance from rescues and/or other facilities.
My model assumes shelters are doing the proper thing and practicing TNR and placing the reasonable number of feral cats received as barn cats. You can read a more detailed explanation of my rationale in the 2018 cat report cards blog.
New Jersey Animal Shelters Contain Enough Space to Save Most of New Jersey’s Healthy and Treatable Cats and Many More from Other States
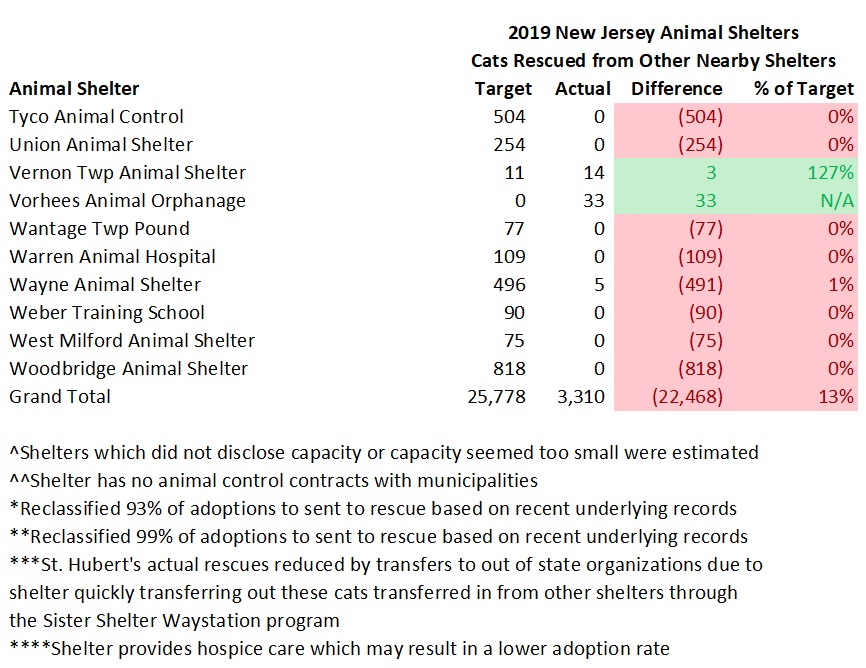
New Jersey’s animal shelter system has enough space to save the state’s healthy and treatable cats. The table below details the targeted numbers of cat outcomes the New Jersey animal shelter system should achieve. Out of the 43,592 New Jersey cats coming into the state’s animal shelters in 2019, 27,985 and 8,716 cats should have been adopted out and sent to other shelters/rescues by the facilities originally taking the cats in. However, other New Jersey animal shelters had enough capacity to rescue 25,778 cats or about three times the number of cats needing rescue from space constrained facilities. Unfortunately, some of the cats needing rescue, such as very young kittens, should not stay in a shelter and still must go to either kitten nurseries or foster homes. That being said, many adult cats are in fact killed in New Jersey animal shelters and many facilities with excess space could save these cats.
New Jersey animal shelters have enough excess space and potential foster homes to save many cats from out of state as well. Specifically, New Jersey animal shelters had enough physical capacity to rescue 17,063 cats from out of state shelters or New Jersey’s streets after achieving a 92% live release rate for cats coming into the state’s animal shelters. In reality, the New Jersey shelter system could rescue more than 17,063 cats from out of state shelters or from New Jersey’s streets given the 17,063 figure assumes all cats needing rescue from space constrained New Jersey shelters are sent to other New Jersey shelters as opposed to rescue groups. As explained above, some of the cats needing rescue from New Jersey shelters with a shortage of space are young kittens which should not go to most animal shelters. To put this number into perspective, New Jersey animal shelters contain enough space to make both New York City and Philadelphia no kill cities for cats and increase those cities’ cat live release rates to 92% as follows (per 2019 data):
New York City – 619 additional cats need saving
Philadelphia – 917 additional cats need saving
Certainly, some New Jersey animal shelters do pull some cats from New York City and Philadelphia animal control shelters. While some of the 409 cats New Jersey animal shelters rescued from out of state facilities may have come from New York City and Philadelphia shelters, its likely many came from other states since transporting shelters, such as St. Hubert’s, pulled a sizable number of these cats. Even though some of these cats from New York City and Philadelphia animal control shelters are young kittens, which should not go to a normal animal shelter, many other cats could go to New Jersey animal shelters and be adopted out. As a result, the additional number of cats New Jersey animal shelters could save from New York City and Philadelphia is not much lower than the figures above. Thus, New Jersey animal shelters could make New Jersey a no kill state for cats and help other states reach that goal as well.
These adoption goals are quite achievable when comparing the performance of well-run animal control shelters across the country. New Jersey animal shelters would only need to adopt out 5.9 cats per 1,000 people in the state (4.1 cats per 1,000 people if no cats were rescued from out of state and all cats sent to rescue were rescued by other New Jersey animal shelters and adopted out). As a comparison, recent per capita cat adoption numbers from several high performing no kill open admission shelters are as follows:
Charlottesville-Albemarle SPCA (Charlottesville and Albemarle County, Virginia area) – 11.0 cats per 1,000 people
Longmont Humane Society (Longmont, Colorado area) – 8.9 cats per 1,000 people
Kansas City Pet Project (Kansas City, Missouri) – 7.6 cats per 1,000 people
Lake County Animal Shelter (Lake County, Florida) – 5.9 cats per 1,000 people
Thus, many communities are already adopting out as many or significantly more cats than the number I target for New Jersey animal shelters.
Cat Deaths Vary Widely at New Jersey Animal Shelters
The goal of any properly managed animal shelter is to save all of its healthy and treatable animals. In some cases, such as selective admission rescue oriented shelters, it is pretty easy to not kill animals. In addition, other animal shelters with easy to service animal control contracts (i.e. few animals impounded) can avoid unnecessary killing due to having lots of extra space. As a result, some shelters may have an easier time than others in preventing killing at their shelters.
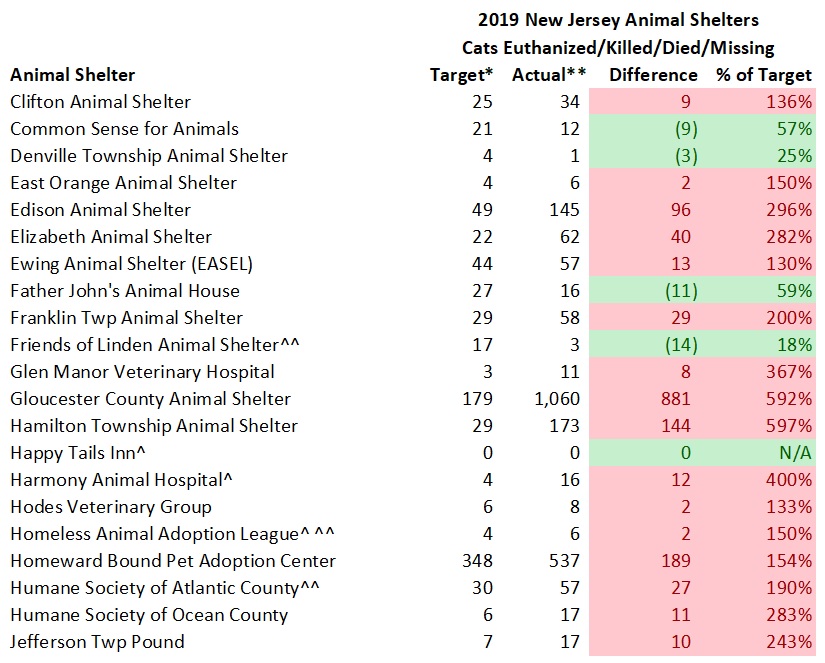
The tables below detail how many cats should lose their lives at each state animal shelter per my model and the actual numbers of cats that did. All missing or lost cats are assumed “dead” based on the assumption they died or went to a very bad place. Based on my review of a number of shelters’ underlying documents, virtually all of the cats in the “Other” outcome category died or went missing. While a small numbers of shelters could have included some live releases in the “Other” outcome category, it would be misleading to not count these deaths for the overwhelming majority of shelters. The “targeted” numbers in the table are based on the shelter’s actual cat intake rather than targeted cat intake to ensure an apples to apples comparison with the actual cats losing their lives. Shelters having the number of cats losing their lives at or below my targets and above my targets are highlighted in green and red in the tables below.
The overall results show too many cats are unnecessarily losing their lives at New Jersey animal shelters. New Jersey animal shelters had 6,364 cats needlessly lose their lives in 2019 (i.e. the sum of all shelters with too many cats needlessly losing their lives in the table below).
The largest number of cats unnecessarily dying occurred at a relatively small number of shelters. 11 out of 90 or 12% of the shelters accounted for 80% of the cats unnecessarily losing their lives under the model’s assumptions. Most of these shelters had negative stories reported in the press and/or on my blog or Facebook page over the last several years. Shelters with the greatest numbers of unnecessary cat deaths are as follows:
Atlantic County Animal Shelter (936)
Gloucester County Animal Shelter (881)
Burlington County Animal Shelter (773)
Northern Ocean County Animal Facility (561)
Vorhees Animal Orphanage (410)
South Jersey Regional Animal Shelter (390)
Bergen County Animal Shelter (287)
Associated Humane Societies-Newark (255)
Liberty Humane Society (244)
Homeward Bound Pet Adoption Center (189)
Southern Ocean County Animal Facility (176)
Associated Humane Societies-Tinton Falls (161)
Hamilton Township Animal Shelter (144)
Rescue oriented shelters generally had fewer cats lose their lives than targeted. While saving large numbers of cats is what we all want, some of these shelters may have achieved this result by taking in easier cats. Austin Pets Alive, which is a rescue oriented shelter in Texas, has developed some of the most innovative cat programs and only had a cat live release rate of 87% in 2019. This was due to Austin Pets Alive taking in many cats requiring significant treatment, such as neonatal kittens, from the city animal control shelter. As a result, some of the rescue oriented shelters with significantly fewer cats euthanized than targeted may have avoided taking in many of the more difficult cases.
On the bright side, some medium to large size animal control shelters euthanized fewer cats than targeted. Specifically, Cape May County Animal Shelter, Common Sense for Animals, Parsippany Animal Shelter, Paterson Animal Control, Randolph Regional Animal Shelter, St. Hubert’s-Madison, St. Hubert’s-North Branch and West Milford Animal Shelter performed well. Many of these shelters have TNR programs.
Space Constrained Facilities Not Receiving Enough Support from Rescues and Other Animal Shelters
Some animal shelters will require more support from rescues and animal shelters with excess space than others. If a shelter has relatively high intake and very limited space, it will need more help than other shelters. While sending animals to rescues is a good thing, we do want shelters most needing rescue support to receive that help given rescues have limited resources. The tables below compare the number of cats a shelter should transfer to other organizations per the model and the number of cats actually sent to other animal welfare groups. Shelters marked in green are receiving less than the expected rescue support while facilities marked in red are receiving too much rescue help.
Overall, New Jersey shelters are not receiving enough help from other animal welfare organizations. While New Jersey animal shelters sent more cats to rescues and other shelters than my model targeted, many cats were rescued from facilities which did not require so much rescue assistance. Only 41 out of the 69 facilities needing rescue assistance received the required support. In other words, only 59% of the animal shelters needing rescue help received the amount these facilities require.
We truly need to understand the reasons for this rescue shortfall. While poor data collection (i.e. shelters classifying rescues as adoptions) may explain part of this rescue deficit, the large size of this number points to other causes as well. For example, New Jersey shelters as a whole significantly exceeded their dog rescue needs and a much smaller number of shelters failed to receive enough rescue support, but just 59% of shelters needing cat rescue assistance received the needed support. Certainly, some of these cats are feral and not candidates for most rescues. However, many other cats surely are home-able. Many high kill facilities may not reach out to rescues for cats, such as during kitten season, as much as they do for dogs. This data supports the need for New Jersey to pass shelter reform bill S1834 which requires shelters to contact rescues and other facilities at least two business days before killing animals. On the other hand, shelters with excess capacity may not be doing their part to save cats from space constrained facilities.
Several shelters received too much rescue help. Rescues may want to help these organizations due to rescue friendly policies. Alternatively, these shelters may be relying too heavily on rescues to save their animals. Shelters receiving the most extra rescue support were as follows:
Associated Humane Societies-Newark – 710 more cats transferred than necessary
Gloucester County Animal Shelter – 571 more cats transferred than necessary
Paterson Animal Control – 325 more cats transferred than necessary
Trenton Animal Shelter – 269 more cats transferred than necessary
Elizabeth Animal Shelter – 165 more cats transferred than necessary
Woodbridge Animal Shelter – 160 more cats transferred than necessary
Associated Humane Societies-Tinton Falls – 157 more cats transferred than necessary
Byram Township Animal Shelter – 144 more cats transferred than necessary
Northern Ocean County Animal Facility – 131 more cats transferred than necessary
On the other hand, many space constrained shelters received far less rescue help than needed. Facilities receiving the lowest amount of rescue support in relation to their needs were as follows:
Homeward Bound Pet Adoption Center – 695 fewer cats transferred than necessary
Vorhees Animal Orphanage – 503 fewer cats transferred than necessary
Monmouth SPCA – 222 fewer cats transferred than necessary
Atlantic County Animal Shelter – 215 fewer cats transferred than necessary
South Jersey Regional Animal Shelter – 187 fewer cats transferred than necessary
St. Hubert’s-Madison – 180 fewer cats transferred than necessary
Liberty Humane Society – 78 fewer cats transferred than necessary
Parsippany Animal Shelter – 75 fewer cats transferred than necessary
SAVE, A Friend to Homeless Animals – 41 fewer cats transferred than necessary
Franklin Township Animal Shelter – 37 fewer cats transferred than necessary
The million dollar question is why do these shelters receive very little rescue help? Some shelters may report no cats sent to rescues and incorrectly count these animals as adopted. As you will see below, Homeward Bound Pet Adoption Center, Vorhees Animal Orphanage, St. Hubert’s-Madison and Parsippany Animal Shelter adopted out many cats and are doing a pretty good job. On the other hand, Franklin Township Animal Shelter killed many cats for absurd reasons, broke state law and does not do a good job of reaching out to the public for help. Similarly, local advocates have long complained about regressive shelter management at Atlantic County Animal Shelter and South Jersey Regional Animal Shelter. As a result, shelters receiving too little rescue help may or may not be doing their part to get that assistance.
Rescue groups and shelters with extra space should pull cats from kill shelters with the highest rescue “target” numbers and deficits in the tables below. If shelters not needing rescue support get that extra help, these shelters will not take the steps necessary to properly run their facilities. As a result of enabling poorly performing shelters and not pulling cats from truly space constrained facilities, rescuing cats from shelters with enough space leads to less lifesaving.
Shelters receiving less than needed rescue support should also examine their own policies and performance. Are the shelter’s operating processes allowing too many animals to get sick and therefore discouraging organizations to rescue their animals due to subsequent medical costs? Does the shelter actively reach out to rescues/other shelters and treat them with respect? Does the shelter make it convenient for other organizations to pull their animals?
Given killing animals for space is intolerable, the space-constrained shelters need to expand their effective cat capacity. These facilities could use extra space in their buildings to house cats on a short-term basis. These shelters can enter into arrangements with local veterinarians and local pet stores to house and adopt out some cats. Furthermore, shelters can create or expand foster programs to increase the number of cats cared for. Additionally, creating a pet owner surrender prevention program and an appointment system for owners willing to delay surrendering their cats could free up space in these shelters. Finally, space-constrained shelters with multiple animal control contracts should terminate some of these arrangements to bring their capacity for care in line with the number of cats they take in. Similarly, many shelters can use their bargaining power to require municipalities to allow TNR. As a result, space constrained shelters still need to take active steps to reduce killing rather than simply solely relying on rescue support.
Most New Jersey Animal Shelters Fail to Come Close to Reaching Their Cat Adoption Potential
We can assess each shelter’s contribution to making New Jersey and nearby areas no kill. While a shelter may be able to avoid killing healthy and treatable animals, it still may not live up to its potential for adopting out cats. On the other hand, a space constrained shelter may kill healthy and treatable cats, but still do a good job adopting animals out.
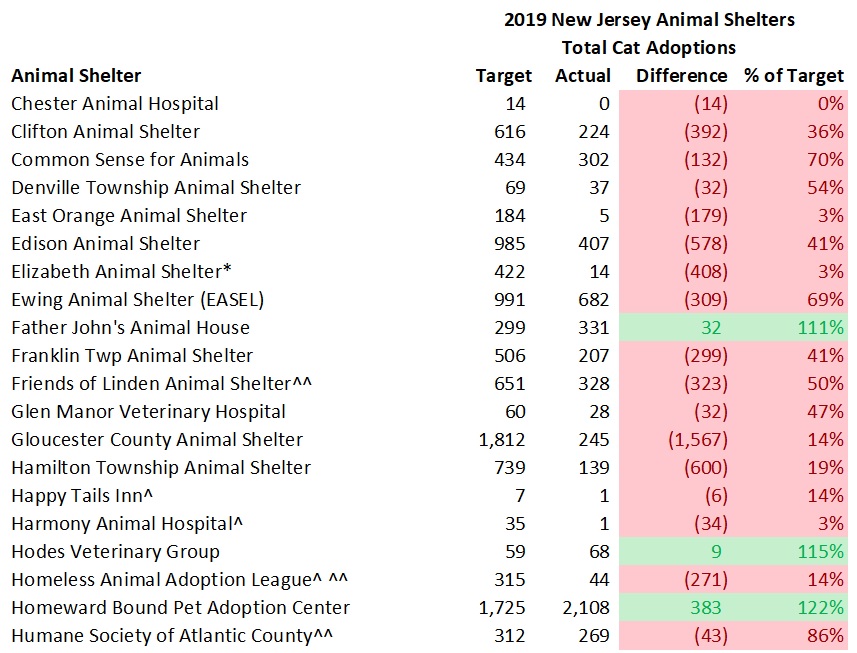
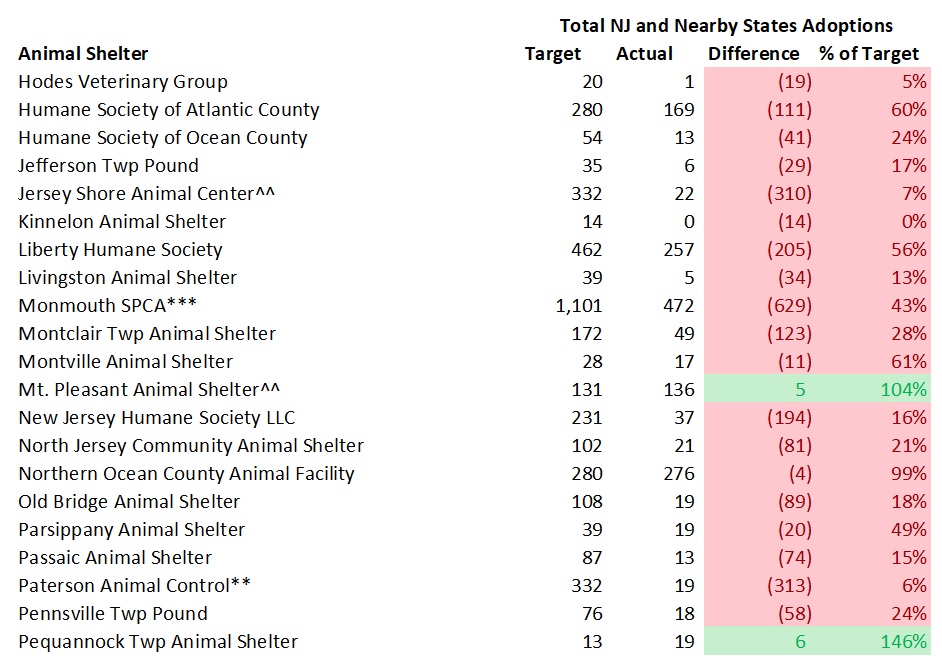
The tables below compare the number of cats from New Jersey and nearby states each animal shelter should adopt out with the number of cats actually adopted out.
Rescue oriented organizations may look better than they actually are. Many rescue oriented shelters likely pull much easier to adopt cats than the bulk of cats needing to get rescued from local facilities.
Few organizations reached or exceeded their adoption targets. Specifically, only 12 out of 90 shelters met the cat adoption goals computed by the Life Saving Model. Thus, the overwhelming number of New Jersey animal shelters need to step up their adoption efforts.
Several rescue oriented shelters reached their adoption targets. Animal Welfare Association exceeded its adoption target by the most of any shelter in terms of total adoptions. This shelter runs reduced and no adoption fee promotions. Animal Welfare Association also waives fees for certain cats who may take longer to adopt out, such as cats who are older or have behavior or health issues. Furthermore, the shelter’s “Best Friends” program allows people who adopt a cat to pay just $25 for a second cat who is 1 year or older. Animal Welfare Association also waives cat adoption fees for active military personnel and veterans in its Pets for Vets program. The shelter also waives adoption fees for senior citizens adopting certain senior pets. Additionally, Animal Welfare Association uses an open adoption process focused on properly matching animals and people rather than an overly judgmental procedure based on black and white rules. To aid its open adoptions process, Animal Welfare Association uses the ASPCA’s Feline-ality program. Animal Welfare Association’s adoption rate increased by 20% and its cat length of stay decreased by 23 days after the shelter implemented the Feline-ality program. Finally, Animal Welfare Association installed perches in their cat enclosures to provide cats more vertical space which keeps the cats happier and more adoptable. Beacon Animal Rescue also exceeded its adoption target and charges a reasonable $75 fee for adult cats and offers military personnel and veterans discounted adoption fees. While Mt. Pleasant Animal Shelter and Tri-Boro Animal Welfare also exceeded their adoption targets, this is likely due to my model’s adoption target cap mechanism in Morris County (see explanation below). Overall, Mt. Pleasant Animal Shelter’s cat adoptions decreased 35% from its 2018 levels likely due to well documented problems at the shelter. Thus, several rescue oriented shelters exceeded their cat adoption targets and Animal Welfare Association used a variety of innovative strategies to adopt out many cats.
Several Morris County shelters exceeded their adoption targets, but this may partially be due to my method of capping adoptions in the county. Since Morris County has many shelters that collectively have a very large capacity (i.e. very high adoption potential), my model reduces all Morris County animal shelters’ target adoptions to my county adoption cap. Thus, some of the shelters, particularly the small ones, had relatively low adoption targets.
Rescues should focus on pulling animals from Homeward Bound Pet Adoption Center and Vorhees Animal Orphanage. These shelters’ cat kill rates are too high and their need for rescues greatly exceeds the amount of animals actually pulled from these organizations. While some of these cats may be feral and therefore not adoptable, many other cats surely could be rescued from these shelters. Given these shelters are adopting cats out at a good rate, rescues and other other shelters should help these facilities out by pulling more cats.
Some municipal animal control shelters may be doing a better job with cats than the numbers below indicate. In some cases, municipalities may frown on government run shelters using taxpayer funds to rescue cats from elsewhere (i.e. leaving empty cat cages). My suggestion to these shelters is to find ways to use more of their capacity to expand their lifesaving work to other areas. For example, these shelters should consider taking in animals from other shelters for a fee or even contracting with other municipalities.
Shelters having the largest cat adoption shortfalls are as follows:
Associated Humane Societies-Newark (2,741)
Bergen County Animal Shelter (2,478)
Gloucester County Animal Shelter (1,567)
Plainfield Area Humane Society (1,310)
Woodbridge Animal Shelter (974)
Liberty Humane Society (969)
Monmouth SPCA (904)
Associated Humane Societies-Tinton Falls (892)
Burlington County Animal Shelter (872)
Montclair Township Animal Shelter (808)
Associated Humane Societies-Popcorn Park (768)
Atlantic County Animal Shelter (759)
Northern Ocean County Animal Facility (728)
Old Bridge Animal Shelter (716)
Hamilton Township Animal Shelter (600)
Unsurprisingly, every one of these shelters with the highest adoption shortfalls killed too many cats. Clearly, these shelters’ inability to properly implement strong adoption programs leads to unnecessary cat killing.
Associated Humane Societies performance is particularly disappointing. Specifically, Associated Humane Societies has the physical capacity to significantly reduce the killing of healthy and treatable cats. Associated Humane Societies’ adoption shortfall of 4,401 cats represented nearly 70% of the 6,364 cats who unnecessarily lost their lives in New Jersey animal shelters in 2019. Associated Humane Societies has the funding to reach these adoption targets as the organization took in $9.0 million of revenue for the fiscal year ending 6/30/19. This works out to $863 of revenue per dog and cat I project the shelter should take in per my Life Saving Model. As a comparison, Florida’s Lake County Animal Shelter exceeded the Life Saving Model’s dog adoption target and met its cat adoption target with just $430 of revenue per dog and cat. Given many no kill animal control shelters like Lake County Animal Shelter take in significantly less revenue per dog and cat impounded, Associated Humane Societies could achieve these adoption targets and end the killing of healthy and treatable cats in its facilities and in many of the state’s shelters. Activists wanting to increase life saving in New Jersey should focus on changing Associated Humane Societies’ policies given the lifesaving potential of this organization and its recent dismal performance.
Shelters Fail to Use Excess Space to Save Cats
To further examine New Jersey animal shelters’ performance in saving homeless cats, I compared the targeted number of cats each shelter should pull from nearby shelters to the number actually rescued from local facilities. I assume all cats rescued from out of state came from nearby areas, such as Philadelphia and New York City. While some of the out of state rescued cats may have comes from far away areas, I believe this is a small number and does not significantly impact the results.
Virtually all New Jersey animal shelters are failing to rescue the number of cats they should. 78 of the 90 shelters should rescue some cats from other local shelters. In fact, 36 of the 78 shelters with targeted excess capacity failed to rescue even a single cat from other animal shelters. Only two shelters with significant amounts of space to rescue cats from nearby shelters met or exceeded their cat rescue targets. Thus, nearly all New Jersey animal shelters with targeted excess capacity are failing to do their share in ending the killing of healthy and treatable cats.
TNR Is Essential, But Should Not Be An Excuse to Do Nothing
TNR must be instituted to end the killing of healthy and treatable cats. While many shelters may potentially come close to or reach a 90% live release rate, feral cats may still be killed. Simply put, New Jersey cannot become a no kill state without TNR becoming the law of the land. The Companion Animal Protection Act (“CAPA”) prevents shelters and municipalities from taking actions to hinder TNR, such as banning feral cat colony caretakers from feeding cats and lending traps out to the public for catching and killing feral cats. Even without an explicit law allowing TNR, the New Jersey Department of Health should encourage municipalities to implement TNR by changing its neutral stance on TNR to an endorsement of the practice. Furthermore, shelters, especially private facilities with animal control contracts, should refuse to take feral cats from places where TNR is prohibited and the shelters cannot place these feral cats as barn cats or send these animals to reputable sanctuaries per recommendations of many national animal welfare groups.
Shelters should not use anti-feral cat laws as an excuse for failing to institute innovative programs. Too many times shelters blame anti-feral cat ordinances for their outrageously high cat kill rates. However, my analysis proves cats are not dying in New Jersey’s shelter system due to too many cats coming in. While TNR certainly would reduce cat intake and make saving lives easier, our state’s shelter system has more than enough space to handle the number of cats that come in. Shelters need to implement key programs, such as foster care, high volume adoptions and vaccination upon intake. Additionally, shelters need to stay open weeknights and weekends when working people can adopt. Similarly, shelters should use innovative marketing, customer friendly open adoption processes, multiple off-site adoption locations, and frequent discounted adoption promotions to quickly move cats into good homes. Furthermore, implementing a program where fearful and aggressive cats are touched gently and spoken to softly likely will significantly reduce the number of cats labeled as “feral” and increase adoptions. Thus, anti-TNR ordinances do not prevent shelters from implementing other life saving policies.
Shelters Do Not Need to Leave Friendly Cats on the Street
Shelters do not need to neuter and release friendly cats or refuse to take these cats in given enough capacity exists within the New Jersey shelter system. In 2013, a group of animal welfare leaders, which included the Humane Society of the United States (“HSUS”) and the ASPCA, prepared a white paper stating a shelter should not impound cats if those cats or other cats in the shelter would subsequently be killed. The evidence supporting this policy, such as cats being more likely to find homes on the street than in traditional shelters, is quite strong. Subsequently, many shelters across the nation implemented these policies. However, my analysis shows the entire New Jersey shelter system does have enough space to handle friendly cats. While certain shelters are space constrained and could benefit from refusing to admit healthy and friendly cats, other shelters in the state have more than enough capacity to step in and find these cats homes. Thus, New Jersey shelters do not need to resort to refusing to take in friendly cats or neutering and releasing friendly cats to avoid killing cats provided these shelters work together and follow best practices.
Kitten Nurseries and Ringworm Wards Key to Saving Vulnerable Cats
Orphaned kittens are typically automatically killed in traditional animal shelters due to the time commitment required to care for these animals. Unweaned kittens require bottle feeding as frequently as every 1-2 hours. As a result, kittens not placed into foster care are typically killed in most animal shelters.
Kitten nurseries or bottle baby wards radically increase the save rate for orphaned kittens still requiring milk. While foster care and rescue programs can save unweaned kittens, kitten nurseries are more efficient and make the job easier. Austin Animal Services, which is the animal control shelter in Austin, Texas, killed 1,200 plus kittens a year before Austin Pets Alive created a bottle baby program. Volunteers work in two hour shifts to feed and care for the kittens. Additionally, nursing mothers are pulled from the city shelter and used to help nurse highly vulnerable young kittens who are orphaned. Kittens are put on antibiotics and treated for fleas and worms immediately to help prevent complications from transitioning from breast milk to formula. Austin Pets Alive pulled 100% of unweaned kittens from the city shelter since 2011. Best Friends created a kitten nursery in South Salt Lake City, Utah and saved more than 1,400 kittens from Salt Lake City area shelters in 2016. Thus, kitten nursery programs can save young and vulnerable kittens.
Ringworm ward programs easily save cats with this skin fungus. In traditional animal shelters, cats with ringworm are killed due to the risk that other animals and humans will catch this skin fungus. Austin Pets Alive created a specific “Ringworm Ward” program to treat and adopt out these cats. These cats are treated both topically and orally in an isolated area. After the cats are no longer contagious, the cats are sent to foster homes to complete their treatment and regrow their hair. Austin Pets Alive uses steeply discounted adoption fees of only $15 along with catchy slogans like “Adopt a Fun Guy (Fungi)”, “Lord of the Ringworm”, and “Hairy(less) Potter” to quickly place these cats and open up space for additional cats with ringworm. 100% of cats entering this program are saved. Thus, shelters can save cats with ringworm.
Regional kitten nurseries and ringworm wards are the practical solution to saving these vulnerable cats. Given the New Jersey shelter system has significant excess capacity to care for cats, certain shelters should convert some of that excess space for use as kitten nurseries and ringworm wards. Creating regional centers to care for unweaned kittens and cats with ringworm would allow the programs to run at a large enough scale to work efficiently. Shelters, such as Animal Welfare Association, Associated Humane Societies-Popcorn Park and Monmouth SPCA appear to have the space and financial resources to implement these programs and should join St. Hubert’s-Madison in this effort. Furthermore, the Animal Welfare Federation of New Jersey (“AWFNJ”) should take the steps needed to create kitten nurseries and ringworm wards in regional centers throughout the state. Surely, the AWFNJ has the connections to convince key decision makers to implement these programs and obtain any necessary funding. Thus, New Jersey shelter leaders must immediately take the steps needed to save the large numbers of treatable kittens and cats with ringworm in our state’s shelters.
Results Require New Jersey Animal Shelters to Take Action
The findings from this analysis mandate New Jersey animal shelters change their ways. While TNR remains a significant issue, most shelters are clearly not taking steps to save large numbers of healthy and treatable cats. Many shelters are not vaccinating upon intake, charging excessive adoption fees, making it too difficult to adopt, not being open when working people can go to shelters, leaving cat enclosures empty, not trying to rehabilitate fearful and aggressive cats and not using barn cat, foster care, kitten nursery and ringworm ward programs. Simply put, too many shelters are not doing what it takes to save lives. With New Jersey’s shelters killing around one in six cats, our state’s shelters are failing these animals.
New Jersey shelters have a cat crisis and it is time for the killing to stop. We have the information and even the blueprints from numerous communities which stopped killing and started saving their cats. It is time the excuses end and action begins. The public is fed up with the killing and demands shelters save their animals. Our state’s animal welfare organizations need to get on board the lifesaving wagon or risk getting run over by it. Which will they choose?
Daily capacity or population = Daily animal intake x average length of stay
Average length of stay = Daily capacity or population/daily intake
Each shelter’s community cat intake (i.e. owner surrenders, strays, cruelty cases), number of cats returned to owners, and maximum cat capacity were taken from its 2019 “Shelter/Pound Annual Report” submitted to the New Jersey Department of Health. Additionally, I added 7.5% of each shelter’s annual cat intake to account for foster capacity shelters should use based on my discussions with American Pets Alive leadership. Thus, total cat capacity equaled the shelter’s capacity plus foster capacity. You can see the full data set I compiled from these reports here.
Community cat intake and cats returned to owners were initially estimated for each month by dividing the annual figures by 12. In order to take into account the extra space in low intake months and reduced space in high intake months, we multiply that number by each month’s percentage of the average month. For example, assume 240 cats were taken in during the year and the average month equals 20 cats (240/12). In July, the cat intake is 120% higher than the average month and we therefore multiply 20 cats by 1.2 to equal 24 cats. If 120 cats were returned to owners during the year, the estimated number of cats returned to owners in July would equal 12 cats (120/12 = 10; 10*1.2). The monthly intake percentages were based off the average of the 2019 cat intake data on New York Animal Care & Control’s and ACCT Philly’s web sites.
The estimated number of community cats returned to owners each month are then assumed to stay 5 days on average at shelters based on data from other shelters across the country.
The number of community cats euthanized (including animals who died or are missing) is set to equal 8% of intake. 8% is a reasonable standard euthanasia rate to use given other open admission animal shelters, such as Austin Animal Services, equal or exceed this target and New Jersey’s much lower per capita cat intake makes it easier to save lives. The average length of stay for euthanized cats is assumed to equal 8 days. I assume these cats have severe and untreatable health issues and are euthanized immediately after their required 7 day hold period.
The average length of stay used for adopted community cats was 42 days. This estimate was roughly halfway between the average cat length of stay figures for a number of no kill animal control shelters. For example, the average length of stay for cats in recent years was 12 days at Texas’s Williamson County Animal Shelter, less than two weeks at Nevada Humane Society 15 days at Montana’s Flathead County Animal Shelter, 24 days at Colorado’s Longmont Humane Society, 32 days at Kansas City Pet Project and 61 days for adopted cats only at New York’s Tompkins County SPCA. While the average length of stay of adopted cats at these shelters other than Tompkins County SPCA may have been slightly higher since this data is for all cats and not just those adopted, the difference is not likely significant given adoptions represent most of the outcomes at these shelters. Unfortunately, I was not able to break down the adoption length of stay figures by age or breed for New Jersey’s shelters like I did in my analysis on dogs due to a lack of detailed cat intake data at New Jersey animal shelters. Upon reviewing cats up for adoption at several New Jersey animal control shelters and a few of the high performing facilities above, I did not see any significant differences in types of cats taken in. In the future, I hope to refine this analysis further.
The average length of stay used for community cats adopted out from rescue oriented shelters was 30 days. Rescue oriented animal shelters typically carefully select animals taken into their shelters. Based on the San Francisco’s SPCA’s 22 day and Tony La Russa’s Animal Rescue Foundation’s 23 day average length of stay figures reported a number of years ago, I used a shorter length of stay for community cats adopted from New Jersey animal shelters without animal control contracts. I chose 30 days as a conservative estimate.
Cats transferred to rescue or other facilities are assumed to stay at shelters 8 days on average based on the assumption strays can’t be released until the 7 day hold period elapses.
Community cats not returned to owners or euthanized are initially assumed as adopted for each month outside of kitten season (i.e. November-March). However, if the calculated length of stay exceeds the shelter’s required length of stay, cats are moved from adoption (i.e. with a longer length of stay) to rescue (i.e. shorter length of stay) until the calculated length of stay each month approximately equals the required length of stay.
During kitten season (April-October), animal control shelters are assumed to send a certain percentage of cats to rescues even if they have excess space. Due to the large numbers of kittens coming into shelters during these months, I assume shelters will not be able to place all of them into foster homes or a kitten nursery at this time. As a result, I assume animal control shelters will send 10% of their annual community cat intake to rescues based on the shelters’ estimated relative cat intake each month. For example, if a shelter took 100 cats in during the year and August made up 50% of the total cat intake from April to November, 5 cats would go to rescue in August (i.e. 100*10% = 10 cats; 10*50% = 5 cats). I used 10% based off the rescue percentage of cat intake in 2014 (it was only 2% in 2018) at Kansas City’s KC Pet Project. KC Pet Project is a no kill open admission shelter with an inadequate facility and is a good comparison for some of our state’s run down shelters. Shelters requiring rescue support due to space constraints are assumed to send these additional cats to rescues during kitten season.
Shelters are not expected to use the excess space created by fosters taking kittens to rescue and adopt out additional cats. This is based on the assumption that the kittens will return to shelters once old enough to safely stay at the facilities.
Required length of stay = Shelter’s reported capacity/adjusted daily intake for the month. Adjusted daily intake for month = Adjusted monthly intake per first bullet above/the number of days in the month.
Shelters with excess capacity are assumed to use the extra space to rescue and adopt out cats from other New Jersey animal shelters. Given some of these cats will be young and highly vulnerable kittens, I assume 5% of these rescues will be euthanized for humane reasons. I used 5% based off Austin Pets Alive’s and Austin Humane Society’s weighted average cat euthanasia rate in 2014. These two shelters pull many cats from Austin Animal Services, which is the city’s animal control shelter, and their cat euthanasia rate is a reasonable proxy for the percentage of hopelessly suffering cats rescued from animal control shelters. To the extent all healthy and treatable New Jersey animal shelter cats are saved, I assume additional cats are pulled from nearby states. The average length of stay for rescued and adopted cats is the same as the cats taken in by animal control shelters (i.e. 42 days). Similarly, I used 8 days as the average length of stay for rescued and euthanized cats from other shelters.
Each month’s targeted outcomes are added to determine how many cats New Jersey animal shelters should adopt out, send to rescue and rescue from other nearby animal shelters.
Space constrained shelters were assumed to adopt out their easiest to adopt animals first until they run out of space. To estimate the average adoption length of stay, I used cat adoption length of stay data from Perth Amboy Animal Shelter from 2014 and the first half of 2015. I broke the adoption length of stay data into 5 groups that each made up 20% of the data. The average adoption length of stay for each of these 5 groups was calculated. The average adoption length of stay of each group was divided by the average length of stay for all of the adopted cats in the Perth Amboy Animal Shelter data set. Those percentages were then multiplied by the average cat adoption length of stay determined in the model above and used to determine the adoption lengths of stay used for space-constrained shelters.
The targeted number of cats adopted were capped at 6.2 cats per 1,000 people in each county. If the model yielded a higher result than this cap, the targeted numbers of cats adopted were equal to this cap. For shelters in these counties (except Passaic County), I calculated the cap at the county level and then reduced the number of cats adopted for the county to equal the cap. I excluded West Milford from Passaic County due the town’s large distance from the population centers in the rest of the county. Each shelter’s percentage of total targeted adoptions in the county from the unmodified model were applied to the the total reduction in the number of cats adopted in the county to yield the targeted numbers of cats adopted in the modified model. Rescued and euthanized cats for these shelters were reduced based on the modified model’s assumption that shelters adopted out and euthanized 95% and 5% of rescued cats.
In a blog from earlier this year, I disclosed New Jersey’s depressing animal shelter statistics. This blog explains why so many dogs are losing their lives in the state’s animal shelters and whether these facilities can end the killing.
Successful organizations set measurable goals and regularly monitor their performance. Examples include financial budgets, customer and employee satisfaction surveys, and product reliability metrics. Unfortunately, many animal shelters for far too long have failed to set lifesaving goals and standards. Municipalities, donors and volunteers need to know where their resources will be best utilized. Time and money are scarce resources and people should allocate these assets to organizations who will best utilize them. As a result, animal shelters need to set goals and hold their leadership and staff accountable for achieving these objectives.
Model Assesses New Jersey Animal Shelters’ Life Saving Performance
In order to assess how good of a job New Jersey animal shelters are doing, I’ve developed an analysis I call the “Life Saving Model.” While shelter performance is dependent on many variables, such as finances, facility design, local laws, etc., the most critical factor impacting potential life saving is animal holding capacity. Without having enough physical space and foster homes, a shelter might not have enough time to find loving homes for its animals. Shelters can overcome financial limitations through creative fundraising or recruiting more volunteers. Similarly, organizations can save their dogs despite having run down facilities if these groups enthusiastically implement policies to get animals into loving homes quickly. As a result, my analysis focuses on making the best use of space to save the maximum number of New Jersey and nearby states dogs.
The Life Saving Model measures the number of local animals a shelter should adopt out, rescue from other facilities, send to rescues or other shelters, and euthanize. The targeted outcomes take into account each facility’s physical capacity plus the amount of foster homes it should use and the number and types of dogs the organization receives from its community (i.e. strays, owner surrenders, cruelty/bite cases). I assume a target euthanasia rate, take the number of dogs actually returned to owners and then estimate how many community dogs a shelter should adopt out. To the extent space runs out, I then calculate how many dogs the shelter must send to rescues. If the shelter has excess space after properly serving its local community, the facility uses that room to rescue and adopt out dogs from nearby areas. The targeted results calculated from this model are compared to the actual or estimated actual results from each shelter below.
The model expands facility capacity to include the number of foster homes shelters should use. Based on a target American Pets Alive and other progressive shelter directors communicated at the 2019 American Pets Alive Conference, shelters should have 3% of their annual dog intake in foster homes at any one time. These estimates are based on what several no kill animal control shelters already accomplish. Given fostering increases capacity and provides more humane care to animals, it is critical shelters have large scale foster programs. Therefore, I added 3% of each shelter’s annual dog intake to the shelter’s physical capacity.
For shelters with animal control contracts, I place 10% of all dogs that are not reclaimed by owners into the targeted sent to rescue category. Austin Pets Alive used data from Austin Animal Center, which is the local municipal shelter, to determine large dogs with behavioral challenges are part of the last 10% of animals losing their lives. While shelters can save most of these dogs through behavioral rehabilitation and/or foster programs, I decided to put an estimate of these dogs into the sent to rescue category since that is another good outcome for these dogs.
This year I modified the model to have shelters euthanize 1% of the dogs rescued from other shelters. While I believe my model in prior years accurately reflected the New Jersey animal shelter system as a whole, the model’s euthanized dog targets for shelters who primarily rescue animals from other shelters may have been a bit too strict.
My analysis caps pit bull adoptions at 2 pit bulls per 1,000 people within each New Jersey county. In other words, the targeted numbers of dogs rescued from other shelters and adopted below are the lesser of
Number predicted by model
Number determined by capping pit bull adoptions at 2 pit bulls per 1,000 people in the county
In simple terms, a shelter is expected to achieve this per capita adoption rate unless the facility lacks enough space. If a shelter does not have sufficient room, it won’t have the time to reach all the potential adopters and requires assistance from rescues and/or other facilities. Given my model assumes 80% of rescued dogs are pit bull like dogs, my targeted numbers of dogs rescued and adopted are quite low as detailed in the section below. For example, shelters in counties where dog adoptions are capped have extra space that they do not use to adopt out other dog breeds.
To read specific details and assumptions used in the model, please see the Appendix at the end of this blog.
New Jersey Animal Shelters Contain Enough Space to Save All of New Jersey’s Dogs and Many More from Other States
New Jersey’s animal shelter system has enough space to save all of the state’s healthy and treatable dogs. The table below details the targeted numbers of dog outcomes the New Jersey animal shelter system should achieve. Out of the 20,531 New Jersey dogs coming into the state’s animal shelters in 2019, 9,834 and 1,092 dogs should have been adopted out and sent to other shelters/rescues by the facilities originally taking the dogs in. However, other New Jersey animal shelters had more than enough capacity to rescue the 1,092 dogs from space constrained facilities. Thus, New Jersey animal shelters should be able to able to adopt out every single healthy and treatable dog taken in from the state and not require any support from rescue organizations without physical facilities from a space perspective.
New Jersey animal shelters have enough excess space to save many dogs from out of state as well. Specifically, New Jersey animal shelters had enough physical capacity to rescue at least 12,429 dogs from out of state after achieving a 95% live release rate for New Jersey dogs. To put this number into perspective, New Jersey animal shelters could make both New York City and Philadelphia no kill cities for dogs and increase those cities’ dog live release rates to 95% in 2019 as follows:
New York City – 1,047 additional dogs need saving
Philadelphia – 417 additional dogs need saving
Additionally, New Jersey animal shelters could pull at least another 10,965 dogs from other locations outside of the state. Of course, some New Jersey animal shelters do pull some dogs from New York City and Philadelphia animal control shelters. However, most of these dogs are likely easy to adopt and therefore have short lengths of stay. As a result, the additional number of dogs New Jersey animal shelters could save from New York City, Philadelphia and elsewhere is probably not much lower than the figures above. Thus, New Jersey animal shelters could make New Jersey a no kill state for dogs as well as many other places.
These adoption goals are quite achievable when comparing the performance of well-run animal control shelters across the country. New Jersey animal shelters would only need to adopt out 2.6 dogs per 1,000 people in the state (1.2 dogs if no dogs rescued from out of state). As a comparison, recent per capita dog adoption numbers from several high performing no kill open admission shelters are as follows:
Lynchburg Humane Society (Lynchburg, Virginia) – 14.3 dogs per 1,000 people
Longmont Humane Society (Longmont, Colorado area) – 9.0 dogs per 1,000 people
Lake County Animal Shelter (Lake County, Florida) – 4.6 dogs per 1,000 people
Williamson County Animal Shelter (Williamson County, Texas) – 4.6 dogs per 1,000 people
Thus, many communities are already adopting out around two to six times as many dogs as the goal set for New Jersey animal shelters.
Some naysayers may claim New Jersey would have a more difficult time due to the state’s shelters taking in many pit bulls. However, this is a myth. My model estimates New Jersey animal shelters would need to adopt out roughly 0.4 pit bulls per 1,000 people to save 95% of New Jersey’s dogs. Our shelters would only need to adopt out around 1.5 pit bulls per 1,000 people if New Jersey shelters also rescued and adopted out the targeted number of pit bulls from other states. As a comparison, Florida’s Lake County Animal Shelter adopted out 1.32 pit bulls per 1,000 people in 2019. However, the shelter director believes the number is actually higher since the facility adopts out a good number of pit bull like dogs without a pit bull label. Furthermore, the pit bull adoption targets are even more reasonable given the model assumes there are roughly 1/3 of the number of dogs from other breeds to compete with in the New Jersey adoption market compared to Lake County, Florida.
Animal Deaths Vary Widely at New Jersey Animal Shelters
The goal of any properly managed animal shelter is to save all of its healthy and treatable animals. In some cases, such as selective admission rescue oriented shelters, it is pretty easy to not kill animals. In addition, other animal shelters with easy to service animal control contracts (i.e. few animals impounded, most strays quickly returned to owners) can avoid unnecessary killing due to having lots of extra space. As a result, some shelters may have an easier time than others in preventing killing at their shelters.
The tables below detail how many dogs should lose their lives at each state animal shelter per my model and the actual numbers of dogs that did. The model’s targets have shelters euthanizing 5% of community dogs (strays, owner surrenders, cruelty/bite cases, etc.) and 1% of dogs rescued from other shelters. All missing or lost dogs are assumed “dead” based on the assumption they died or went to a very bad place. Based on my review of a number of shelters’ underlying documents, virtually all of the dogs in the “Other” outcome category died or went missing. Shelters having the number of dogs losing their lives at or below my targets and above my targets are highlighted in green and red in the tables below.
The largest number of dogs unnecessarily dying occurred at a relatively small number of shelters. Overall, 880 dogs needlessly lost their lives at New Jersey animal shelters in 2019 (i.e. the sum of all shelters killing too many dogs). 13 out of 92 or 14% of the shelters accounted for 81% of the dogs unnecessarily losing their lives under the model’s assumptions. Associated Humane Societies’ three shelters needlessly killed 87 dogs per the model or 10% of the total dogs unnecessarily dying in the state’s shelters. Trenton Animal Shelter, Gloucester County Animal Shelter, Bergen County Animal Shelter and Paterson Animal Control, which all broke state law in recent years, needlessly killed 177 dogs per the model or 20% of the total dogs unnecessarily dying in the state’s shelters. Shelters with the greatest number of unnecessary dog deaths are as follows:
St. Hubert’s – Madison (104)
Gloucester County Animal Shelter (90)
Associated Humane Societies – Newark (69)
Toms River Animal Facility (62)
Atlantic County Animal Shelter (58)
Bergen County Animal Shelter (56)
Trenton Animal Shelter (51)
Humane Society of Atlantic County (48)
Homeward Bound Pet Adoption Center (41)
Liberty Humane Society (40)
Burlington County Animal Shelter (34)
Paterson Animal Control (31)
South Jersey Regional Animal Shelter (25)
Thus, the bulk of the dogs unnecessarily dying at New Jersey animals shelters occurs at a small number of facilities.
Most New Jersey Animal Shelters Require Little Rescue Assistance
Some animal shelters will require more support from rescues and animal shelters with excess space than others. If a shelter has relatively high intake, very limited space, and few stray dogs returned to owners, it will need more help than other shelters. In an ideal world, rescues would take all shelter animals. However, due to limited numbers of foster homes, lesser ability to find foster homes due to many rescue organizations’ small sizes, and most rescues’ restrictive adoption policies, all shelters cannot heavily rely on rescues. The tables below compare the number of dogs a shelter should transfer to other organizations per the model and the number of dogs actually sent to other animal welfare groups. Shelters marked in green are receiving less than the expected rescue support while facilities marked in red are receiving too much rescue help.
Overall, most New Jersey animal shelters require little rescue support if space-constrained facilities fast-track their most highly adoptable dogs. Shelter medicine experts advocate prioritizing the processing of highly adoptable animals to make the best use of space and reduce disease. For example, making sure these animals are the first to get spayed/neutered and vaccinated and receive microchips to ensure they can leave as soon as the shelter finds a good home.
46 shelters received too much help, 26 facilities received just enough assistance and 20 shelters received too little help from other animal welfare organizations. However, the excess dogs rescued (1,653 dogs) at shelters receiving too much assistance was far higher than the rescue deficits at other shelters (173 dogs) resulting in the state’s shelters sending 1,480 more dogs than needed to rescues and other animal welfare organizations. Some shelters, such as Elizabeth Animal Shelter and Paterson Animal Control, report transfers to rescues and other shelters as adoptions. While I made adjustments for these facilities based on my reviews of these facilities underlying records in past years, its certainly possible other shelters incorrectly reported their data (i.e. counting animals sent to rescues as adoptions). Nonetheless, the New Jersey shelter system as a whole is receiving enough rescue assistance, but some shelters are hurt by rescues pulling animals from less needy facilities.
Rescue groups and shelters with extra space should pull dogs from kill shelters with the highest rescue “target” numbers and deficits in the tables below. If shelters not needing rescue support get that extra help, these shelters will not take the steps necessary to properly run their facilities. As a result of enabling poorly performing shelters and not pulling dogs from truly space constrained facilities, rescuing dogs from shelters with enough space leads to less lifesaving.
Shelters receiving less than needed rescue support should also examine their own policies and performance. Are the shelter’s operating processes allowing too many animals to get sick and therefore discouraging organizations to rescue their animals due to subsequent medical costs? Does the shelter actively reach out to rescues/other shelters and treat them with respect? Does the shelter make it convenient for other organizations to pull their animals?
Given killing animals for space is intolerable, the space-constrained shelters need to expand their effective dog capacity. These facilities could use extra space in their buildings to house dogs on a short-term basis. These shelters can enter into arrangements with local veterinarians to house and adopt out some dogs. Additionally, creating a pet owner surrender prevention program, implementing a proper managed intake policy (i.e. where animals are impounded when in danger and waiting periods for owner surrenders are relatively short) and making serious efforts to return lost dogs to owners could free up space in these shelters. Finally, space-constrained shelters with multiple animal control contracts should terminate some of these arrangements to bring their capacity for care in line with the number of dogs they take in. As a result, space constrained shelters still need to take active steps to reduce killing rather than simply solely relying on rescue support.
In certain circumstances, it may make sense for shelters with excess space to send dogs to rescues. For example, a unique breed or a dog needing very specialized behavioral or medical rehabilitation. However, these cases are accounted for in my targeted sent to rescue figures for animal control shelters.
Most New Jersey Animal Shelters Fail to Come Close to Reaching Their Local Dog Adoption Potential
We can assess each shelter’s contribution to making New Jersey and nearby areas no kill. While a shelter may be able to avoid killing healthy and treatable animals, it still may not live up to its potential for adopting out local dogs. On the other hand, a space constrained shelter may kill healthy and treatable dogs, but still do a good job adopting animals out.
The tables below compare the number of dogs from New Jersey and nearby states each animal shelter should adopt out with the estimated number of local dogs actually adopted out.
Many rescue oriented shelters likely pull much easier to adopt dogs than the bulk of dogs needing to get rescued from local facilities. Thus, the results from rescue oriented shelters may look better than they actually are.
Few organizations reached or exceeded their adoption targets. Specifically, only 7 out of 92 shelters met the adoption goals computed by the Life Saving Model. Thus, the overwhelming number of New Jersey animal shelters need to step up their adoption efforts.
Common Sense for Animals exceeded its adoption target, but this may at least partially be due to inaccurate records. While this organization exceeded its adoption targets, the shelter’s figures were off by 69 dogs using the methodology outlined in another blog.
Morris County animal shelters’ higher than targeted local dog adoption results are a bit misleading. These facilities benefited from the method I used to cap adoptions in the county and reduce adoption targets. For example, St. Hubert’s Noah’s Ark’s actual adoptions percentage of its targeted adoptions figures dropped from 159% to 64% when I looked at the unadjusted model. Similarly, Pequannock Animal Shelter’s and Denville Animal Shelter’s actual adoptions percentage of their targeted adoptions figure dropped from 240% to 100% and 100% to 40% when I looked at the unadjusted method. Since Morris County has many shelters that collectively have a very large capacity (i.e. very high adoption potential), my model reduces all Morris County animal shelters’ target adoptions to my county adoption cap. In addition, Pequannock Animal Shelter lists a dog capacity of just one dog at its shelter that is significantly less than the number of dog kennels I’ve seen at the facility in the past. Also, Tri-Boro Animal Welfare lists an unusually small dog capacity of just four dogs which lowered their adoption target. Therefore, these shelters have relatively low dog adoption targets. Additionally, St. Hubert’s-Noah’s Ark may rescue a number of dogs from other St. Hubert’s facilities and those dogs may come from out of state. Thus, these shelters really didn’t do an excellent job adopting out local dogs.
Similarly, Humane Society of Atlantic County and Humane Society of Ocean County also benefited from my model capping adoptions in their counties. Since much larger shelters exist in those counties, these smaller shelters had their adopting targets capped at a relatively low level. Humane Society of Atlantic County’s and Humane Society of Ocean County’s actual adoptions percentage of their targeted adoptions figures dropped from 106% to 91% and 125% to 44% when I looked at the unadjusted method.
Shelters adopting out the fewest animals in total relative to their targets were as follows:
Associated Humane Societies-Newark – 1,241 fewer dogs adopted than targeted
Monmouth SPCA – 529 fewer dogs adopted than targeted
Associated Humane Societies-Popcorn Park – 506 fewer dogs adopted than targeted
Plainfield Area Humane Society – 494 fewer dogs adopted than targeted
Tyco Animal Control – Paramus – 433 fewer dogs adopted than targeted
Bergen County Animal Shelter – 428 fewer dogs adopted than targeted
Gloucester County Animal Shelter – 388 fewer dogs adopted than targeted
Burlington County Animal Shelter – 358 fewer dogs adopted than targeted
Atlantic County Animal Shelter – 335 fewer dogs adopted than targeted
Paterson Animal Control – 311 fewer dogs adopted than targeted
Shake a Paw-Union – 310 fewer dogs adopted than targeted
Greyhound Angels – 290 fewer dogs adopted than targeted
New Jersey Humane Society – 275 fewer dogs adopted than targeted
Hamilton Township Animal Shelter – 274 fewer dogs adopted than targeted
Several shelters’ poor performance is quite predictable. Associated Humane Societies-Newark, Paterson Animal Shelter, Shake a Paw-Union, New Jersey Humane Society, Gloucester County Animal Shelter, Monmouth SPCA, Hamilton Township Animal Shelter and Bergen County Animal Shelter had troublesome stories involving the shelters and/or prominent people affiliated with these organizations in recent years. Tyco Animal Control performed poorly due to this for profit company having a regressive view of animal sheltering. Shake a Paw-Union’s low local adoption numbers are not surprising since it also operates a for profit pet store. Monmouth SPCA and Montclair Township Animal Shelter transported in many dogs from outside of New Jersey during 2019 that reduced their ability to save local dogs.
Shelters Fail to Use Excess Space to Save Local Dogs
To further examine New Jersey animal shelters’ performance in saving the state’s homeless dogs, I compared the targeted number of dogs each shelter should pull from nearby shelters and compared it to the number actually rescued from local facilities. I assume all reported out of state rescued dogs came from southern states or other far away places. While some of the out of state rescued dogs may have comes from nearby areas, I believe this is a small number and does not significantly impact the results.
Virtually all New Jersey animal shelters are failing to rescue the number of local dogs they should. 90 of the 92 shelters should rescue some dogs from other local shelters. In fact, 43 of the 90 shelters with targeted excess capacity failed to rescue even a single dog from a New Jersey animal shelter. Of the 90 shelters that should have rescued dogs, only four shelters met or exceeded their local dog rescue targets. However, two of those shelters, Humane Society of Atlantic County and St. Hubert’s-Noah’s Ark, may not have truly helped the number of medium to large size local dogs they should based on these shelters taking easier to adopt animals and possibly out of state animals (i.e. St. Hubert’s-Noah’s Ark may have rescued out of state transported dogs from other St. Hubert’s facilities that originally came from the south).
As mentioned above, many shelters local rescue numbers are inflated due to these organizations cherry picking highly adoptable animals to rescue. Thus, nearly all New Jersey animal shelters with targeted excess capacity are failing to do their share in ending the killing of local healthy and treatable dogs.
Shelters can overcome challenges in rescuing dogs from outside their service area. In some cases, municipalities may frown on government run shelters using taxpayer funds to rescue dogs from elsewhere. However, shelter directors at these facilities can encourage individuals to form a non-profit or raise money on their own to pay for these rescued dogs. Additionally, shelters with limited capacity or even some of the well-off private shelters could contribute funding for each dog rescued. For example, Maddie’s Fund paid an approximate $160 subsidy to rescues pulling dogs from New York Animal Care & Control. Similarly, private shelters with excess space, but limited financial resources, could expand their fundraising efforts to save more local dogs. Thus, perceived obstacles to rescuing local dogs can and should be overcome.
New Jersey Animal Shelters Need to Form Life-Saving Coalitions
The improper allocation of space within the state’s animal shelter system requires organizations to form coalitions. While putting a competent and compassionate director in every shelter would likely be even more effective, that will likely take time to do. No kill coalitions between animal control facilities and selective admission shelters have been used in places, such as Portland, Oregon, Reno, Nevada, Jacksonville, Florida and Austin, Texas to radically increase life saving. Maddie’s Fund, which has supported using coalitions for over a decade, has many resources for organizations seeking to collaborate with each other. Thus, New Jersey animal shelters need to formally work together, develop quantifiable and measurable goals (such as the targeted outcomes in this blog), and hold each organization accountable for meeting these benchmarks.
Sobering Results Require Shelter Leaders to Critically Examine Themselves
Shelters should examine the reasons why their adoption numbers fall far short of these benchmarks. In some cases, shelters need to expand the hours they are open for adoptions. Many shelters should switch from an overly judgmental adoption process based on black and white rules to a conversational one focused on educating the adopter. Organizations will need to radically increase their off-site events and do same day adoptions. Similarly, many shelters must reduce adoption fees and run frequent promotions. Executive Directors should monitor the latest life-saving programs on Maddie’s Fund’s, American Pets Alive Conference’s, and the Best Friends National Conference’s web sites and put some of these policies into place. Shelter management teams will need to ensure their facilities are clean and customers are treated with respect (this can be measured by encouraging the public to complete surveys). Thus, poorly performing shelters need to stop making excuses and do what it takes to reach their adoption potential.
We can turn New Jersey, New York City and Philadelphia into no kill communities. It is time we give our money and volunteer efforts to organizations who raise their performance to help us reach that goal. To do otherwise, would betray all the animals whose lives are on the line.
Appendix – Life Saving Model Assumptions
The Life Saving Model utilizes the following basic animal shelter population equations to calculate the targeted dog outcomes for each facility:
Daily capacity or population = Daily animal intake x average length of stay
Average length of stay = Daily capacity or population/daily intake
Each shelter’s community dog intake (i.e. owner surrenders, strays, cruelty bite cases), number of dogs returned to owners, and maximum dog capacity were taken from its 2019 “Shelter/Pound Annual Report” submitted to the New Jersey Department of Health. Additionally, I added 3% of each shelter’s annual dog intake to account for foster capacity shelters should use based on American Pets Alive guidelines. Thus, total dog capacity equaled the shelter’s capacity plus foster capacity.
My model revised Tom’s River Animal Facility’s and Pennsville Township Pound’s community intake due to errors in their Shelter/Pound Annual Reports resulting in owner reclaims exceeding the beginning population plus 2019 community intake. Therefore, I increased the 2019 community intake to ensure the beginning population plus 2019 intake equaled the ending population.
Harmony Animal Hospital’s number of dogs returned to owners in community intake were reduced since the shelter had no beginning population or 2019 community intake. The model assumed these dogs were returned to the facilities the shelter rescued the animals from in 2019.
This data was then used as follows:
Community dog intake and dogs returned to owners were initially estimated for each month by dividing the annual figures by 12. In order to take into account the extra space in low intake months and reduced space in high intake months, we multiply that number by each month’s percentage of the average month. For example, assume 240 dogs were taken in during the year and the average month equals 20 dogs (240/12). In July, the dog intake is 120% higher than the average month and we therefore multiply 20 dogs by 1.2 to equal 24 dogs. If 120 dogs were returned to owners during the year, the estimated number of dogs returned to owners in July would equal 12 dogs (120/12 = 10; 10*1.2). The monthly intake percentages were based off the average of the 2019 dog intake data on New York Animal Care & Control’s and ACCT Philly’s web sites.
The estimated number of community dogs returned to owners each month are then assumed to stay 5 days on average at shelters based on data from other shelters across the country. If anything, this estimate is conservative (i.e. average length of stay for dogs returned to owners may be less than 5 days and therefore frees up more shelter space for adoptions) based on some shelters returning the bulk of their dogs to owners within 3 days.
The number of community dogs euthanized (including animals who died or are missing) is set to equal 5% of intake. 5% is a reasonable standard euthanasia rate for shelters in New Jersey to meet given few vulnerable stray puppies (i.e. who could die or require euthanasia) arrive in the state’s animal shelters. The average length of stay for euthanized dogs is assumed to equal 14.5 days. Half of dogs are assumed euthanized for untreatable aggression towards people and 21 days is the time estimated to make that determination. The other half of dogs are assumed euthanized for severe and untreatable health issues and I estimate these dogs are euthanized after 8 days (subsequent to the end of the stray hold and owner surrender protection periods).
Adopted dogs are assumed to stay at shelters for varying lengths of time. Adoption length of stay was based on data from a study in the Journal of Applied Animal Welfare and the figures used (except for space-constrained shelters) are located in a prior blog on pit bull adoption. The data primarily comes from Tompkins County SPCA during a time it saved over 90% of its dogs. This was a fairly conservative data set to use as other no kill open admission shelters’ average length of stay are substantially shorter. Specifically, the following assumptions were made:
80% and 20% of each communities dogs (including pit bulls) were adults 1 year and older and under 1 year.
Pit bulls were assumed to comprise 50%, 35% and 25% of community dog intake at poor, middle/upper middle class, and wealthy area animal control shelters. While some shelters may have pit bulls comprising more than 50% of their shelter dog population at a given time, this is due to pit bulls longer average length of stay. For example, a shelter with pit bulls making up 50% of their dog intake and pit bulls having an average length of stay three times longer than other dogs will have pit bulls constituting 75% of the dog population. Shelters without animal control contracts were assumed to only have pit bulls make up 10% of their community dogs (i.e. strays and owner surrenders) based on most of these shelters’ highly selective admission practices.
Pit bull adoption length of stay was taken directly from the Journal of Applied Animal Welfare study. The average adoption lengths of stay for other breeds from this study were averaged and used for dogs other than pit bulls in the analysis
Space constrained shelters were assumed to adopt out their easiest to adopt animals first until they ran out of space. To estimate the average adoption length of stay, I used pit bull adoption length of stay data from Greenhill Humane Society from March 2013 through May 2015. I broke the adoption length of stay data into 5 groups that each made up 20% of the data. The average adoption length of stay for each of these 5 groups was calculated. The average adoption length of stay of each group was divided by the average length of stay for all of the adopted pit bulls in the Greenhill Humane Society data set. Those percentages were then multiplied by the average dog adoption length of stay determined in the previous bullet and used to determine the adoption lengths of stay used for space-constrained shelters.
Dogs transferred to rescue or other facilities are assumed to stay at shelters 8 days on average based on the assumption strays can’t be released until the 7 day hold period elapses.
Community dogs not returned to owners or euthanized are initially assumed as adopted for each month. However, if the calculated length of stay exceeds the shelter’s required length of stay, dogs are moved from adoption (i.e. longer length of stay) to rescue (i.e. shorter length of stay) until the calculated length of stay each month approximately equals the required length of stay.
Animal control shelters have a minimum of 10% of unclaimed dogs go to rescues. To the extent shelters transfer 10% of unclaimed dogs to rescues despite having space (i.e. reclassifying dogs from adoptions with a longer length of stay to rescues with a shorter length of stay), I do not require these facilities to use that space to rescue additional dogs.
Required length of stay = Shelter’s total capacity/adjusted daily intake for the month. Adjusted daily intake for month = Adjusted monthly intake per first bullet above/the number of days in the month.
Shelters with excess capacity are assumed to use the extra space to rescue and adopt out dogs from other New Jersey animal shelters. To the extent all healthy and treatable New Jersey animal shelter dogs are saved, I assume additional dogs are pulled from nearby states with similar types of dogs. The model assumes shelters adopt out 99% of rescued dogs and euthanize 1% of them. Based on pit bull type dogs having longer lengths of stay at shelters, I assume 80% of dogs rescued from local animal shelters are pit bulls and 20% are non-pit bulls. 80% and 20% of pit bull and non-pit bull type dogs are considered 1 year and older and under 1 year. The average length of stay for rescued pit bulls and other dogs are the same as the adoption length of stay figures above. Due to immateriality, I assumed the dogs rescued and euthanized stayed at the shelter the same amount of time as the dogs adopted out.
Each month’s targeted outcomes are added to determine how many local dogs New Jersey animal shelters should adopt out, send to rescue, rescue from other nearby animal shelters and euthanize.
The targeted number of dogs rescued and adopted were capped at 2 pit bulls per 1,000 people in each county. If the model yielded a higher result than this cap, the targeted numbers of dogs adopted were set to equal to this cap using the pit bull percentage assumptions above. For shelters in these counties (except Passaic County), I calculated the cap at the county level and then reduced the number of dogs adopted for the county to equal the cap. I excluded West Milford from Passaic County due the town’s large distance from the population centers in the rest of the county. Each shelter’s percentage of total targeted adoptions in the county from the unmodified model were applied to the the total reduction in the number of adoptions in the county to yield the targeted numbers of dogs adopted in the modified model. If the shelter also rescued animals from other shelters, the rescued numbers were also reduced since I assume rescued animals are adopted.
Recently, I wrote a blog discussing decreased killing at New Jersey animal shelters in 2019. This blog will explore the 2019 statistics in more detail and assess the current status of the state’s animal shelters.
Most New Jersey animal shelters voluntarily report detailed data to state authorities. Earlier this year, I shared the 2019 summary statistics for New Jersey animal shelters on my Facebook page. Each year, the New Jersey Department of Health requests each licensed animal shelter in the state to submit animal shelter data for the previous year. Animal shelters voluntarily submit this data in the “Shelter/Pound Annual Report.” The New Jersey Department of Health takes these Shelter/Pound Annual Reports and compiles the number of dogs, cats and other animals impounded, redeemed, adopted and euthanized to prepare its Animal Intake and Disposition report. However, the Shelter/Pound Annual Reports include additional information on how animals were impounded (i.e. strays, owner surrenders, rescued from in-state facilities, rescued from out of state shelters, and cruelty/bite cases/other) and disposed of (i.e. returned to owner, adopted, sent to rescue/another shelter, and died/missing/other outcome). Additionally, the Shelter/Pound Annual Reports include the number of animals in shelters at the beginning and end of the year as well as the maximum number of animals facilities can hold. Thus, the Shelter/Pound Annual Reports include very important data not found in the New Jersey Department of Health’s summary report.
I compiled the data from these reports and analyze the results in this blog. 2019 statistics for each New Jersey animal shelter are listed at this link. You can also view each “Shelter/Pound Annual Report” at this link.
Garbage Data Raises Serious Questions About New Jersey Animal Shelters’ Statistics
Most New Jersey animal shelters do not properly account for their animals. Simple math dictates the number of animals at a facility at the beginning of the year, plus all animals coming in during the year, less all animals leaving for the period, should equal the number of animals a shelter has at the end of the year. Stunningly, 47 out of 91 shelters reporting these dog statistics and 50 out of 89 facilities submitting this cat data failed to get this right. This raises serious questions about the accuracy of these shelters’ reported statistics. 31 of the 47 shelters with flawed dog statistics and 32 of the 50 facilities with incorrect cat statistics should have had more animals at the end of the year than reported. While these errors could have been due to incorrect counts of the number of animals at facilities, these shelters may have not recorded outcomes, such as animals who were killed, died, or went missing. To put it another way, 1,934 cats and dogs should have had outcomes reported and did not. Thus, there is the potential that as many as 1,934 additional dogs and cats were killed, died or went missing from New Jersey animal shelters than were reported in 2019.
Even worse, a number of animal shelters reported having a different number of animals at the end of 2018 and at the beginning of 2019. Obviously, shelters should report the same number of animals at the end of the prior year and the start of the current year. However, 32 of 88 shelters reported different numbers of dogs at the end of 2018 and the beginning of 2019. Similarly, 37 of 87 shelters reported different numbers of cats at the end of 2018 and the beginning of 2019. The worst offenders are listed in the tables below:
Shelters may have failed to classify animals adopted out and sent to rescues properly. Both Paterson Animal Control and Elizabeth Animal Shelter reported no animals were sent to rescues and all dogs and cats leaving their facilities alive were owner reclaims or adoptions. However, intake and disposition records I reviewed at both of these shelters in recent years revealed almost all “adopted” animals are actually rescued. One has to wonder how many other facilities failed to properly classify adoptions and rescues properly. This data is very important as it provides details on the burden rescues and other shelters are taking on from these facilities.
We need better oversight of New Jersey animal shelters’ data reporting. Currently, these statistics are voluntarily reported and most shelters are not taking this seriously. For example, I noticed a large number of reports were submitted many months after the end of the year. This data should be easy to compile since facilities can utilize animal shelter software programs, some of which are free, to do this task. Furthermore, New Jersey animal shelter laws mandate facilities maintain much of the raw data found in the Shelter/Pound Annual Report. Unfortunately, New Jersey Department of Health inspections routinely find shelters do not properly keep records on animals. We need to make the data reporting mandatory for animal shelters as the shelter reform bill, S636, does along with serious penalties for significant errors (especially if deliberate). In order for animal shelters to take data reporting seriously, we may also need to require audits of these reports. Thus, these results show we need stronger laws and the New Jersey Department of Health to play a greater role in ensuring reported animal shelter statistics are in fact accurate.
Despite the errors in these reports, the data provided still reveals important information.
More Animals Losing Their Lives in New Jersey Animal Shelters Than Disclosed in Summary Report
The more detailed data in the Shelter/Pound Annual Reports allows one to more critically examine the percentage of locally impounded animals dying in New Jersey’s animal shelters. The following table summarizes my analysis of the kill rate calculated from the New Jersey Department of Health’s summary report and the data reported in the Shelter/Pound Annual Reports.
The statistics include an estimate to remove animals St. Hubert’s transfers in and quickly transfers out through its Sister Shelter WayStation program. Since St. Hubert’s is effectively acting as a middle man and not holding these animals very long, it makes sense to exclude these dogs and cats from the various kill rate statistics. If I did not exclude these animals, I would understate the dog and cat kill rates due to inflated intakes and outcomes numbers. Therefore, I removed all of St. Hubert’s dogs transferred out from the intake and outcomes figures in the metrics. Since St. Hubert’s primarily uses the Sister Shelter Waystation program to quickly transfer in cats and send them to out of state facilities, I only backed out the cats St. Hubert’s transferred to out of state organizations in the various kill rates. This adjustment increased the dog kill rate (intake) from 5.1 to 5.7% and the cat kill rate (intake) from 15.2% to 15.4%.
The Animal Intake and Disposition report prepared by the New Jersey Department of Health only allows one to calculate the number of animals killed as a percentage of total animals impounded or intake. I prefer calculating the kill rate as a percentage of outcomes rather than intake as this metric directly compares positive and negative outcomes. Using intake may depress the kill rate since shelters can simply hold animals for a long time to the point of overcrowding. Calculating the kill rate based on outcomes rather than intake caused the dog kill rate to decrease from 5.7% to 5.6% and the cat kill rate to increase from 15.4% to 15.6%.
To calculate the statewide kill rate, we must also back out transfers from one New Jersey animal shelter to another state facility to avoid counting animals still in the state’s shelter system or registering two outcomes for the same animal (i.e. one New Jersey animal shelter transfers a dog or cat to another state facility which then adopts out the animal). This adjustment increases the dog kill rate from 5.6% to 6.0% and the cat kill rate from 15.6% to 16.6%.
In addition, we should increase the kill rate for animals who died or went missing in shelters. In the past, I’ve labeled this metric the death rate as these animals are likely dead or in a very bad situation. Unfortunately, the Shelter/Pound Annual Report includes animals who died or went missing in the “Other” outcome category. The “Other” category contains positive live releases, such as TNR for cats, at a few shelters. While including the “Other” category in the death rate for most shelters is appropriate (i.e. those facilities that don’t do TNR or don’t include cats released through TNR programs in “Other” outcomes), I’m no longer doing this due to an increasing number of shelters implementing TNR. Instead, I calculated the kill rate by subtracting out “Other” outcomes from total outcomes. If a shelter specifies the number of animals included in “Other” that left the shelter alive, I count this as “Other Live Release” and do not back these amounts out of total outcomes. After making this adjustment, the dog kill rate increased from 6.0% to 6.1% and the cat kill rate stayed at 16.6%. For those interested in seeing the estimated death rates, you can find them in the supporting spreadsheet.
Also, many shelters transport easy to adopt animals from out of state which artificially increases live release rates. To properly calculate the percentage of New Jersey animals losing their lives, we need to adjust for transports. Unfortunately, shelters don’t break out their kill rates by local and out of state animals. However, most likely nearly all of the out of state animals (primarily puppies and easy to adopt dogs and cats) make it out of shelters alive. Therefore, I back out the number of out of state transports from total outcomes to estimate the local kill rate. This adjustment increases the New Jersey dog kill rate from 6.1% to 7.7% and the state’s cat kill rate from 16.6 to 17.8%.
Also, I estimate a maximum local kill rate by including the number of unaccounted for animals described in the section above. Making this adjustment increases the maximum potential New Jersey dog kill rate from 7.7% to 10.2% and the maximum potential state cat kill rate from 17.8% to 20.7%.
Some animal shelters quickly return large percentages of their animals to owners. At these shelters, the populations served are typically well-off and animals are licensed and have microchips. To account for the animals facilities actually have to shelter, I calculated a kill rate for non-reclaimed animals and a maximum potential kill rate for non-reclaimed local animals. The non-reclaimed kill rate and maximum potential kill rate for dogs is 9.0% and 17.8%. Non-reclaimed cats had a 18.8% kill rate and a 22.1% maximum potential kill rate. Thus, the percentage of New Jersey animals losing their lives in our state’s animal shelters may be much higher than the state summary report suggests.
Kill Rates Extremely High at a Number of New Jersey Animal Shelters
Dogs and cats are likely to lose their lives at a number of New Jersey animal shelters. Shelters with the highest kill rates for dogs and cats (excluding very low intake facilities) are listed in the following tables:
Thus, both dogs and cats have a very good chance of leaving many New Jersey animal shelters dead rather than alive.
In terms of raw numbers, the following shelters killed the most animals:
Many shelters fail to account for large numbers of their animals. As discussed above, a shelter’s number of animals at the end of the year should be calculated as follows:
Beginning number of animals + animals impounded – animals leaving the shelter
Unfortunately, a large number of shelters take in far more animals than they can explain where they went. Shelters having the highest numbers of unaccounted for dogs and cats are listed in the following tables:
Dog and cat kill rates at many shelters may be even higher if these unaccounted for animals are counted as killed. If we only consider animal shelters which reported transporting few or no animals in 2019, facilities with the highest dog and cat kill rates considering the unaccounted for animals described above are as follows:
Thus, the plight of dogs and cats may be far worse in New Jersey animal shelters when we consider the unaccounted for animals.
Shelters Turn Their Backs on New Jersey’s Animals
New Jersey animal shelters rescue far more dogs from out of state than from other New Jersey animal shelters. Specifically, New Jersey animal shelters transferred in 8,197 dogs from out of state animal shelters and only rescued 2,308 dogs from other New Jersey animal shelters. However, St. Hubert’s frequently transfers a substantial number of its transports quickly to its partners in New Jersey and other states. If I back out St. Hubert’s transfers of dogs to out of state organizations, the number of transports decreases from 8,197 dogs to 5,269 dogs. While the state’s local kill rate decreased in 2019, it is likely the local kill rate would have decreased by more if not for the massive number of out of state transports.
While perhaps some shelters take animals from nearby New York or Pennsylvania animal control shelters, the overwhelming majority of these dogs most certainly came from down south. In fact, New Jersey animal shelters transported more dogs from out of state than dogs who were killed in New Jersey animal shelters. This number does not include additional out of state dogs transported into New Jersey by rescues operating without a physical facility. Shelters transporting the most dogs from out of state were as follows:
Shelters Do Far Worse with Animals Requiring New Homes
Since dogs reclaimed by their owners typically have licenses and/or microchips and quickly leave the shelter, its informative to look at dogs shelters have to find new homes for. To get a better idea of how organizations are doing with animals they actually have to shelter, I also examined what percentage of non-reclaimed dogs lose their lives at each facility. Shelters with the highest non-reclaimed dogs kill rates are as follows (excluding shelters taking few unclaimed dogs in):
Shelters with the highest maximum non-reclaimed dogs kill rates are as follows (excluding facilities that reported transporting many dogs in and taking very few unclaimed animals in):
Shelters Leave Animal Enclosures Empty While Dogs and Cats Die
New Jersey animal shelters fail to use their space to save animals. Based on the average number of animals at all of New Jersey’s animal shelters at the beginning and the end of 2019, only 57% of dog and 75% of cat capacity was used. Given December is a low intake month, I also increased these populations to an average intake month. This adjustment only raised the dog capacity utilization to 62%. While this adjustment did increase the cat capacity utilization to over 100%, it is highly unlikely this happened in reality. Shelter inspection reports I’ve reviewed often did not reveal significantly larger dog and cat populations in the summer and winter months. This is likely due to the influx of highly adoptable kittens having short lengths of stay and shelters killing cats with empty cages.
Many animal shelters with low kill rates failed to rescue animals with their excess space. Additionally, other shelters used little of their available space and still killed a large percentage of their animals. Some examples after increasing the population (and therefore capacity utilization) based on the adjustment discussed above are as follows:
Thus, many New Jersey animal shelters are killing dogs and cats despite having ample space to house these animals.
New Jersey’s animal shelters continue to fail the state’s animals. The state’s animal shelters only impound 8.9 dogs and cats per 1,000 New Jersey residents. If we just count animals originating from New Jersey, the state’s animal shelters only impound 7.2 dogs and cats per 1,000 people. As a comparison, Florida’s Lake County Animal Shelter took in 15.1 dogs and cats in 2019 and saved 99% of its dogs, 98% of its pit bull like dogs and 91% of its cats due to it fully implementing the No Kill Equation. Despite New Jersey shelters impounding a fraction of the animals many no kill communities take in on a per capita basis, the state’s animal control facilities continue to kill and allow animals to die under their care. Even worse, many of these shelters can’t even properly keep track of how many animals leave their facilities dead or alive. Our state’s animals deserve far better treatment than this. Contact your local city council members and mayor and demand better from the animal shelter serving your community. We can do so much better and it is time our shelters operate this way.
In a blog from earlier this year, I disclosed New Jersey’s depressing animal shelter statistics. This blog explains why so many dogs are losing their lives in the state’s animal shelters and whether these facilities can end the killing.
Successful organizations set measurable goals and regularly monitor their performance. Examples include financial budgets, customer and employee satisfaction surveys, and product reliability metrics. Unfortunately, many animal shelters for far too long have failed to set lifesaving goals and standards. Municipalities, donors and volunteers need to know where their resources will be best utilized. Time and money are scarce resources and people should allocate these assets to organizations who will best utilize them. As a result, animal shelters need to set goals and hold their leadership and staff accountable for achieving these objectives.
Model Assesses New Jersey Animal Shelters’ Life Saving Performance
In order to assess how good of a job New Jersey animal shelters are doing, I’ve developed an analysis I call the “Life Saving Model.” While shelter performance is dependent on many variables, such as finances, facility design, local laws, etc., the most critical factor impacting potential life saving is animal holding capacity. Without having enough physical space and foster homes, a shelter might not have enough time to find loving homes for its animals. Shelters can overcome financial limitations through creative fundraising or recruiting more volunteers. Similarly, organizations can save their dogs despite having run down facilities if these groups enthusiastically implement policies to get animals into loving homes quickly. As a result, my analysis focuses on making the best use of space to save the maximum number of New Jersey and nearby states dogs.
The Life Saving Model measures the number of local animals a shelter should adopt out, rescue from other facilities, send to rescues or other shelters, and euthanize. The targeted outcomes take into account each facility’s physical capacity plus the amount of foster homes it should use and the number and types of dogs the organization receives from its community (i.e. strays, owner surrenders, cruelty/bite cases). I assume a target euthanasia rate, take the number of dogs actually returned to owners and then estimate how many community dogs a shelter should adopt out. To the extent space runs out, I then calculate how many dogs the shelter must send to rescues. If the shelter has excess space after properly serving its local community, the facility uses that room to rescue and adopt out dogs from nearby areas. The targeted results calculated from this model are compared to the actual or estimated actual results from each shelter below.
This year I expanded shelter capacity to include the number of foster homes shelters should use. Based on a target American Pets Alive and other progressive shelter directors communicated at this year’s American Pets Alive Conference, shelters should have 3% of their annual dog intake in foster homes at any one time. These estimates are based on what several no kill animal control shelters already accomplish. Given fostering increases capacity and provides more humane care to animals, it is critical shelters have large scale foster programs. Therefore, I added 3% of each shelter’s annual dog intake to the shelter’s physical capacity.
For shelters with animal control contracts, I place 10% of all dogs that are not reclaimed by owners into the targeted sent to rescue category. Austin Pets Alive used data from Austin Animal Center, which is the local municipal shelter, to determine large dogs with behavioral challenges are part of the last 10% of animals losing their lives. While shelters can save most of these dogs through behavioral rehabilitation and/or foster programs, I decided to put an estimate of these dogs into the sent to rescue category since that is another good outcome for these dogs.
My analysis puts a cap on the targeted numbers of dogs rescued from other shelters and adoptions. While my unmodified targeted numbers of rescued and adopted animals are quite achievable, I want to provide very conservative goals for New Jersey animals shelters. For example, the unmodified model resulted in a statewide per capita dog adoption rate of around 25% to 70% of the level found at some of the nation’s best animal control shelters. Similarly, the unmodified model yielded a statewide pit bull per capita adoption rate (2.3 pit bulls per 1,000 people) that is not much more than the pit bull per capita adoption rate at one of the best animal control shelters in the country. In my opinion, New Jersey shelters could more easily achieve that per capita pit bull adoption rate given my model includes far fewer dogs from competing breeds than those in this role model animal control shelter.
My modified analysis capped pit bull adoptions at 2 pit bulls per 1,000 people within each New Jersey county. In other words, the targeted numbers of dogs rescued from other shelters and adopted below are the lesser of
Number predicted by model
Number determined by capping pit bull adoptions at 2 pit bulls per 1,000 people in the county
In simple terms, a shelter is expected to achieve this per capita adoption rate unless the facility lacks enough space. If a shelter does not have sufficient room, it won’t have the time to reach all the potential adopters and requires assistance from rescues and/or other facilities. Given my model assumes 80% of rescued dogs are pit bull like dogs, my targeted numbers of dogs rescued and adopted are quite low as detailed in the section below. For example, shelters in counties where dog adoptions are capped have extra space that they do not use to adopt out other dog breeds.
To read specific details and assumptions used in the model, please see the Appendix at the end of this blog.
New Jersey Animal Shelters Contain Enough Space to Save All of New Jersey’s Dogs and Many More from Other States
New Jersey’s animal shelter system has enough space to save all of the state’s healthy and treatable dogs. The table below details the targeted numbers of dog outcomes the New Jersey animal shelter system should achieve. Out of the 21,614 New Jersey dogs coming into the state’s animal shelters in 2018, 10,684 and 1,619 dogs should have been adopted out and sent to other shelters/rescues by the facilities originally taking the dogs in. However, other New Jersey animal shelters had more than enough capacity to rescue the 1,619 dogs from space constrained facilities. Thus, New Jersey animal shelters should be able to able to adopt out every single healthy and treatable dog taken in from the state and not require any support from rescue organizations without physical facilities from a space perspective.
New Jersey animal shelters have enough excess space to save many dogs from out of state as well. Specifically, New Jersey animal shelters had enough physical capacity to rescue and adopt out 11,394 dogs from out of state after achieving a 95% live release rate for New Jersey dogs. To put this number into perspective, New Jersey animal shelters could make both New York City and Philadelphia no kill cities for dogs and increase those cities’ dog live release rates to 95% in 2018 as follows:
New York City – 1,288 additional dogs need saving
Philadelphia – 856 additional dogs need saving
Additionally, New Jersey animal shelters could save another 9,250 dogs from other locations outside of the state. Of course, some New Jersey animal shelters do pull some dogs from New York City and Philadelphia animal control shelters. However, most of these dogs are likely easy to adopt and therefore have short lengths of stay. As a result, the additional number of dogs New Jersey animal shelters could save from New York City, Philadelphia and elsewhere is probably not much lower than the figures above. Thus, New Jersey animal shelters could make New Jersey a no kill state for dogs as well as many other places.
These adoption goals are quite achievable when comparing the performance of well-run animal control shelters across the country. New Jersey animal shelters would only need to adopt out 2.7 dogs per 1,000 people in the state (1.4 dogs if no dogs rescued from out of state). As a comparison, recent per capita dog adoption numbers from several high performing no kill open admission shelters are as follows:
Lynchburg Humane Society (Lynchburg, Virginia) – 15.3 dogs per 1,000 people
Longmont Humane Society (Longmont, Colorado area) – 9.4 dogs per 1,000 people
Lake County Animal Shelter (Lake County, Florida) – 5.2 dogs per 1,000 people
Williamson County Animal Shelter (Williamson County, Texas) – 5.0 dogs per 1,000 people
Thus, many communities are already adopting out around two to six times as many dogs as the goal set for New Jersey animal shelters.
Some naysayers may claim New Jersey would have a more difficult time due to the state’s shelters taking in many pit bulls. However, this is a myth. My model estimates New Jersey animal shelters would need to adopt out roughly 0.5 pit bulls per 1,000 people to save 95% of New Jersey’s dogs. Our shelters would only need to adopt out around 1.5 pit bulls per 1,000 people if New Jersey shelters also rescued and adopted out the targeted number of pit bulls from other states. As a comparison, I estimate Longmont Humane Society adopts out 2.0 pit bulls per 1,000 people based on the number of pit bulls impounded in 2014 as a percentage of total dogs impounded in 2014 and multiplying that number by the 9.4 dogs per 1,000 people adoption rate in 2018. Furthermore, the pit bull adoption targets are even more reasonable given the model assumes there are roughly 1/6 of the number of dogs from other breeds to compete with in the New Jersey adoption market compared to the Longmont, Colorado area.
Animal Deaths Vary Widely at New Jersey Animal Shelters
The goal of any properly managed animal shelter is to save all of its healthy and treatable animals. In some cases, such as selective admission rescue oriented shelters, it is pretty easy to not kill animals. In addition, other animal shelters with easy to service animal control contracts (i.e. few animals impounded, most strays quickly returned to owners) can avoid unnecessary killing due to having lots of extra space. As a result, some shelters may have an easier time than others in preventing killing at their shelters.
The tables below detail how many dogs should lose their lives at each state animal shelter per my model and the actual numbers of dogs that did. All missing or lost dogs are assumed “dead” based on the assumption they died or went to a very bad place. Based on my review of a number of shelters’ underlying documents, virtually all of the dogs in the “Other” outcome category died or went missing. Shelters having the number of dogs losing their lives at or below my targets and above my targets are highlighted in green and red in the tables below.
The largest number of dogs unnecessarily dying occurred at a relatively small number of shelters. Overall, 1,108 dogs needlessly lost their lives at New Jersey animal shelters in 2018 (i.e. the sum of all shelters killing too many dogs). 13 out of 92 or 14% of the shelters accounted for 83% of the dogs unnecessarily losing their lives under the model’s assumptions. Associated Humane Societies’ three shelters needlessly killed 219 dogs per the model or 20% of the total dogs unnecessarily dying in the state’s shelters. Trenton Animal Shelter, Gloucester County Animal Shelter, Bergen County Animal Shelter and Paterson Animal Control, which all broke state law in recent years, needlessly killed 335 dogs per the model or 30% of the total dogs unnecessarily dying in the state’s shelters. Shelters with the greatest number of unnecessary dog deaths (assuming all dogs killed were local animals) are as follows:
Associated Humane Societies – Newark (158)
Trenton Animal Shelter (142)
Gloucester County Animal Shelter (121)
St. Hubert’s – Madison (116)
Humane Society of Atlantic County (69)
South Jersey Regional Animal Shelter (58)
Homeward Bound Pet Adoption Center (53)
Atlantic County Animal Shelter (39)
Paterson Animal Control (38)
Bergen County Animal Shelter (34)
Thus, the bulk of the dogs unnecessarily dying at New Jersey animals shelters occurs at a small number of facilities.
Most New Jersey Animal Shelters Require Little Rescue Assistance
Some animal shelters will require more support from rescues and animal shelters with excess space than others. If a shelter has relatively high intake, very limited space, and few stray dogs returned to owners, it will need more help than other shelters. In an ideal world, rescues would take all shelter animals. However, due to limited numbers of foster homes, lesser ability to find foster homes due to many rescue organizations’ small sizes, and most rescues’ restrictive adoption policies, all shelters cannot heavily rely on rescues. The tables below compare the number of dogs a shelter should transfer to other organizations per the model and the number of dogs actually sent to other animal welfare groups. Shelters marked in green are receiving less than the expected rescue support while facilities marked in red are receiving too much rescue help.
Overall, most New Jersey animal shelters require little rescue support if space-constrained facilities fast-track their most highly adoptable dogs. Shelter medicine experts advocate prioritizing the processing of highly adoptable animals to make the best use of space and reduce disease. For example, making sure these animals are the first to get spayed/neutered and vaccinated and receive microchips to ensure they can leave as soon as the shelter finds a good home.
51 shelters received too much help, 17 facilities received just enough assistance and 24 shelters received too little help from other animal welfare organizations. However, the excess dogs rescued (1,940 dogs) at shelters receiving too much assistance was far higher than the rescue deficits at other shelters (237 dogs) resulting in the state’s shelters sending 1,703 more dogs than needed to rescues and other animal welfare organizations. Some shelters, such as Elizabeth Animal Shelter and Paterson Animal Control, report transfers to rescues and other shelters as adoptions. While I made adjustments for these facilities based on my reviews of these facilities underlying records in past years, its certainly possible other shelters incorrectly reported their data (i.e. counting animals sent to rescues as adoptions). Nonetheless, the New Jersey shelter system as a whole is receiving enough rescue assistance, but some shelters are hurt by rescues pulling animals from less needy facilities.
Rescue groups and shelters with extra space should pull dogs from kill shelters with the highest rescue “target” numbers and deficits in the tables below. If shelters not needing rescue support get that extra help, these shelters will not take the steps necessary to properly run their facilities. As a result of enabling poorly performing shelters and not pulling dogs from truly space constrained facilities, rescuing dogs from shelters with enough space leads to less lifesaving.
Shelters receiving less than needed rescue support should also examine their own policies and performance. Are the shelter’s operating processes allowing too many animals to get sick and therefore discouraging organizations to rescue their animals due to subsequent medical costs? Does the shelter actively reach out to rescues/other shelters and treat them with respect? Does the shelter make it convenient for other organizations to pull their animals?
Given killing animals for space is intolerable, the space-constrained shelters need to expand their effective dog capacity. These facilities could use extra space in their buildings to house dogs on a short-term basis. These shelters can enter into arrangements with local veterinarians to house and adopt out some dogs. Additionally, creating a pet owner surrender prevention program, implementing a proper managed intake policy (i.e. where animals are impounded when in danger and waiting periods for owner surrenders are relatively short) and making serious efforts to return lost dogs to owners could free up space in these shelters. Finally, space-constrained shelters with multiple animal control contracts should terminate some of these arrangements to bring their capacity for care in line with the number of dogs they take in. As a result, space constrained shelters still need to take active steps to reduce killing rather than simply solely relying on rescue support.
In certain circumstances, it may make sense for shelters with excess space to send dogs to rescues. For example, a unique breed or a dog needing very specialized behavioral or medical rehabilitation. However, these cases are accounted for in my targeted sent to rescue figures for animal control shelters.
Most New Jersey Animal Shelters Fail to Come Close to Reaching Their Local Dog Adoption Potential
We can assess each shelter’s contribution to making New Jersey and nearby areas no kill. While a shelter may be able to avoid killing healthy and treatable animals, it still may not live up to its potential for adopting out local dogs. On the other hand, a space constrained shelter may kill healthy and treatable dogs, but still do a good job adopting animals out.
The tables below compare the number of dogs from New Jersey and nearby states each animal shelter should adopt out with the estimated number of local dogs actually adopted out.
Many rescue oriented shelters likely pull much easier to adopt dogs than the bulk of dogs needing to get rescued from local facilities. Thus, the results from rescue oriented shelters may look better than they actually are.
Few organizations reached or exceeded their adoption targets. Specifically, only 4 out of 92 shelters met the adoption goals computed by the Life Saving Model. Thus, the overwhelming number of New Jersey animal shelters need to step up their adoption efforts.
A number of other rescue oriented shelters exceeded their adoption targets, but this may at least partially be due to inaccurate records and the types of dogs they impounded. Common Sense for Animals operates more like a rescue oriented than an animal control shelter. While this organization exceeded its adoption targets, the shelter’s figures were off by 128 dogs using the methodology outlined in another blog. Beacon Animal Rescue also exceeded its adoption target, but this is likely due to this organization rescuing easier to adopt dogs from New Jersey shelters. Thus, I believe these rescue oriented shelters’ high local dog adoption numbers were due to inaccurate records or these organizations selecting easier to adopt local dogs.
Tri-Boro Animal Welfare’s and St. Hubert’s-Noah’s Ark’s higher than targeted local dog adoption results are a bit misleading. These facilities benefited from the method I used to cap adoptions in the county and reduce the adoption targets for these two shelters. For example, Tri-Boro Animal Welfare only reached 52% of its adoption target using my unadjusted model only taking the shelter’s physical space and targeted number of foster homes into account. Similarly, St. Hubert’s Noah’s Ark’s actual adoptions percentage of its targeted adoptions figure dropped from 271% to 111% when I looked at the unadjusted model. Since Morris County has many shelters that collectively have a very large capacity (i.e. very high adoption potential), my model reduces all Morris County animal shelters’ target adoptions to my county adoption cap. Therefore, these two shelters have relatively low dog adoption targets. Additionally, St. Hubert’s-Noah’s Ark may rescue a number of dogs from other St. Hubert’s facilities and those dogs may come from out of state. Thus, these shelters really didn’t do an excellent job adopting out local dogs.
Shelters adopting out the fewest animals in total relative to their targets were as follows:
Associated Humane Societies-Newark – 1,222 fewer dogs adopted than targeted
Monmouth SPCA – 775 fewer dogs adopted than targeted
Associated Humane Societies-Popcorn Park – 579 fewer dogs adopted than targeted
Plainfield Area Humane Society – 532 fewer dogs adopted than targeted
Tyco Animal Control – Paramus – 442 fewer dogs adopted than targeted
Burlington County Animal Shelter – 441 fewer dogs adopted than targeted
Trenton Animal Shelter – 396 fewer dogs adopted than targeted
Gloucester County Animal Shelter – 388 fewer dogs adopted than targeted
Paterson Animal Control – 387 fewer dogs adopted than targeted
Bergen County Animal Shelter – 384 fewer dogs adopted than targeted
St. Hubert’s – Madison – 281 fewer dogs adopted than targeted
Shake a Paw-Union – 281 fewer dogs adopted than targeted
Greyhound Angels – 278 fewer dogs adopted than targeted
New Jersey Humane Society – 250 fewer dogs adopted than targeted
Several shelters’ poor performance is quite predictable. Associated Humane Societies-Newark, Trenton Animal Shelter, Paterson Animal Shelter, Shake a Paw-Union, New Jersey Humane Society, Gloucester County Animal Shelter, Monmouth SPCA and Bergen County Animal Shelter had troublesome stories involving the shelters and/or prominent people affiliated with these organizations over the last several years. Tyco Animal Control-Paramus performed poorly due to this for profit company having a regressive view of animal sheltering. Shake a Paw-Union’s low local adoption numbers are also not surprising since it also operates a for profit pet store and transports almost all of its dogs it rescues from out of state. Similarly, St. Hubert’s-Madison, Monmouth SPCA, Greyhound Angels (due to it being a greyhound rescue oriented shelter) and Montclair Township Animal Shelter all transported in many dogs from outside of New Jersey during 2018. Burlington County Animal Shelter had a 200 local dog adoption decrease in 2018 due primarily to the facility sending more dogs to rescues and other shelters. Finally, Plainfield Area Humane Society’s local dog adoption deficit is quite disturbing since this organization could easily take on Plainfield’s dogs who currently go to the horrific and high kill Associated Humane Societies-Newark.
Shelters Fail to Use Excess Space to Save Local Dogs
To further examine New Jersey animal shelters’ performance in saving the state’s homeless dogs, I compared the targeted number of dogs each shelter should pull from nearby shelters and compared it to the number actually rescued from local facilities. I assume all reported out of state rescued dogs came from southern states or other far away places. While some of the out of state rescued dogs may have comes from nearby areas, I believe this is a small number and does not significantly impact the results.
Virtually all New Jersey animal shelters are failing to rescue the number of local dogs they should. 89 of the 92 shelters should rescue some dogs from other local shelters. In fact, 45 of the 89 shelters with targeted excess capacity failed to rescue even a single dog from a New Jersey animal shelter. Of the 89 shelters that should have rescued dogs, only four shelters met or exceeded their local dog rescue targets. However, three of those shelters, Beacon Animal Rescue, St. Hubert’s-Noah’s Ark and Tri-Boro Animal Welfare, may not have truly helped the number of medium to large size local dogs they should based on these shelters taking easier to adopt animals and possibly out of state animals (i.e. St. Hubert’s-Noah’s Ark may have rescued out of state transported dogs from other St. Hubert’s facilities that originally came from the south).
As mentioned above, many shelters local rescue numbers are inflated due to these organizations cherry picking highly adoptable animals to rescue. Thus, nearly all New Jersey animal shelters with targeted excess capacity are failing to do their share in ending the killing of local healthy and treatable dogs.
Shelters can overcome challenges in rescuing dogs from outside their service area. In some cases, municipalities may frown on government run shelters using taxpayer funds to rescue dogs from elsewhere. However, shelter directors at these facilities can encourage individuals to form a non-profit or raise money on their own to pay for these rescued dogs. Additionally, shelters with limited capacity or even some of the well-off private shelters could contribute funding for each dog rescued. For example, Maddie’s Fund paid an approximate $160 subsidy to rescues pulling dogs from New York Animal Care & Control. Similarly, private shelters with excess space, but limited financial resources, could expand their fundraising efforts to save more local dogs. Thus, perceived obstacles to rescuing local dogs can and should be overcome.
New Jersey Animal Shelters Need to Form Life-Saving Coalitions
The improper allocation of space within the state’s animal shelter system requires organizations to form coalitions. While putting a competent and compassionate director in every shelter would likely be even more effective, that will likely take time to do. No kill coalitions between animal control facilities and selective admission shelters have been used in places, such as Portland, Oregon, Reno, Nevada, Jacksonville, Florida and Austin, Texas to radically increase life saving. Maddie’s Fund, which has supported using coalitions for over a decade, has many resources for organizations seeking to collaborate with each other. Thus, New Jersey animal shelters need to formally work together, develop quantifiable and measurable goals (such as the targeted outcomes in this blog), and hold each organization accountable for meeting these benchmarks.
Sobering Results Require Shelter Leaders to Critically Examine Themselves
Shelters should examine the reasons why their adoption numbers fall far short of these benchmarks. In some cases, shelters need to expand the hours they are open for adoptions. Many shelters should switch from an overly judgmental adoption process based on black and white rules to a conversational one focused on educating the adopter. Organizations will need to radically increase their off-site events and do same day adoptions. Similarly, many shelters must reduce adoption fees and run frequent promotions. Executive Directors should monitor the latest life-saving programs on Maddie’s Fund’s, American Pets Alive Conference’s, and the Best Friends National Conference’s web sites and put some of these policies into place. Shelter management teams will need to ensure their facilities are clean and customers are treated with respect (this can be measured by encouraging the public to complete surveys). Thus, poorly performing shelters need to stop making excuses and do what it takes to reach their adoption potential.
We can turn New Jersey, New York City and Philadelphia into no kill communities. It is time we give our money and volunteer efforts to organizations who raise their performance to help us reach that goal. To do otherwise, would betray all the animals whose lives are on the line.
Appendix – Life Saving Model Assumptions
The Life Saving Model utilizes the following basic animal shelter population equations to calculate the targeted dog outcomes for each facility:
Daily capacity or population = Daily animal intake x average length of stay
Average length of stay = Daily capacity or population/daily intake
Each shelter’s community dog intake (i.e. owner surrenders, strays, cruelty bite cases), number of dogs returned to owners, and maximum dog capacity were taken from its 2018 “Shelter/Pound Annual Report” submitted to the New Jersey Department of Health. Additionally, I added 3% of each shelter’s annual dog intake to account for foster capacity shelters should use based on American Pets Alive guidelines. Thus, total dog capacity equaled the shelter’s capacity plus foster capacity.
This data was then used as follows:
Community dog intake and dogs returned to owners were initially estimated for each month by dividing the annual figures by 12. In order to take into account the extra space in low intake months and reduced space in high intake months, we multiply that number by each month’s percentage of the average month. For example, assume 240 dogs were taken in during the year and the average month equals 20 dogs (240/12). In July, the dog intake is 120% higher than the average month and we therefore multiply 20 dogs by 1.2 to equal 24 dogs. If 120 dogs were returned to owners during the year, the estimated number of dogs returned to owners in July would equal 12 dogs (120/12 = 10; 10*1.2). The monthly intake percentages were based off the average of the 2018 dog intake data on New York Animal Care & Control’s and ACCT Philly’s web sites.
The estimated number of community dogs returned to owners each month are then assumed to stay 5 days on average at shelters based on data from other shelters across the country. If anything, this estimate is conservative (i.e. average length of stay for dogs returned to owners may be less than 5 days and therefore frees up more shelter space for adoptions) based on some shelters returning the bulk of their dogs to owners within 3 days.
The number of community dogs euthanized (including animals who died or are missing) is set to equal 5% of intake. 5% is a reasonable standard euthanasia rate for shelters in New Jersey to meet given few vulnerable stray puppies (i.e. who could die or require euthanasia) arrive in the state’s animal shelters. The average length of stay for euthanized dogs is assumed to equal 14.5 days. Half of dogs are assumed euthanized for untreatable aggression towards people and 21 days is the time estimated to make that determination. The other half of dogs are assumed euthanized for severe and untreatable health issues and I estimate these dogs are euthanized after 8 days (subsequent to the end of the stray hold and owner surrender protection periods).
Adopted dogs are assumed to stay at shelters for varying lengths of time. Adoption length of stay was based on data from a study in the Journal of Applied Animal Welfare and the figures used (except for space-constrained shelters) are located in a prior blog on pit bull adoption. The data primarily comes from Tompkins County SPCA during a time it saved over 90% of its dogs. This was a fairly conservative data set to use as other no kill open admission shelters’ average length of stay are substantially shorter. Specifically, the following assumptions were made:
80% and 20% of each communities dogs (including pit bulls) were adults 1 year and older and under 1 year.
Pit bulls were assumed to comprise 50%, 35% and 25% of community dog intake at poor, middle/upper middle class, and wealthy area animal control shelters. While some shelters may have pit bulls comprising more than 50% of their shelter dog population at a given time, this is due to pit bulls longer average length of stay. For example, a shelter with pit bulls making up 50% of their dog intake and pit bulls having an average length of stay three times longer than other dogs will have pit bulls constituting 75% of the dog population. Shelters without animal control contracts were assumed to only have pit bulls make up 10% of their community dogs (i.e. strays and owner surrenders) based on most of these shelters’ highly selective admission practices.
Pit bull adoption length of stay was taken directly from the Journal of Applied Animal Welfare study. The average adoption lengths of stay for other breeds from this study were averaged and used for dogs other than pit bulls in the analysis
Space constrained shelters were assumed to adopt out their easiest to adopt animals first until they ran out of space. To estimate the average adoption length of stay, I used pit bull adoption length of stay data from Greenhill Humane Society from March 2013 through May 2015. I broke the adoption length of stay data into 5 groups that each made up 20% of the data. The average adoption length of stay for each of these 5 groups was calculated. The average adoption length of stay of each group was divided by the average length of stay for all of the adopted pit bulls in the Greenhill Humane Society data set. Those percentages were then multiplied by the average dog adoption length of stay determined in the previous bullet and used to determine the adoption lengths of stay used for space-constrained shelters.
Dogs transferred to rescue or other facilities are assumed to stay at shelters 8 days on average based on the assumption strays can’t be released until the 7 day hold period elapses.
Community dogs not returned to owners or euthanized are initially assumed as adopted for each month. However, if the calculated length of stay exceeds the shelter’s required length of stay, dogs are moved from adoption (i.e. longer length of stay) to rescue (i.e. shorter length of stay) until the calculated length of stay each month approximately equals the required length of stay.
Animal control shelters have a minimum of 10% of unclaimed dogs go to rescues. To the extent shelters transfer 10% of unclaimed dogs to rescues despite having space (i.e. reclassifying dogs from adoptions with a longer length of stay to rescues with a shorter length of stay), I do not require these facilities to use that space to rescue additional dogs.
Required length of stay = Shelter’s total capacity/adjusted daily intake for the month. Adjusted daily intake for month = Adjusted monthly intake per first bullet above/the number of days in the month.
Shelters with excess capacity are assumed to use the extra space to rescue and adopt out dogs from other New Jersey animal shelters. To the extent all healthy and treatable New Jersey animal shelter dogs are saved, I assume additional dogs are pulled from nearby states with similar types of dogs. I assume all rescued dogs will not be killed since the transferring and receiving shelters should evaluate these dogs’ behavior. Based on pit bull type dogs having longer lengths of stay at shelters, I assume 80% of dogs rescued from local animal shelters are pit bulls and 20% are non-pit bulls. 80% and 20% of pit bull and non-pit bull type dogs are considered 1 year and older and under 1 year. The average length of stay for rescued pit bulls and other dogs are the same as the adoption length of stay figures above.
Each month’s targeted outcomes are added to determine how many local dogs New Jersey animal shelters should adopt out, send to rescue, rescue from other nearby animal shelters and euthanize.
The targeted number of dogs rescued and adopted were capped at 2 pit bulls per 1,000 people in each county. If the model yielded a higher result than this cap, the targeted numbers of dogs adopted were set to equal to this cap using the pit bull percentage assumptions above. For shelters in these counties (except Passaic County), I calculated the cap at the county level and then reduced the number of cats adopted for the county to equal the cap. I excluded West Milford from Passaic County due the town’s large distance from the population centers in the rest of the county. Each shelter’s percentage of total targeted adoptions in the county from the unmodified model were applied to the the total reduction in the number of adoptions in the county to yield the targeted numbers of dogs adopted in the modified model. If the shelter also rescued animals from other shelters, the rescued numbers were also reduced since I assume rescued animals are adopted.
Recently, I wrote a blog discussing decreased killing at New Jersey animal shelters in 2018. This blog will explore the 2018 statistics in more detail and assess the current status of the state’s animal shelters.
Most New Jersey animal shelters voluntarily report detailed data to state authorities. Last month, I shared the 2018 summary statistics for New Jersey animal shelters on my Facebook page. Each year, the New Jersey Department of Health requests each licensed animal shelter in the state to submit animal shelter data for the previous year. Animal shelters voluntarily submit this data in the “Shelter/Pound Annual Report.” The New Jersey Department of Health takes these Shelter/Pound Annual Reports and compiles the number of dogs, cats and other animals impounded, redeemed, adopted and euthanized to prepare its Animal Intake and Disposition report. However, the Shelter/Pound Annual Reports include additional information on how animals were impounded (i.e. strays, owner surrenders, rescued from in-state facilities, rescued from out of state shelters, and cruelty/bite cases/other) and disposed of (i.e. returned to owner, adopted, sent to rescue/another shelter, and died/missing/other outcome). Additionally, the Shelter/Pound Annual Reports include the number of animals in shelters at the beginning and end of the year as well as the maximum number of animals facilities can hold. Thus, the Shelter/Pound Annual Reports include very important data not found in the New Jersey Department of Health’s summary report.
I compiled the data from these reports and analyze the results in this blog. 2018 statistics for each New Jersey animal shelter are listed at this link. You can also view each “Shelter/Pound Annual Report” at this link.
Garbage Data Raises Serious Questions About New Jersey Animal Shelters’ Statistics
Most New Jersey animal shelters do not properly account for their animals. Simple math dictates the number of animals at a facility at the beginning of the year, plus all animals coming in during the year, less all animals leaving for the period, should equal the number of animals a shelter has at the end of the year. Stunningly, 56 out of 92 shelters reporting these dog statistics and 59 out of 91 facilities submitting this cat data failed to get this right. This raises serious questions about the accuracy of these shelters’ reported statistics. 32 of the 56 shelters with flawed dog statistics and 34 of the 59 facilities with incorrect cat statistics should have had more animals at the end of the year than reported. While these errors could have been due to incorrect counts of the number of animals at facilities, these shelters may have not recorded outcomes, such as animals who were killed, died, or went missing. To put it another way, 2,002 cats and dogs should have had outcomes reported and did not. Thus, there is the potential that as many as 2,002 additional dogs and cats were killed, died or went missing from New Jersey animal shelters than were reported in 2018.
Even worse, a number of animal shelters reported having a different number of animals at the end of 2017 and at the beginning of 2018. Obviously, shelters should report the same number of animals at the end of the prior year and the start of the current year. However, 32 of 92 shelters reported different numbers of dogs at the end of 2017 and the beginning of 2018. Similarly, 37 of 91 shelters reported different numbers of cats at the end of 2017 and the beginning of 2018. The worst offenders are listed in the tables below:
Shelters may have failed to classify animals adopted out and sent to rescues properly. Both Paterson Animal Control and Elizabeth Animal Shelter reported no animals were sent to rescues and all dogs and cats leaving their facilities alive were owner reclaims or adoptions. However, intake and disposition records I reviewed at both of these shelters in recent years revealed almost all “adopted” animals are actually rescued. One has to wonder how many other facilities failed to properly classify adoptions and rescues properly. This data is very important as it provides details on the burden rescues and other shelters are taking on from these facilities.
We need better oversight of New Jersey animal shelters’ data reporting. Currently, these statistics are voluntarily reported and most shelters are not taking this seriously. For example, I noticed a large number of reports were submitted many months after the end of the year. This data should be easy to compile since facilities can utilize animal shelter software programs, some of which are free, to do this task. Furthermore, New Jersey animal shelter laws mandate facilities maintain much of the raw data found in the Shelter/Pound Annual Report. Unfortunately, New Jersey Department of Health inspections routinely find shelters do not properly keep records on animals. We need to make the data reporting mandatory for animal shelters as the shelter reform bill, S725, does along with serious penalties for significant errors (especially if deliberate). In order for animal shelters to take data reporting seriously, we may also need to require audits of these reports. Thus, these results show we need stronger laws and the New Jersey Department of Health to play a greater role in ensuring reported animal shelter statistics are in fact accurate.
Despite the errors in these reports, the data provided still reveals important information.
More Animals Losing Their Lives in New Jersey Animal Shelters Than Disclosed in Summary Report
The more detailed data in the Shelter/Pound Annual Reports allows one to more critically examine the percentage of locally impounded animals dying in New Jersey’s animal shelters. The following table summarizes my analysis of the kill rate calculated from the New Jersey Department of Health’s summary report and the data reported in the Shelter/Pound Annual Reports.
This year I revised the cat statistics to remove an estimate of the cats St. Hubert’s transfers in and quickly transfers out through its Sister Shelter WayStation program. Previously, I made this adjustment only for dogs. Since St. Hubert’s is effectively acting as a middle man and not holding these animals very long, it makes sense to exclude these dogs and cats from the various kill rate statistics. If I did not exclude these animals, I would understate the dog and cat kill rates due to inflated intakes and outcomes numbers. Therefore, I removed all of St. Hubert’s dogs transferred out from the intake and outcomes figures in the metrics. Since St. Hubert’s primarily uses the Sister Shelter Waystation program to quickly transfer in cats and send them to out of state facilities, I only backed out the cats St. Hubert’s transferred to out of state organizations in the various kill rates. This adjustment increased the dog kill rate (intake) from 5.5 to 6.3% and the cat kill rate (intake) from 16.1% to 16.3%.
The Animal Intake and Disposition report prepared by the New Jersey Department of Health only allows one to calculate the number of animals killed as a percentage of total animals impounded or intake. I prefer calculating the kill rate as a percentage of outcomes rather than intake as this metric directly compares positive and negative outcomes. Using intake may depress the kill rate since shelters can simply hold animals for a long time to the point of overcrowding. Calculating the kill rate based on outcomes rather than intake caused the dog kill rate to increase from 6.3% to 6.4% and the cat kill rate to increase from 16.3% to 16.7%.
To calculate the statewide kill rate, we must also back out transfers from one New Jersey animal shelter to another state facility to avoid counting animals still in the state’s shelter system or registering two outcomes for the same animal (i.e. one New Jersey animal shelter transfers a dog or cat to another state facility which then adopts out the animal). This adjustment increases the dog kill rate from 6.4% to 6.8% and the cat kill rate from 16.7% to 18.0%.
In addition, we should increase the kill rate for animals who died or went missing in shelters. In the past, I’ve labeled this metric the death rate as these animals are likely dead or in a very bad situation. Unfortunately, the Shelter/Pound Annual Report includes animals who died or went missing in the “Other” outcome category. The “Other” category contains positive live releases, such as TNR for cats, at a few shelters. While including the “Other” category in the death rate for most shelters is appropriate (i.e. those facilities that don’t do TNR or don’t include cats released through TNR programs in “Other” outcomes), I’m no longer doing this due to an increasing number of shelters implementing TNR. Instead, I calculated the kill rate by subtracting out “Other” outcomes from total outcomes. If a shelter specifies the number of animals included in “Other” that left the shelter alive, I count this as “Other Live Release” and do not back these amounts out of total outcomes. After making this adjustment, the dog kill rate remained at 6.8% and the cat kill rate also stayed at 18.0%. For those interested in seeing the estimated death rates, you can find them in the supporting spreadsheet.
Also, many shelters transport easy to adopt animals from out of state which artificially increases live release rates. To properly calculate the percentage of New Jersey animals losing their lives, we need to adjust for transports. Unfortunately, shelters don’t break out their save rates by local and out of state animals. However, most likely nearly all of the out of state animals (primarily puppies and easy to adopt dogs and cats) make it out of shelters alive. Therefore, I back out the number of out of state transports from total outcomes to estimate the local kill rate. This adjustment increases the New Jersey dog kill rate from 6.8% to 9.2% and the state’s cat kill rate from 18.0 to 19.3%.
Also, I estimate a maximum local kill rate by including the number of unaccounted for animals described in the section above. Making this adjustment increases the maximum potential New Jersey dog kill rate from 9.2 to 12.9% and the maximum potential state cat kill rate from 19.3% to 21.3%.
Some animal shelters quickly return large percentages of their animals to owners. At these shelters, the populations served are typically well-off and animals are licensed and have microchips. To account for the animals facilities actually have to shelter, I calculated a kill rate for non-reclaimed animals and a maximum potential kill rate for non-reclaimed local animals. The non-reclaimed kill rate and maximum potential kill rate for dogs is 9.7% and 21.0%. Non-reclaimed cats had a 20.4% kill rate and a 22.9% maximum potential kill rate. Thus, the percentage of New Jersey animals losing their lives in our state’s animal shelters may be much higher than the state summary report suggests.
Kill Rates Extremely High at a Number of New Jersey Animal Shelters
Dogs and cats are likely to lose their lives at a number of New Jersey animal shelters. Shelters with the highest kill rates for dogs and cats (excluding very low intake facilities) are listed in the following tables:
Thus, both dogs and cats have a very good chance of leaving many New Jersey animal shelters dead rather than alive.
In terms of raw numbers, the following shelters killed the most animals:
Many shelters fail to account for large numbers of their animals. As discussed above, a shelter’s number of animals at the end of the year should be calculated as follows:
Beginning number of animals + animals impounded – animals leaving the shelter
Unfortunately, a large number of shelters take in far more animals than they can explain where they went. Shelters having the highest numbers of unaccounted for dogs and cats are listed in the following tables:
Dog and cat kill rates at many shelters may be even higher if these unaccounted for animals are counted as killed. If we only consider animal shelters which reported transporting few or no animals in 2018, facilities with the highest dog and cat kill rates considering the unaccounted for animals described above are as follows:
Thus, the plight of dogs and cats may be far worse in New Jersey animal shelters when we consider the unaccounted for animals.
Shelters Turn Their Backs on New Jersey’s Animals
New Jersey animal shelters rescue far more dogs from out of state than from other New Jersey animal shelters. Specifically, New Jersey animal shelters transferred in 10,131 dogs from out of state animal shelters and only rescued 2,399 dogs from other New Jersey animal shelters. However, St. Hubert’s frequently transfers a substantial number of its transports quickly to its partners in New Jersey and other states. If I back out St. Hubert’s transfers of dogs to out of state organizations, the number of transports decreases from 10,131 dogs to 6,360 dogs. While the state’s local kill rate decreased in 2018, it is likely the local kill rate would have decreased by more if not for the massive number of out of state transports.
While perhaps some shelters, such as Animal Alliance in Lambertville, take animals from nearby New York or Pennsylvania animal control shelters, the overwhelming majority of these dogs most certainly came from down south. In fact, New Jersey animal shelters transported more dogs from out of state than dogs who were killed in New Jersey animal shelters. This number does not include additional out of state dogs transported into New Jersey by rescues operating without a physical facility. Shelters transporting the most dogs from out of state were as follows:
Shelters Do Far Worse with Animals Requiring New Homes
Since dogs reclaimed by their owners typically have licenses and/or microchips and quickly leave the shelter, its informative to look at dogs shelters have to find new homes for. To get a better idea of how organizations are doing with animals they actually have to shelter, I also examined what percentage of non-reclaimed dogs lose their lives at each facility. Shelters with the highest non-reclaimed dogs kill rates are as follows:
Shelters with the highest maximum non-reclaimed dogs kill rates are as follows (excluding facilities that reported transporting many dogs in and taking very few animals in):
Shelters Leave Animal Enclosures Empty While Dogs and Cats Die
New Jersey animal shelters fail to use their space to save animals. Based on the average number of animals at all of New Jersey’s animal shelters at the beginning and the end of 2018, only 62% of dog and 75% of cat capacity was used. Given December is a low intake month, I also increased these populations to an average intake month. This adjustment only raised the dog capacity utilization to 70%. While this adjustment did increase the cat capacity utilization to over 100%, it is highly unlikely this happened in reality. Shelter inspection reports I’ve reviewed often did not reveal significantly larger dog and cat populations in the summer and winter months. This is likely due to the influx of highly adoptable kittens having short lengths of stay and shelters killing cats with empty cages.
Many animal shelters with low kill rates failed to rescue animals with their excess space. Additionally, other shelters used little of their available space and still killed a large percentage of their animals. Some examples after increasing the population (and therefore capacity utilization) based on the adjustment discussed above are as follows:
Thus, many New Jersey animal shelters are killing dogs and cats despite having ample space to house these animals.
New Jersey’s animal shelters continue to fail the state’s animals. The state’s animal shelters only impound 8.6 dogs and cats per 1,000 New Jersey residents. If we just count animals originating from New Jersey, the state’s animal shelters only impound 7.4 dogs and cats per 1,000 people. As a comparison, the average community in the country impounds anywhere from 14 animals per 1,000 residents based on estimates from Animal People Newspaper and No Kill Movement. Despite New Jersey shelters impounding a fraction of the animals other no kill communities take in on a per capita basis, the state’s animal control facilities continue to kill and allow animals to die under their care. Even worse, many of these shelters can’t even properly keep track of how many animals leave their facilities dead or alive. Our state’s animals deserve far better treatment than this. Contact your local city council members and mayor and demand better from the animal shelter serving your community. We can do so much better and it is time our shelters operate this way.
In a blog from earlier this year, I disclosed New Jersey’s depressing animal shelter statistics. This blog explains why so many dogs are losing their lives in the state’s animal shelters and whether these facilities can end the killing.
Successful organizations set measurable goals and regularly monitor their performance. Examples include financial budgets, customer and employee satisfaction surveys, and product reliability metrics. Unfortunately, many animal shelters for far too long have failed to set lifesaving goals and standards. Municipalities, donors and volunteers need to know where their resources will be best utilized. Time and money are scarce resources and people should allocate these assets to organizations who will best utilize them. As a result, animal shelters need to set goals and hold their leadership and staff accountable for achieving these objectives.
Model Assesses New Jersey Animal Shelters’ Life Saving Performance
In order to assess how good of a job New Jersey animal shelters are doing, I’ve developed an analysis I call the “Life Saving Model.” While shelter performance is dependent on many variables, such as finances, facility design, local laws, etc., the most critical factor impacting potential life saving is physical space. Without having enough physical space, a shelter might not have enough time to find loving homes for its animals. Shelters can overcome financial limitations through creative fundraising or recruiting more volunteers. Similarly, organizations can save their dogs despite having run down facilities if these groups enthusiastically implement policies to get animals into loving homes quickly. As a result, my analysis focuses on making the best use of space to save the maximum number of New Jersey and nearby states dogs.
The Life Saving Model measures the number of local animals a shelter should adopt out, rescue from other facilities, send to rescues or other shelters, and euthanize. The targeted outcomes take into account each facility’s physical capacity and the number and types of dogs the organization receives from its community (i.e. strays, owner surrenders, cruelty/bite cases). I assume a target euthanasia rate, take the number of dogs actually returned to owners and then estimate how many community dogs a shelter should adopt out. To the extent space runs out, I then calculate how many dogs the shelter must send to rescues. If the shelter has excess space after properly serving its local community, the facility uses that room to rescue and adopt out dogs from nearby areas. The targeted results calculated from this model are compared to the actual or estimated actual results from each shelter below.
For shelters with animal control contracts, I place 10% of all dogs that are not reclaimed by owners into the targeted sent to rescue category. Austin Pets Alive used data from Austin Animal Center, which is the local municipal shelter, to determine large dogs with behavioral challenges are part of the last 10% of animals losing their lives. While shelters can save most of these dogs through behavioral rehabilitation and/or foster programs, I decided to put an estimate of these dogs into the sent to rescue category since that is another good outcome for these dogs.
My analysis puts a cap on the targeted numbers of dogs rescued from other shelters and adoptions. While my unmodified targeted numbers of rescued and adopted animals are quite achievable, I want to provide very conservative goals for New Jersey animals shelters. For example, the unmodified model resulted in a statewide per capita dog adoption rate of around 30% to 70% of the level found at some of the nation’s best animal control shelters. Similarly, the unmodified model yielded a statewide pit bull per capita adoption rate (2.0 pit bulls per 1,000 people) that is less than the pit bull per capita adoption rate at one of the best animal control shelters in the country. In my opinion, New Jersey shelters could more easily achieve that per capita pit bull adoption rate given my model includes far fewer dogs from competing breeds than those in this role model animal control shelter.
My modified analysis capped pit bull adoptions at 2 pit bulls per 1,000 people within each New Jersey county. In other words, the targeted numbers of dogs rescued from other shelters and adopted below are the lesser of
Number predicted by model
Number determined by capping pit bull adoptions at 2 pit bulls per 1,000 people in the county
In simple terms, a shelter is expected to achieve this per capita adoption rate unless the facility lacks enough space. If a shelter does not have sufficient room, it won’t have the time to reach all the potential adopters and requires assistance from rescues and/or other facilities. Given my model assumes 80% of rescued dogs are pit bull like dogs, my targeted numbers of dogs rescued and adopted are quite low as detailed in the section below. For example, shelters in counties where dog adoptions are capped have extra space that they do not use to adopt out other dog breeds.
To read specific details and assumptions used in the model, please see the Appendix at the end of this blog.
New Jersey Animal Shelters Contain Enough Space to Save All of New Jersey’s Dogs and Many More from Other States
New Jersey’s animal shelter system has enough space to save all of the state’s healthy and treatable dogs. The table below details the targeted numbers of dog outcomes the New Jersey animal shelter system should achieve. Out of the 22,391 New Jersey dogs coming into the state’s animal shelters in 2017, 10,928 and 1,590 dogs should have been adopted out and sent to other shelters/rescues by the facilities originally taking the dogs in. However, other New Jersey animal shelters had more than enough capacity to rescue the 1,590 dogs from space constrained facilities. Thus, New Jersey animal shelters should be able to able to adopt out every single healthy and treatable dog taken in from the state and not require any support from rescue organizations without physical facilities from a space perspective.
New Jersey animal shelters have enough excess space to save many dogs from out of state as well. Specifically, New Jersey animal shelters had enough physical capacity to rescue and adopt out 10,070 dogs from out of state after achieving a 95% live release rate for New Jersey dogs. To put this number into perspective, New Jersey animal shelters could make both New York City and Philadelphia no kill cities for dogs and increase those cities’ dog live release rates to 95% in 2017 as follows:
New York City – 1,304 additional dogs need saving
Philadelphia – 935 additional dogs need saving
Additionally, New Jersey animal shelters could save another 7,831 dogs from other locations outside of the state. Of course, some New Jersey animal shelters do pull some dogs from New York City and Philadelphia animal control shelters. However, most of these dogs are likely easy to adopt and therefore have short lengths of stay. As a result, the additional number of dogs New Jersey animal shelters could save from New York City, Philadelphia and elsewhere is probably not much lower than the figures above. Thus, New Jersey animal shelters could make New Jersey a no kill state for dogs as well as many other places.
These adoption goals are quite achievable when comparing the performance of well-run animal control shelters across the country. New Jersey animal shelters would only need to adopt out 2.5 dogs per 1,000 people in the state (1.4 dogs if no dogs rescued from out of state). As a comparison, recent per capita dog adoption numbers from several high performing no kill open admission shelters are as follows:
Lynchburg Humane Society (Lynchburg, Virginia) – 10.7 dogs per 1,000 people
Longmont Humane Society (Longmont, Colorado area) – 10.5 dogs per 1,000 people
Nevada Humane Society (Reno, Nevada and Carson City, Nevada areas) – 8.5 dogs per 1,000 people
KC Pet Project (Kansas City, Missouri) – 6.5 dogs per 1,000 people
Humane Society of Fremont County (Fremont County, Colorado) – 5.8 dogs per 1,000 people
Williamson County Animal Shelter (Williamson County, Texas) – 5.5 dogs per 1,000 people
Lake County Animal Shelter (Lake County, Florida) – 4.6 dogs per 1,000 people
Thus, many communities are already adopting out around two to four times as many dogs as the goal set for New Jersey animal shelters.
Some naysayers may claim New Jersey would have a more difficult time due to the state’s shelters taking in many pit bulls. However, this is a myth. My model estimates New Jersey animal shelters would need to adopt out roughly 0.5 pit bulls per 1,000 people to save 95% of New Jersey’s dogs. Our shelters would only need to adopt out around 1.4 pit bulls per 1,000 people if New Jersey shelters also rescued and adopted out the targeted number of pit bulls from other states. As a comparison, I estimate Longmont Humane Society adopts out 2.2 pit bulls per 1,000 people based on the number of pit bulls impounded in 2014 as a percentage of total dogs impounded in 2014 and multiplying that number by the 10.5 dogs per 1,000 people adoption rate in 2017. Furthermore, the pit bull adoption targets are even more reasonable given the model assumes there are roughly 1/8 of the number of dogs from other breeds to compete with in the New Jersey adoption market compared to the Longmont, Colorado area.
Animal Deaths Vary Widely at New Jersey Animal Shelters
The goal of any properly managed animal shelter is to save all of its healthy and treatable animals. In some cases, such as selective admission rescue oriented shelters, it is pretty easy to not kill animals. In addition, other animal shelters with easy to service animal control contracts (i.e. few animals impounded, most strays quickly returned to owners) can avoid unnecessary killing due to having lots of extra space. As a result, some shelters may have an easier time than others in preventing killing at their shelters.
The tables below detail the estimated dog death rates. All dogs missing are assumed “dead” based on the assumption they died or went to a very bad place. As discussed in a prior blog, the estimated death rate includes “Other” outcomes as animals who died or went missing along with dogs reported as killed. Based on my review of a number of shelters’ underlying documents, virtually all of the dogs in the “Other” outcome category died or went missing. Shelters having estimated dog death rates equal to or less than and greater than 5% are highlighted in green and red in the table below.
The Humane Society of Atlantic County and St. Hubert’s-Noah’s Ark had unusually high estimated dog death rates of 11% and 8% (St. Hubert’s estimated death rates reflect an adjustment for the organization’s Sister Shelter Waystation program discussed in this blog). These facilities’ estimated death rates are very high for rescue oriented shelters with no animal control contracts and raise serious questions about how life and death decisions are made by these organizations. The estimated death rates at other rescue oriented shelters, such as Ramapo-Bergen Animal Refuge and Animal Welfare Association (both had estimated dog death rates of 1%) are much lower than the Humane Society of Atlantic County and St. Hubert’s-Noah’s Ark. Thus, the Humane Society of Atlantic County’s and St. Hubert’s-Noah’s Ark’s estimated dog deaths rate are extremely high for rescue oriented shelters.
Certain shelters may kill a larger percentage of local animals. Since a number of both rescue oriented and shelters with animal control contracts transport large numbers of highly adoptable dogs from out of state, its helpful to look at their estimated death rates for just local animals. Unfortunately, shelters do not provide data to precisely compute this local dog death rate. If we assume these shelters only killed the generally less adoptable local dogs, we can estimate the local dog death rate as follows:
Total Dogs Killed and in Other Outcomes (died, missing)/(Total Dogs Impounded-Total Dogs Transported In from Other States)
When we calculate this estimated local death rate, a number of shelters stand out. The Humane Society of Atlantic County’s estimated dog death rate rises from 11% to 21% under this calculation. Additionally, St. Hubert’s-Madison’s estimated dog death rate increases from 10% to 48% under this calculation. While these facilities may not be only killing local dogs and therefore may have lower local dog death rates, I think its very possible these shelters’ local dog death rates are significantly higher than their total estimated dog death rates in the tables below.
The largest number of dogs unnecessarily dying occurred at a relatively small number of shelters. Specifically, 12 out of 93 or 13% of the shelters accounted for 80% of the estimated 1,507 dogs unnecessarily losing their lives under the model’s assumptions. In fact, Associated Humane Societies-Newark, which broke state shelter law left and right in 2017 per New Jersey Department of Health inspection reports, and Trenton Animal Shelter, which also violated state shelter law last year per a state health department inspection report, accounted for 31% of the dogs needlessly losing their lives at New Jersey animal shelters. Shelters with the greatest number of unnecessary dog deaths (assuming all dogs killed were local animals) are as follows:
Associated Humane Societies – Newark (338)
St. Hubert’s – Madison (138)
Trenton Animal Shelter (134)
Gloucester County Animal Shelter (128)
Camden County Animal Shelter (83)
Hamilton Township Animal Shelter (76)
Associated Humane Societies – Tinton Falls (66)
Thus, the bulk of the dogs unnecessarily dying at New Jersey animals shelters occurs at a small number of facilities.
Most New Jersey Animal Shelters Require Little Rescue Assistance
Some animal shelters will require more support from rescues and animal shelters with excess space than others. If a shelter has relatively high intake, very limited space, and few stray dogs returned to owners, it will need more help than other shelters. In an ideal world, rescues would take all shelter animals. However, due to limited numbers of foster homes, lesser ability to find foster homes due to many rescue organizations’ small sizes, and most rescues’ restrictive adoption policies, all shelters cannot heavily rely on rescues. The tables below compare the number of dogs a shelter should transfer to other organizations per the model and the number of dogs actually sent to other animal welfare groups. Shelters marked in green are receiving less than the expected rescue support while facilities marked in red are receiving too much rescue help.
Overall, most New Jersey animal shelters require little rescue support if space-constrained facilities fast-track their most highly adoptable dogs. Shelter medicine experts advocate prioritizing the processing of highly adoptable animals to make the best use of space and reduce disease. For example, making sure these animals are the first to get spayed/neutered and vaccinated and receive microchips to ensure they can leave as soon as the shelter finds a good home.
54 shelters received too much help, 17 facilities received just enough assistance and 22 shelters received too little help from other animal welfare organizations. However, the excess dogs rescued (1,743 dogs) at shelters receiving too much assistance was far higher than the rescue deficits at other shelters (232 dogs) resulting in the state’s shelters sending 1,511 more dogs than needed to rescues and other animal welfare organizations. Northern Ocean Animal Facility and Southern Ocean Animal Facility received less rescue support than needed. However, neither of the shelters reported rescues taking any animals, which raises questions as to whether these shelters correctly reported their data (i.e. counting animals sent to rescues as adoptions). Nonetheless, the New Jersey shelter system as a whole is receiving enough rescue assistance, but some shelters are hurt by rescues pulling animals from less needy facilities.
Rescue groups and shelters with extra space should pull dogs from kill shelters with the highest rescue “target” numbers and deficits in the tables below. If shelters not needing rescue support get that extra help, these shelters will not take the steps necessary to properly run their facilities. As a result of enabling poorly performing shelters and not pulling dogs from truly space constrained facilities, rescuing dogs from shelters with enough space leads to less lifesaving.
Shelters receiving less than needed rescue support should also examine their own policies and performance. Are the shelter’s operating processes allowing too many animals to get sick and therefore discouraging organizations to rescue their animals due to subsequent medical costs? Does the shelter actively reach out to rescues/other shelters and treat them with respect? Does the shelter make it convenient for other organizations to pull their animals?
Given killing animals for space is intolerable, the space-constrained shelters need to expand their effective dog capacity. These facilities could use extra space in their buildings to house dogs on a short-term basis. These shelters can enter into arrangements with local veterinarians to house and adopt out some dogs. Furthermore, shelters can create or expand foster programs to increase the number of dogs cared for. Additionally, creating a pet owner surrender prevention program, implementing a proper managed intake policy (i.e. where animals are impounded when in danger and waiting periods for owner surrenders are relatively short) and making serious efforts to return lost dogs to owners could free up space in these shelters. Finally, space-constrained shelters with multiple animal control contracts should terminate some of these arrangements to bring their capacity for care in line with the number of dogs they take in. As a result, space constrained shelters still need to take active steps to reduce killing rather than simply solely relying on rescue support.
In certain circumstances, it may make sense for shelters with excess space to send dogs to rescues. For example, a unique breed or a dog needing very specialized behavioral or medical rehabilitation. However, these cases are accounted for in my targeted sent to rescue figures for animal control shelters.
Most New Jersey Animal Shelters Fail to Come Close to Reaching Their Local Dog Adoption Potential
We can assess each shelter’s contribution to making New Jersey and nearby areas no kill. While a shelter may be able to avoid killing healthy and treatable animals, it still may not live up to its potential for adopting out local dogs. On the other hand, a space constrained shelter may kill healthy and treatable dogs, but still do a good job adopting animals out.
The tables below compare the number of dogs from New Jersey and nearby states each animal shelter should adopt out with the estimated number of local dogs actually adopted out.
Many rescue oriented shelters likely pull much easier to adopt dogs than the bulk of dogs needing to get rescued from local facilities. Thus, the results from rescue oriented shelters may look better than they actually are.
Few organizations reached or exceeded their adoption targets. Specifically, only 10 out of 93 shelters met the adoptions goals computed by the Life Saving Model. Thus, the overwhelming number of New Jersey animal shelters need to step up their adoption efforts.
A number of other rescue oriented shelters exceeded their adoption targets, but this may at least partially be due to the types of dogs they impounded. Common Sense for Animals operates more like a rescue oriented than an animal control shelter. While this organization exceeded its adoption targets, the shelter’s figures were off by 128 dogs using the methodology outlined in another blog. This makes me wonder if their adoption numbers were accurate. Somerset Regional Animal Shelter, which also operates more like a rescue oriented shelter than an animal control facility, exceeded its adoption target. However, this shelter appears to mostly rescue easier to adopt dogs from New Jersey animal shelters. Other rescue oriented shelters, such as Mt. Pleasant Animal Shelter and Animal Welfare Association also exceeded their adoption targets, but this is likely due to these organizations rescuing easier to adopt dogs from New Jersey shelters. Thus, I believe most of these rescue oriented shelters’ high local dog adoption numbers were due to these organizations selecting easier to adopt dogs.
Pequannock Animal Shelter’s higher than targeted local dog adoption result is a bit misleading. This facility benefited from the method I used to cap adoptions in the county and reduce the adoption targets for these two shelters. For example, the shelter only reached 61% of its adoption target using my unadjusted model only taking the shelter’s physical space into account. Since Morris County has many shelters that collectively have a very large capacity (i.e. very high adoption potential), my model reduces all Morris County animal shelters’ target adoptions to my county adoption cap. Therefore, Pequannock Animal Shelter has a relatively low dog adoption target. Thus, this shelter really didn’t do an excellent job adopting out dogs.
Three animal control shelters deserve mentioning. Camden County Animal Shelter exceeded its adoption target by 40 dogs. As a large county shelter that includes a poor urban area, this is an impressive result. Similarly, Burlington County Animal Shelter, which also takes in many dogs, exceeded its dog adoption target by 82 dogs. Ewing Animal Shelter, which is operated by EASEL Animal Rescue League, adopted out 19 more dogs than its adoption target. Unsurprisingly, all three shelters had dog live release rates exceeding 90% in 2017 (Camden County Animal Shelter: 92%, Burlington County Animal Shelter: 96%, EASEL Animal Rescue League: 98%) and all three facilities provide either condensed or full statistics on their web sites.
Shelters adopting out the fewest animals in total relative to their targets were as follows:
Associated Humane Societies-Newark – 1,412 fewer dogs adopted than targeted
Monmouth SPCA – 629 fewer dogs adopted than targeted
Associated Humane Societies-Popcorn Park – 593 fewer dogs adopted than targeted
Plainfield Area Humane Society – 486 fewer dogs adopted than targeted
Bergen County Animal Shelter – 458 fewer dogs adopted than targeted
Tyco Animal Control – Paramus – 388 fewer dogs adopted than targeted
Trenton Animal Shelter – 383 fewer dogs adopted than targeted
St. Hubert’s – Madison – 338 fewer dogs adopted than targeted
Shake a Paw-Union – 334 fewer dogs adopted than targeted
Paterson Animal Shelter – 313 fewer dogs adopted than targeted
Jersey Shore Animal Center – 310 fewer dogs adopted than targeted
Cumberland County SPCA – 302 fewer dogs adopted than targeted
Unsurprisingly, Associated Humane Societies has archaic adoption policies that make it more difficult to adopt than the procedures recommended from national animal welfare organizations. Furthermore, Associated Humane Societies-Newark, Associated Humane Societies-Tinton Falls, Trenton Animal Shelter, Paterson Animal Shelter, Monmouth SPCA, Paterson Animal Shelter and Bergen County Animal Shelter had troublesome stories involving the shelters and/or prominent people affiliated with these organizations over the last several years. Shake a Paw-Union’s low local adoption numbers are not surprising since it also operates a for profit pet store and transports almost all of its dogs it rescues from out of state. Finally, Plainfield Area Humane Society’s local dog adoption deficit is quite disturbing since this organization could easily take on Plainfield’s dogs who currently go to the horrific and high kill Associated Humane Societies-Newark.
Shelters Fail to Use Excess Space to Save Local Dogs
To further examine New Jersey animal shelters’ performance in saving the state’s homeless dogs, I compared the targeted number of dogs each shelter should pull from nearby shelters and compared it to the number actually rescued from local facilities. I assume all reported out of state rescued dogs came from southern or other far away states (except for Animal Alliance due to the shelter stating it primarily pulls out of state dogs from Pennsylvania). While some of the out of state rescued dogs may have comes from nearby areas, I believe this is a small number and does not significantly impact the results.
Virtually all New Jersey animal shelters are failing to rescue the number of local dogs they should. 90 of the 93 shelters should rescue some dogs from other local shelters. In fact, 41 of the 90 shelters with targeted excess capacity failed to rescue even a single dog from a New Jersey animal shelter. Of the 90 shelters that should have rescued dogs, the following shelters were the only facilities that met or exceeded their local dog rescue targets:
Animal Adoption Center – 179 more dogs rescued than targeted
Animal Welfare Association – 77 more dogs rescued than targeted
Burlington County Animal Shelter – 76 more dogs rescued than targeted
Somerset Regional Animal Shelter – 73 more dogs rescued than targeted
Humane Society of Atlantic County – 32 more dogs rescued than targeted
Ewing Animal Shelter (EASEL) – 21 more dogs rescued than targeted
Beacon Animal Rescue – 19 more dogs rescued than targeted
Mt. Pleasant Animal Shelter – 12 more dogs rescued than targeted
Harmony Animal Hospital – 10 more dogs rescued than targeted
Gloucester County Animal Shelter – 5 more dogs rescued than targeted
Trenton Animal Shelter – 4 more dogs rescued than targeted
As mentioned above, many of these shelters local rescue numbers are inflated due to these organizations cherry picking highly adoptable animals to rescue. Thus, nearly all New Jersey animal shelters with targeted excess capacity are failing to do their share in ending the killing of local healthy and treatable dogs.
Camden County Animal Shelter also deserves mentioning. This facility rescued 380 dogs from other New Jersey shelters last year. While this is an obviously good thing, this may have artificially decreased this shelter’s estimated local death rate by as much as 2% if it only pulled highly adoptable dogs.
Shelters can overcome challenges in rescuing dogs from outside their service area. In some cases, municipalities may frown on government run shelters using taxpayer funds to rescue dogs from elsewhere. However, shelter directors at these facilities can encourage individuals to form a non-profit or raise money on their own to pay for these rescued dogs. Additionally, shelters with limited capacity or even some of the well-off private shelters could contribute funding for each dog rescued. For example, Maddie’s Fund paid an approximate $160 subsidy to rescues pulling dogs from New York Animal Care & Control. Similarly, private shelters with excess space, but limited financial resources, could expand their fundraising efforts to save more local dogs. Thus, perceived obstacles to rescuing local dogs can and should be overcome.
New Jersey Animal Shelters Need to Form Life-Saving Coalitions
The improper allocation of space within the state’s animal shelter system requires organizations to form coalitions. While putting a competent and compassionate director in every shelter would likely be even more effective, that will likely take time to do. No kill coalitions between animal control facilities and selective admission shelters have been used in places, such as Portland, Oregon, Reno, Nevada, Jacksonville, Florida and Austin, Texas to radically increase life saving. Maddie’s Fund, which has supported using coalitions for over a decade, has many resources for organizations seeking to collaborate with each other. Thus, New Jersey animal shelters need to formally work together, develop quantifiable and measurable goals (such as the targeted outcomes in this blog), and hold each organization accountable for meeting these benchmarks.
Sobering Results Require Shelter Leaders to Critically Examine Themselves
Shelters should examine the reasons why their adoption numbers fall far short of these benchmarks. In some cases, shelters need to expand the hours they are open for adoptions. Many shelters should switch from an overly judgmental adoption process based on black and white rules to a conversational one focused on educating the adopter. Organizations will need to radically increase their off-site events and do same day adoptions. Similarly, many shelters must reduce adoption fees and run frequent promotions. Executive Directors should monitor the latest life-saving programs on Maddie’s Fund’s, ASPCA Pro’s, American Pets Alive Conference’s, and the Best Friends National Conference’s web sites and put some of these policies into place. Shelter management teams will need to ensure their facilities are clean and customers are treated with respect (this can be measured by encouraging the public to complete surveys). Thus, poorly performing shelters need to stop making excuses and do what it takes to reach their adoption potential.
We can turn New Jersey, New York City and Philadelphia into no kill communities. It is time we give our money and volunteer efforts to organizations who raise their performance to help us reach that goal. To do otherwise, would betray all the animals whose lives are on the line.
Appendix – Life Saving Model Assumptions
The Life Saving Model utilizes the following basic animal shelter population equations to calculate the targeted dog outcomes for each facility:
Daily capacity or population = Daily animal intake x average length of stay
Average length of stay = Daily capacity or population/daily intake
Each shelter’s community dog intake (i.e. owner surrenders, strays, cruelty bite cases), number of dogs returned to owners, and maximum dog capacity were taken from its 2017 “Shelter/Pound Annual Report” submitted to the New Jersey Department of Health.
This data was then used as follows:
Community dog intake and dogs returned to owners were initially estimated for each month by dividing the annual figures by 12. In order to take into account the extra space in low intake months and reduced space in high intake months, we multiply that number by each month’s percentage of the average month. For example, assume 240 dogs were taken in during the year and the average month equals 20 dogs (240/12). In July, the dog intake is 120% higher than the average month and we therefore multiply 20 dogs by 1.2 to equal 24 dogs. If 120 dogs were returned to owners during the year, the estimated number of dogs returned to owners in July would equal 12 dogs (120/12 = 10; 10*1.2). The monthly intake percentages were based off the average of the 2017 dog intake data on New York Animal Care & Control’s and ACCT Philly’s web sites.
The estimated number of community dogs returned to owners each month are then assumed to stay 5 days on average at shelters based on data from other shelters across the country. If anything, this estimate is conservative (i.e. average length of stay for dogs returned to owners may be less than 5 days and therefore frees up more shelter space for adoptions) based on some shelters returning the bulk of their dogs to owners within 3 days.
The number of community dogs euthanized (including animals who died or are missing) is set to equal 5% of intake. 5% is a reasonable standard euthanasia rate for shelters in New Jersey to meet given few vulnerable stray puppies (i.e. who could die or require euthanasia) arrive in the state’s animal shelters. The average length of stay for euthanized dogs is assumed to equal 14.5 days. Half of dogs are assumed euthanized for untreatable aggression towards people and 21 days is the time estimated to make that determination. The other half of dogs are assumed euthanized for severe and untreatable health issues and I estimate these dogs are euthanized after 8 days (subsequent to the end of the stray hold and owner surrender protection periods).
Adopted dogs are assumed to stay at shelters for varying lengths of time. Adoption length of stay was based on data from a study in the Journal of Applied Animal Welfare and the figures used (except for space-constrained shelters) are located in a prior blog on pit bull adoption. The data primarily comes from Tompkins County SPCA during a time it saved over 90% of its dogs. This was a fairly conservative data set to use as other no kill open admission shelters’ average length of stay are substantially shorter. Specifically, the following assumptions were made:
80% and 20% of each communities dogs (including pit bulls) were adults 1 year and older and under 1 year.
Pit bulls were assumed to comprise 50%, 35% and 25% of community dog intake at poor, middle/upper middle class, and wealthy area animal control shelters. While some shelters may have pit bulls comprising more than 50% of their shelter dog population at a given time, this is due to pit bulls longer average length of stay. For example, a shelter with pit bulls making up 50% of their dog intake and pit bulls having an average length of stay three times longer than other dogs will have pit bulls constituting 75% of the dog population. Shelters without animal control contracts were assumed to only have pit bulls make up 10% of their community dogs (i.e. strays and owner surrenders) based on most of these shelters’ highly selective admission practices.
Pit bull adoption length of stay was taken directly from the Journal of Applied Animal Welfare study. The average adoption lengths of stay for other breeds from this study were averaged and used for dogs other than pit bulls in the analysis
Space constrained shelters were assumed to adopt out their easiest to adopt animals first until they ran out of space. To estimate the average adoption length of stay, I used pit bull adoption length of stay data from Greenhill Humane Society from March 2013 through May 2015. I broke the adoption length of stay data into 5 groups that each made up 20% of the data. The average adoption length of stay for each of these 5 groups was calculated. The average adoption length of stay of each group was divided by the average length of stay for all of the adopted pit bulls in the Greenhill Humane Society data set. Those percentages were then multiplied by the average dog adoption length of stay determined in the previous bullet and used to determine the adoption lengths of stay used for space-constrained shelters.
Dogs transferred to rescue or other facilities are assumed to stay at shelters 8 days on average based on the assumption strays can’t be released until the 7 day hold period elapses.
Community dogs not returned to owners or euthanized are initially assumed as adopted for each month. However, if the calculated length of stay exceeds the shelter’s required length of stay, dogs are moved from adoption (i.e. longer length of stay) to rescue (i.e. shorter length of stay) until the calculated length of stay each month approximately equals the required length of stay.
Animal control shelters have a minimum of 10% of unclaimed dogs go to rescues. To the extent shelters transfer 10% of unclaimed dogs to rescues despite having space (i.e. reclassifying dogs from adoptions with a longer length of stay to rescues with a shorter length of stay), I do not require these facilities to use that space to rescue additional dogs.
Required length of stay = Shelter’s reported capacity/adjusted daily intake for the month. Adjusted daily intake for month = Adjusted monthly intake per first bullet above/the number of days in the month.
Shelters with excess capacity are assumed to use the extra space to rescue and adopt out dogs from other New Jersey animal shelters. To the extent all healthy and treatable New Jersey animal shelter dogs are saved, I assume additional dogs are pulled from nearby states with similar types of dogs. I assume all rescued dogs will not be killed since the transferring and receiving shelters should evaluate these dogs’ behavior. Based on pit bull type dogs having longer lengths of stay at shelters, I assume 80% of dogs rescued from local animal shelters are pit bulls and 20% are non-pit bulls. 80% and 20% of pit bull and non-pit bull type dogs are considered 1 year and older and under 1 year. The average length of stay for rescued pit bulls and other dogs are the same as the adoption length of stay figures above.
Each month’s targeted outcomes are added to determine how many local dogs New Jersey animal shelters should adopt out, send to rescue, rescue from other nearby animal shelters and euthanize.
The targeted number of dogs rescued and adopted were capped at 2 pit bulls per 1,000 people in each county. If the model yielded a higher result than this cap, the targeted numbers of dogs adopted were set to equal to this cap using the pit bull percentage assumptions above. For shelters in these counties (except Passaic County), I calculated the cap at the county level and then reduced the number of cats adopted for the county to equal the cap. I excluded West Milford from Passaic County due the town’s large distance from the population centers in the rest of the county. Each shelter’s percentage of total targeted adoptions in the county from the unmodified model were applied to the the total reduction in the number of adoptions in the county to yield the targeted numbers of dogs adopted in the modified model. If the shelter also rescued animals from other shelters, the rescued numbers were also reduced since I assume rescued animals are adopted.
Last month, I wrote a blog discussing decreased killing at New Jersey animal shelters in 2017. This blog will explore the 2017 statistics in more detail and assess the current status of the state’s animal shelters.
Most New Jersey animal shelters voluntarily report detailed data to state authorities. Last month, I shared the 2017 summary statistics for New Jersey animal shelters on my Facebook page. Each year, the New Jersey Department of Health requests each licensed animal shelter in the state to submit animal shelter data for the previous year. Animal shelters voluntarily submit this data in the “Shelter/Pound Annual Report.” The New Jersey Department of Health takes these Shelter/Pound Annual Reports and compiles the number of dogs, cats and other animals impounded, redeemed, adopted and euthanized to prepare its Animal Intake and Disposition report. However, the Shelter/Pound Annual Reports include additional information on how animals were impounded (i.e. strays, owner surrenders, rescued from in-state facilities, rescued from out of state shelters, and cruelty/bite cases/other) and disposed of (i.e. returned to owner, adopted, sent to rescue/another shelter, and died/missing/other outcome). Additionally, the Shelter/Pound Annual Reports include the number of animals in shelters at the beginning and end of the year as well as the maximum number of animals facilities can hold. Thus, the Shelter/Pound Annual Reports include very important data not found in the New Jersey Department of Health’s summary report.
I compiled the data from these reports and analyze the results in this blog. 2017 statistics for each New Jersey animal shelter are listed at this link. You can also view each “Shelter/Pound Annual Report” at this link.
Garbage Data Raises Serious Questions About New Jersey Animal Shelters’ Statistics
Most New Jersey animal shelters do not properly account for their animals. Simple math dictates the number of animals at a facility at the beginning of the year, plus all animals coming in during the year, less all animals leaving for the period, should equal the number of animals a shelter has at the end of the year. Stunningly, 59 out of 93 shelters reporting these dog statistics and 60 out of 91 facilities submitting this cat data failed to get this right. This raises serious questions about the accuracy of these shelters’ reported statistics. 39 of the 59 shelters with flawed dog statistics and 38 of the 60 facilities with incorrect cat statistics should have had more animals at the end of the year than reported. While these errors could have been due to incorrect counts of the number of animals at facilities, these shelters may have not recorded outcomes, such as animals who were killed, died, or went missing. To put it another way, 2,245 cats and dogs should have had outcomes reported and did not. Thus, there is the potential that as many as 2,245 additional dogs and cats were killed, died or went missing from New Jersey animal shelters than were reported in 2017.
Even worse, a number of animal shelters reported having a different number of animals at the end of 2016 and at the beginning of 2017. Obviously, shelters should report the same number of animals at the end of the prior year and the start of the current year. However, 34 of 93 shelters reported different numbers of dogs at the end of 2016 and the beginning of 2017. Similarly, 43 of 91 shelters reported different numbers of cats at the end of 2016 and the beginning of 2017. The worst offenders are listed in the tables below:
Shelters may have failed to classify animals adopted out and sent to rescues properly. Both Paterson Animal Control and Elizabeth Animal Shelter reported no animals were sent to rescues and all dogs and cats leaving their facilities alive were owner reclaims or adoptions. However, intake and disposition records I reviewed at both of these shelters in recent years revealed almost all “adopted” animals are actually rescued. One has to wonder how many other facilities failed to properly classify adoptions and rescues properly. This data is very important as it provides details on the burden rescues and other shelters are taking on from these facilities.
We need better oversight of New Jersey animal shelters’ data reporting. Currently, these statistics are voluntarily reported and most shelters are not taking this seriously. For example, I noticed a large number of reports were submitted many months after the end of the year. This data should be easy to compile since facilities can utilize animal shelter software programs, some of which are free, to do this task. Furthermore, New Jersey animal shelter laws mandate facilities maintain much of the raw data found in the Shelter/Pound Annual Report. Unfortunately, New Jersey Department of Health inspections routinely find shelters do not properly keep records on animals. We need to make the data reporting mandatory for animal shelters as the shelter reform bill, S725, does along with serious penalties for significant errors (especially if deliberate). In order for animal shelters to take data reporting seriously, we may also need to require audits of these reports. Thus, these results show we need stronger laws and the New Jersey Department of Health to play a greater role in ensuring reported animal shelter statistics are in fact accurate.
Despite the errors in these reports, the data provided still reveals important information.
More Animals Losing Their Lives in New Jersey Animal Shelters Than Disclosed in Summary Report
The more detailed data in the Shelter/Pound Annual Reports allows one to more critically examine the percentage of locally impounded animals dying in New Jersey’s animal shelters. The following table summarizes my analysis of the kill rate calculated from the New Jersey Department of Health’s summary report and the data reported in the Shelter/Pound Annual Reports.
This year I revised the dog statistics to remove an estimate of the dogs St. Hubert’s transfers in and quickly transfers out through its Sister Shelter WayStation program. Since St. Hubert’s is effectively acting as a middle man and not holding these animals very long, it makes sense to exclude these dogs from the various kill rate statistics below. If I did not exclude these animals, I would understate the dog kill rate due to inflated intake and outcomes numbers. Therefore, I removed all of St. Hubert’s dogs transferred out from the intake and outcomes figures to calculate the kill rates above except the “Kill Rate Per State Report (Intake).” This adjustment increased the dog kill rate (intake) from 6.6% to 7.3%. While St. Hubert’s also transfers in and transfers out cats through the Sister Shelter WayStation program, the numbers did not have a material impact on the statewide kill rates. As a result, I did not revise the cat statistics.
The Animal Intake and Disposition report prepared by the New Jersey Department of Health only allows one to calculate the number of animals killed as a percentage of total animals impounded or intake. I prefer calculating the kill rate as a percentage of outcomes rather than intake as this metric directly compares positive and negative outcomes. Using intake may depress the kill rate since shelters can simply hold animals for a long time to the point of overcrowding. Calculating the kill rate based on outcomes rather than intake caused the cat kill rate to increase from 18.4% to 18.8% while the dog kill rate remained at 7.3%.
To calculate the statewide kill rate, we must also back out transfers from one New Jersey animal shelter to another state facility to avoid counting animals still in the state’s shelter system or registering two outcomes for the same animal (i.e. one New Jersey animal shelter transfers a dog or cat to another state facility which then adopts out the animal). This adjustment increases the dog kill rate from 7.3% to 8.0% and the cat kill rate from 18.8% to 20.5%.
In addition, we should increase the kill rate for animals who died or went missing in shelters. In the past, I’ve labeled this metric the death rate as these animals are likely dead or in a very bad situation. Unfortunately, the Shelter/Pound Annual Report includes animals who died or went missing in the “Other” outcome category. The “Other” category contains positive live releases, such as TNR for cats, at a few shelters. While including the “Other” category in the death rate for most shelters is appropriate (i.e. those facilities that don’t do TNR or don’t include cats released through TNR programs in “Other” outcomes), I’m no longer doing this due to an increasing number of shelters implementing TNR. Instead, I calculated the kill rate by subtracting out “Other” outcomes from total outcomes. If a shelter specifies the number of animals included in “Other” that left the shelter alive, I count this as “Other Live Release” and do not back these amounts out of total outcomes. After making this adjustment, the dog kill rate increases from 8.0% to 8.1% and the cat kill rate rises from 20.5% to 21.9%. For those interested in seeing the estimated death rates, you can find them in the supporting spreadsheet.
Also, many shelters transport easy to adopt animals from out of state which artificially increases live release rates. To properly calculate the percentage of New Jersey animals losing their lives, we need to adjust for transports. Unfortunately, shelters don’t break out their save rates by local and out of state animals. However, most likely nearly all of the out of state animals (primarily puppies and easy to adopt dogs) make it out of shelters alive. Therefore, I back out the number of out of state transports from total outcomes to estimate the local kill rate. This adjustment increases the New Jersey dog kill rate from 8.1% to 10.5% and the state’s cat kill rate from 21.9% to 22.2%.
Also, I estimate a maximum local kill rate by including the number of unaccounted for animals described in the section above. Making this adjustment increases the maximum potential New Jersey dog kill rate from 10.5% to 14.2% and the maximum potential state cat kill rate from 22.2% to 24.7%.
Some animal shelters quickly return large percentages of their animals to owners. At these shelters, the populations served are typically well-off and animals are licensed and have microchips. To account for the animals facilities actually have to shelter, I calculated a kill rate for non-reclaimed animals and a maximum potential kill rate for non-reclaimed local animals. The non-reclaimed kill rate and maximum potential kill rate for dogs is 11.6% and 23.5%. Non-reclaimed cats had a 22.8% kill rate and a 25.8% maximum potential kill rate. Thus, the percentage of New Jersey animals losing their lives in our state’s animal shelters may be much higher than the state summary report suggests.
Kill Rates Extremely High at a Number of New Jersey Animal Shelters
Dogs and cats are likely to lose their lives at a number of New Jersey animal shelters. Shelters with the highest kill rates for dogs and cats (excluding very low intake facilities) are listed in the following tables:
Thus, both dogs and cats have a very good chance of leaving many New Jersey animal shelters dead rather than alive.
In terms of raw numbers, the following shelters killed the most animals:
Many shelters fail to account for large numbers of their animals. As discussed above, a shelter’s number of animals at the end of the year should be calculated as follows:
Beginning number of animals + animals impounded – animals leaving the shelter
Unfortunately, a large number of shelters take in far more animals than they can explain where they went. Shelters having the highest numbers of unaccounted for dogs and cats are listed in the following tables:
Dog and cat kill rates at many shelters may be even higher if these unaccounted for animals are counted as killed. If we only consider animal shelters which reported transporting few or no animals in 2017, facilities with the highest dog and cat kill rates considering the unaccounted for animals described above are as follows:
Thus, the plight of dogs and cats may be far worse in New Jersey animal shelters when we consider the unaccounted for animals.
Shelters Turn Their Backs on New Jersey’s Animals
New Jersey animal shelters rescue far more dogs from out of state than from other New Jersey animal shelters. Specifically, New Jersey animal shelters transferred in 9,918 dogs from out of state animal shelters and only rescued 2,950 dogs from other New Jersey animal shelters. However, St. Hubert’s frequently transfers a substantial number of its transports quickly to its partners in New Jersey and other states. If I back out St. Hubert’s transfers of dogs to out of state organizations, the number of transports decreases from 9,918 dogs to 8,326 dogs. As a comparison, the total and adjusted transports in 2016 were 7,948 dogs and 7,033 dogs. While the state’s local kill rate decreased in 2017, it is likely the local kill rate would have decreased by more if not for the massive number of out of state transports.
While perhaps some shelters, such as Animal Alliance in Lambertville, take animals from nearby New York or Pennsylvania animal control shelters, the overwhelming majority of these dogs most certainly came from down south. In fact, New Jersey animal shelters transported more dogs from out of state than dogs who were killed in New Jersey animal shelters. This number does not include additional out of state dogs transported into New Jersey by rescues operating without a physical facility. Shelters transporting the most dogs from out of state were as follows:
Shelters Do Far Worse with Animals Requiring New Homes
Since dogs reclaimed by their owners typically have licenses and/or microchips and quickly leave the shelter, its informative to look at dogs shelters have to find new homes for. To get a better idea of how organizations are doing with animals they actually have to shelter, I also examined what percentage of non-reclaimed dogs lose their lives at each facility. Shelters with the highest non-reclaimed dogs kill rates are as follows:
Shelters with the highest maximum non-reclaimed dogs kill rates are as follows (excluding facilities that reported transporting many dogs in and taking very few animals in):
Shelters Leave Animal Enclosures Empty While Dogs and Cats Die
New Jersey animal shelters fail to use their space to save animals. Based on the average number of animals at all of New Jersey’s animal shelters at the beginning and the end of 2017, only 56% of dog and 71% of cat capacity was used. Given December is a low intake month, I also increased these populations to an average intake month. This adjustment only raised the dog capacity utilization to 62%. While this adjustment did increase the cat capacity utilization to 97%, it is highly unlikely this happened in reality. Shelter inspection reports I’ve reviewed often did not reveal significantly larger dog and cat populations in the summer and winter months. This is likely due to the influx of highly adoptable kittens having short lengths of stay and shelters killing cats with empty cages.
Many animal shelters with low kill rates failed to rescue animals with their excess space. Additionally, other shelters used little of their available space and still killed a large percentage of their animals. Some examples after increasing the population (and therefore capacity utilization) based on the adjustment discussed above are as follows:
Thus, many New Jersey animal shelters are killing dogs and cats despite having ample space to house these animals.
New Jersey’s animal shelters continue to fail the state’s animals. The state’s animal shelters only impound 9.2 dogs and cats per 1,000 New Jersey residents. If we just count animals originating from New Jersey, the state’s animal shelters only impound 7.3 dogs and cats per 1,000 people. As a comparison, the average community in the country impounds anywhere from 14-30 animals per 1,000 residents based on estimates from Animal People Newspaper and the Humane Society of the United States. Despite New Jersey shelters impounding a fraction of the animals other no kill communities take in on a per capita basis, the state’s animal control facilities continue to kill and allow animals to die under their care. Even worse, many of these shelters can’t even properly keep track of how many animals leave their facilities dead or alive. Our state’s animals deserve far better treatment than this. Contact your local city council members and mayor and demand better from the animal shelter serving your community. We can do so much better and it is time our shelters operate this way.
In a blog from earlier this year, I disclosed New Jersey’s depressing animal shelter statistics. This blog explains why so many dogs are losing their lives in the state’s animal shelters and whether these facilities can end the killing.
Successful organizations set measurable goals and regularly monitor their performance. Examples include financial budgets, customer and employee satisfaction surveys, and product reliability metrics. Unfortunately, many animal shelters for far too long have failed to set lifesaving goals and standards. Municipalities, donors and volunteers need to know where their resources will be best utilized. Time and money are scarce resources and people should allocate these assets to organizations who will best utilize them. As a result, animal shelters need to set goals and hold their leadership and staff accountable for achieving these objectives.
Model Assesses New Jersey Animal Shelters’ Life Saving Performance
In order to assess how good of a job New Jersey animal shelters are doing, I’ve developed an analysis I call the “Life Saving Model.” While shelter performance is dependent on many variables, such as finances, facility design, local laws, etc., the most critical factor impacting potential life saving is physical space. Without having enough physical space, a shelter might not have enough time to find loving homes for its animals. Shelters can overcome financial limitations through creative fundraising or recruiting more volunteers. Similarly, organizations can save their dogs despite having run down facilities if these groups enthusiastically implement policies to get animals into loving homes quickly. As a result, my analysis focuses on making the best use of space to save the maximum number of New Jersey and nearby states dogs.
The Life Saving Model measures the number of local animals a shelter should adopt out, rescue from other facilities, send to rescues or other shelters, and euthanize. The targeted outcomes take into account each facility’s physical capacity and the number and types of dogs the organization receives from its community (i.e. strays, owner surrenders, cruelty/bite cases). I assume a target euthanasia rate, take the number of dogs actually returned to owners and then estimate how many community dogs a shelter should adopt out. To the extent space runs out, I then calculate how many dogs the shelter must send to rescues. If the shelter has excess space after properly serving its local community, the facility uses that room to rescue and adopt out dogs from nearby areas. The targeted results calculated from this model are compared to the actual or estimated actual results from each shelter below.
This year I made one change to the Life Saving Model. For shelters with animal control contracts, I place 10% of all dogs that are not reclaimed by owners into the targeted sent to rescue category. Austin Pets Alive used data from Austin Animal Center, which is the local municipal shelter, to determine large dogs with behavioral challenges are part of the last 10% of animals losing their lives. While shelters can save most of these dogs through behavioral rehabilitation and/or foster programs, I decided to put an estimate of these dogs into the sent to rescue category since that is another good outcome for these dogs.
To read specific details and assumptions used in the model, please see the Appendix at the end of this blog.
My analysis puts a cap on the targeted numbers of dogs rescued from other shelters and adoptions. While my unmodified targeted numbers of rescued and adopted animals are quite achievable, I want to provide very conservative goals for New Jersey animals shelters. For example, the unmodified model resulted in a statewide per capita dog adoption rate of around one half to one quarter the level found at some of the best animal control shelters. Similarly, the unmodified model yielded a statewide pit bull per capita adoption rate (2.4 pit bulls per 1,000 people) that is close to one of the best animal control shelters in the country. In my opinion, New Jersey shelters could more easily achieve that per capita pit bull adoption rate given my model includes far fewer dogs from competing breeds than those in this role model animal control shelter.
My modified analysis capped pit bull adoptions at 2 pit bulls per 1,000 people within each New Jersey county. In other words, the targeted numbers of dogs rescued from other shelters and adopted below are the lesser of
Number predicted by model
Number determined by capping pit bull adoptions at 2 pit bulls per 1,000 people in the county
In simple terms, a shelter is expected to achieve this per capita adoption rate unless the facility lacks enough space. If a shelter does not have sufficient room, it won’t have the time to reach all the potential adopters and requires assistance from rescues and/or other facilities. Given my model assumes 80% of rescued dogs are pit bull like dogs, my targeted numbers of dogs rescued and adopted are quite low as detailed in the section below. For example, shelters in counties where dog adoptions are capped have extra space that they do not use to adopt out other dog breeds.
New Jersey Animal Shelters Contain Enough Space to Save All of New Jersey’s Dogs and Many More from Other States
New Jersey’s animal shelter system has enough space to save all of the state’s healthy and treatable dogs. The table below details the targeted numbers of dog outcomes the New Jersey animal shelter system should achieve. Out of the 22,846 New Jersey dogs coming into the state’s animal shelters in 2016, 10,765 and 2,070 dogs should have been adopted out and sent to other shelters/rescues by the facilities originally taking the dogs in. However, other New Jersey animal shelters had more than enough capacity to rescue the 2,070 dogs from space constrained facilities. Thus, New Jersey animal shelters should be able to able to adopt out every single healthy and treatable dog taken in from the state and not require any support from rescue organizations without physical facilities from a space perspective.
New Jersey animal shelters have enough excess space to save many dogs from out of state as well. Specifically, New Jersey animal shelters had enough physical capacity to rescue and adopt out 9,738 dogs from out of state after achieving a 95% live release rate for New Jersey dogs. To put this number into perspective, New Jersey animal shelters could make both New York City and Philadelphia no kill cities for dogs and increase those cities’ dog live release rates to 95% in 2016 as follows:
New York City – 1,153 additional dogs need saving
Philadelphia – 1,453 additional dogs need saving
Additionally, New Jersey animal shelters could save another 7,132 dogs from other locations outside of the state. Of course, some New Jersey animal shelters do pull some dogs from New York City and Philadelphia animal control shelters. However, most of these dogs are likely easy to adopt and therefore have short lengths of stay. As a result, the additional number of dogs New Jersey animal shelters could save from New York City, Philadelphia and elsewhere is probably not much lower than the figures above. Thus, New Jersey animal shelters could make New Jersey a no kill state for dogs as well as many other places.
These adoption goals are quite achievable when comparing the performance of well-run animal control shelters across the country. New Jersey animal shelters would only need to adopt out 2.6 dogs per 1,000 people in the state (1.2 dogs if no dogs rescued from out of state). As a comparison, recent per capita dog adoption numbers from several high performing no kill open admission shelters are as follows:
Lynchburg Humane Society (Lynchburg, Virginia) – 18.0 dogs per 1,000 people
Longmont Humane Society (Longmont, Colorado area) – 10.1 dogs per 1,000 people
Nevada Humane Society (Reno, Nevada and Carson City, Nevada areas) – 7.6 dogs per 1,000 people
KC Pet Project (Kansas City, Missouri) – 6.9 dogs per 1,000 people
Humane Society of Fremont County (Fremont County, Colorado) – 6.8 dogs per 1,000 people
Huntsville Animal Services (Huntsville, Alabama area) – 5.6 dogs per 1,000 people
Williamson County Animal Shelter (Williamson County, Texas) – 5.5 dogs per 1,000 people
Thus, many communities are already adopting out around two to seven times as many dogs as the goal set for New Jersey animal shelters.
Some naysayers may claim New Jersey would have a more difficult time due to the state’s shelters taking in many pit bulls. However, this is a myth. My model estimates New Jersey animal shelters would need to adopt out roughly 0.5 pit bulls per 1,000 people to save 95% of New Jersey’s dogs. Our shelters would only need to adopt out around 1.5 pit bulls per 1,000 people if New Jersey shelters also rescued and adopted out the targeted number of pit bulls from other states. As a comparison, I estimate Longmont Humane Society adopts out 2.1 pit bulls per 1,000 people based on the number of pit bulls impounded in 2014 as a percentage of total dogs impounded in 2014 and multiplying that number by the 10.1 dogs per 1,000 people adoption rate in 2016. Furthermore, the pit bull adoption targets are even more reasonable given the model assumes there are roughly 1/7 of the number of dogs from other breeds to compete with in the New Jersey adoption market compared to the Longmont, Colorado area.
Animal Deaths Vary Widely at New Jersey Animal Shelters
The goal of any properly managed animal shelter is to save all of its healthy and treatable animals. In some cases, such as selective admission rescue oriented shelters, it is pretty easy to not kill animals. In addition, other animal shelters with easy to service animal control contracts (i.e. few animals impounded, most strays quickly returned to owners) can avoid unnecessary killing due to having lots of extra space. As a result, some shelters may have an easier time than others in preventing killing at their shelters.
The tables below detail the estimated local dog death rates. Consistent with the Life Saving Model’s assumptions, the actual dogs euthanized/killed/died/missing assumes these dogs came from the local community. All dogs missing are assumed “dead” based on the assumption they died or went to a very bad place. As discussed in my prior blog, the estimated local death rate includes “Other” outcomes as animals who died or went missing along with dogs reported as killed. Based on my review of a number of shelters’ underlying documents, virtually all of the dogs in the “Other” outcome category died or went missing. Shelters having estimated local dog death rates less than and greater than 5% are highlighted in green and red in the table below.
The Humane Society of Atlantic County had an unusually high estimated local dog death rate. While this number may be higher if some rescued dogs are euthanized/killed (i.e. targeted number assumes no rescued dogs are killed/euthanized) or many terminally ill dogs are surrendered for owner-requested euthanasia, this may possibly point to overly strict temperament testing at this shelter. This facility’s total kill rate of 9% is still very high for a rescue oriented shelter with no animal control contracts and raises serious questions about how life and death decisions are made by this organization. The total kill rate at other rescue oriented shelters, such as Ramapo-Bergen Animal Refuge and Animal Welfare Association (both had total dog kill rates of 1%) are much lower than the Humane Society of Atlantic County. Thus, I find it difficult to believe the Humane Society of Atlantic County’s larger than expected estimated local dog death rate is due to this organization rescuing a large percentage of their dogs from other shelters.
The largest number of dogs unnecessarily dying occurred at a relatively small number of shelters. Specifically, 12 out of 99 or 12% of the shelters accounted for 80% of the estimated 2,168 dogs unnecessarily losing their lives. In fact, Associated Humane Societies-Newark, which both broke state shelter law left and right this year per New Jersey Department of Health inspection reports, and Trenton Animal Shelter, which also violated state shelter law this year per a state health department inspection report, accounted for 35% of the dogs needlessly losing their lives at New Jersey animal shelters. Shelters with the greatest number of unnecessary dog deaths are as follows:
Associated Humane Societies – Newark (519)
Trenton Animal Shelter (238)
Camden County Animal Shelter (171)
Gloucester County Animal Shelter (145)
Cumberland County SPCA (124)
Thus, the bulk of the dogs unnecessarily dying at New Jersey animals shelters occurs at a small number of facilities.
Most New Jersey Animal Shelters Require Little Rescue Assistance
Some animal shelters will require more support from rescues and animal shelters with excess space than others. If a shelter has relatively high intake, very limited space, and few stray dogs returned to owners, it will need more help than other shelters. In an ideal world, rescues would take all shelter animals. However, due to limited numbers of foster homes, lesser ability to find foster homes due to many rescue organizations’ small sizes, and most rescues’ restrictive adoption policies, all shelters cannot heavily rely on rescues. The tables below compare the number of dogs a shelter should transfer to other organizations per the model and the number of dogs actually sent to other animal welfare groups. Shelters marked in green are receiving less than the expected rescue support while facilities marked in red are receiving too much rescue help.
Overall, most New Jersey animal shelters require little rescue support if space-constrained facilities fast-track their most highly adoptable dogs. Shelter medicine experts advocate prioritizing the processing of highly adoptable animals to make the best use of space and reduce disease. For example, making sure these animals are the first to get spayed/neutered and vaccinated and receive microchips to ensure they can leave as soon as the shelter finds a good home.
54 shelters received too much help, 16 facilities received just enough assistance and 28 shelters received too little help from other animal welfare organizations. However, the excess dogs rescued (3,472 dogs) at shelters receiving too much assistance was far higher than the rescue deficits at other shelters (487 dogs) resulting in the state’s shelters sending 2,985 more dogs than needed to rescues and other animal welfare organizations. Northern Ocean Animal Facility and Southern Ocean Animal Facility received less rescue support than needed. However, neither of the shelters reported rescues taking any animals, which raises questions as to whether these shelters correctly reported their data (i.e. counting animals sent to rescues as adoptions). Nonetheless, the New Jersey shelter system as a whole is receiving enough rescue assistance, but some shelters are hurt by rescues pulling animals from less needy facilities.
Associated Humane Societies-Newark hogged up the most rescue support. While St. Hubert’s-Madison sent the most dogs to rescues, many of these were dogs it recently transported in. Therefore, this shelter acted more like a middle man than a shelter impounding dogs and sending them to rescues. Rescues and other shelters pulled 433 more dogs than needed from AHS-Newark. Even worse, AHS-Tinton Falls also sent too many dogs to rescues as well as other shelters and this facility and AHS-Popcorn Park rescued far fewer dogs from other shelters than they should have. As a result of this poor performance, AHS diverted much needed rescue assistance from more needy shelters in the region.
Rescue groups and shelters with extra space should pull dogs from kill shelters with the highest rescue “target” numbers and deficits in the tables below. If shelters not needing rescue support get that extra help, these shelters will not take the steps necessary to properly run their facilities. As a result of enabling poorly performing shelters and not pulling dogs from truly space constrained facilities, rescuing dogs from shelters with enough space leads to less lifesaving.
Shelters receiving less than needed rescue support should also examine their own policies and performance. Are the shelter’s operating processes allowing too many animals to get sick and therefore discouraging organizations to rescue their animals due to subsequent medical costs? Does the shelter actively reach out to rescues/other shelters and treat them with respect? Does the shelter make it convenient for other organizations to pull their animals?
Given killing animals for space is intolerable, the space-constrained shelters need to expand their effective dog capacity. These facilities could use extra space in their buildings to house dogs on a short-term basis. These shelters can enter into arrangements with local veterinarians to house and adopt out some dogs. Furthermore, shelters can create or expand foster programs to increase the number of dogs cared for. Additionally, creating a pet owner surrender prevention program, implementing a proper managed intake policy (i.e. where animals are impounded when in danger and waiting periods for owner surrenders are relatively short) and making serious efforts to return lost dogs to owners could free up space in these shelters. Finally, space-constrained shelters with multiple animal control contracts should terminate some of these arrangements to bring their capacity for care in line with the number of dogs they take in. As a result, space constrained shelters still need to take active steps to reduce killing rather than simply solely relying on rescue support.
In certain circumstances, it may make sense for shelters with excess space to send dogs to rescues. For example, a unique breed or a dog needing very specialized behavioral or medical rehabilitation. However, these cases are accounted for in my targeted sent to rescue figures for animal control shelters.
Most New Jersey Animal Shelters Fail to Come Close to Reaching Their Local Dog Adoption Potential
We can assess each shelter’s contribution to making New Jersey and nearby areas no kill. While a shelter may be able to avoid killing healthy and treatable animals, it still may not live up to its potential for adopting out local dogs. On the other hand, a space constrained shelter may kill healthy and treatable dogs, but still do a good job adopting animals out.
The tables below compare the number of dogs from New Jersey and nearby states each animal shelter should adopt out with the estimated number of local dogs actually adopted out.
Many rescue oriented shelters likely pull much easier to adopt dogs than the bulk of dogs needing to get rescued from local facilities. Thus, the results from rescue oriented shelters may look better than they actually are.
Few organizations reached or exceeded their adoption targets. Specifically, only 10 out of 99 shelters met the adoptions goals computed by the Life Saving Model. Thus, the overwhelming number of New Jersey animal shelters need to step up their adoption efforts.
Several rescue oriented shelters exceeded their adoption targets. Beacon Animal Rescue and Ramapo-Bergen Animal Refuge adopted out more animals than I targeted. While these organizations are both rescue-oriented shelters that appear to pull fewer pit bulls than I target, Beacon Animal Rescue and Ramapo-Bergen Animal Refuge do at least have a reasonable number of pit bull like dogs up for adoption currently. Additionally, these shelters rescue animals primarily from other New Jersey animal shelters rather than transport large numbers of dogs from the south.
A number of other rescue oriented shelters exceeded their adoption targets, but this may at least partially be due to the types of dogs they impounded. While St. Hubert’s-North Branch has animal control contracts, most of its animals up for adoption are rescued from other shelters. St. Hubert’s uses progressive adoption policies, such as open or conversational based adoptions, adopting animals out as gifts, and adopting out animals almost every day of the year. On the other hand, St. Hubert’s appears to rescue far more adoptable animals than my model assumes (i.e. 80% of rescued dogs are pit bulls) and that likely also explains the organization’s strong performance. Common Sense for Animals operates more like a rescue oriented than an animal control shelter. While this organization exceeded its adoption targets, the shelter’s figures were off by 128 dogs using the methodology outlined in another blog. This makes me wonder if their adoption numbers were accurate. Somerset Regional Animal Shelter, which also operates more like a rescue oriented shelter than an animal control facility, exceeded its adoption target. However, this shelter appears to mostly rescue easier to adopt dogs from New Jersey animal shelters. Mt. Pleasant Animal Shelter also exceeded its adoption targets, but this is likely due to this organization rescuing easier to adopt dogs from New Jersey shelters.
Montclair Animal Shelter significantly exceeded its local dog adoption target. In April 2016, a fire destroyed much of this facility. The shelter utilized many foster homes to save its animals. Since I assumed the shelter had no capacity from April through December of 2016, the shelter’s adoption target was very low. Nonetheless, Montclair Animal Shelter deserves credit for aggressively placing its dogs into foster homes and more than doubling its estimated local dog adoptions from the prior year.
Five other animal control shelters exceeded their adoption targets, but this was likely due to factors unrelated to performance. As discussed above, both Northern Ocean Animal Facility and Southern Ocean Animal Facility reported no animals sent to rescues. Personally, I doubt this is the case and it is likely rescues saved a significant number of dogs reported as adopted. Additionally, these two shelters may have benefited from the method I used to cap adoptions in the county and reduce the adoption targets for these two shelters. For example, Northern Ocean Animal Facility and Southern Ocean Animal Facility only reached 94% and 66% of their adoption targets using my unadjusted model only taking the shelter’s physical space into account. Similarly, while Toms River Animal Facility exceeded its dog adoption target, it only reached 45% of my unadjusted model adoption target. Since Associated Humane Societies-Popcorn Park reports a very large capacity (i.e. very high adoption potential), my model reduces all Ocean County animal shelters’ target adoptions to my county adoption cap. Therefore, Northern Ocean Animal Facility, Southern Ocean Animal Facility and Toms River Animal Facility have relatively low dog adoption targets. Thus, none of these shelters may have really done a great job adopting out dogs.
Two animal control shelters deserve mentioning. Camden County Animal Shelter was only three dogs shy of meeting its adoption target (it rounded to 100% on a percentage basis). As a large county shelter that includes a poor urban area, this is an impressive result. Similarly, Ewing Animal Shelter, which is operated by EASEL Animal Rescue League, came very close to meeting its adoption target.
Shelters adopting out the fewest animals in total relative to their targets were as follows:
Associated Humane Societies-Newark – 1,499 fewer dogs adopted than targeted
Associated Humane Societies-Popcorn Park – 1,095 fewer dogs adopted than targeted
Monmouth SPCA – 586 fewer dogs adopted than targeted
Plainfield Area Humane Society – 468 fewer dogs adopted than targeted
Bergen Protect and Rescue Foundation – 449 fewer dogs adopted than targeted
Bergen County Animal Shelter – 449 fewer dogs adopted than targeted
Shake a Paw-Union – 363 fewer dogs adopted than targeted
Paterson Animal Shelter – 323 fewer dogs adopted than targeted
Humane Society of Atlantic County – 241 fewer dogs adopted than targeted
Unsurprisingly, Associated Humane Societies has archaic adoption policies that make it more difficult to adopt than the procedures recommended from national animal welfare organizations. Furthermore, Associated Humane Societies-Newark, Associated Humane Societies-Tinton Falls, Paterson Animal Shelter, Monmouth SPCA, Bergen Protect and Rescue Foundation and Bergen County Animal Shelter had troublesome stories involving the shelters and/or prominent people affiliated with these organizations over the last few years. Humane Society of Atlantic County’s low local adoption figures are not surprising given the large number of out of state transported dogs it brings in and its relatively high estimated local death rate. Shake a Paw-Union’s low local adoption numbers are not surprising since it also operates a for profit pet store and transports almost all of its dogs it rescues from out of state. Finally, Plainfield Area Humane Society’s local dog adoption deficit is quite disturbing since this organization could easily take on Plainfield’s dogs who currently go to the horrific and high kill Associated Humane Societies-Newark.
Shelters Fail to Use Excess Space to Save Local Dogs
To further examine New Jersey animal shelters’ performance in saving the state’s homeless dogs, I compared the targeted number of dogs each shelter should pull from nearby shelters and compared it to the number actually rescued from local facilities. I assume all reported out of state rescued dogs came from southern or other far away states (except for Animal Alliance due to the shelter stating it primarily pulls out of state dogs from Pennsylvania). While some of the out of state rescued dogs may have comes from nearby areas, I believe this is a small number and does not significantly impact the results.
Virtually all New Jersey animal shelters are failing to rescue the number of local dogs they should. 92 of the 99 shelters should rescue some dogs from other local shelters. In fact, 48 of the 92 shelters with targeted excess capacity failed to rescue even a single dog from a New Jersey animal shelter. Of the 92 shelters with the space to rescue dogs from nearby shelters, only the following shelters met or exceeded their local dog rescue targets:
Somerset Regional Animal Shelter – 122 more dogs rescued than targeted
St. Hubert’s-North Branch – 93 more dogs rescued than targeted
Montclair Township Animal Shelter – 83 more dogs rescued than targeted
St. Hubert’s-Madison – 65 more dogs rescued than targeted
Beacon Animal Rescue – 62 more dogs rescued than targeted
Ramapo-Bergen Animal Refuge – 24 more dogs rescued than targeted
Mt. Pleasant Animal Shelter – 21 more dogs rescued than targeted
Montville Animal Shelter – 8 more dogs rescued than targeted
Common Sense for Animals – 6 more dogs rescued than targeted
Randolph Township Pound – 4 more dogs rescued than targeted
As mentioned above, many of these shelters local rescue numbers are inflated due to these organizations cherry picking highly adoptable animals to rescue. Thus, nearly all New Jersey animal shelters with targeted excess capacity are failing to do their share in ending the killing of local healthy and treatable dogs.
Camden County Animal Shelter also deserves mentioning. This facility rescued 320 dogs from other New Jersey shelters last year. While this is an obviously good thing, this may have artificially decreased this shelter’s estimated local death rate by as much as 2% if it only pulled highly adoptable dogs.
Shelters can overcome challenges in rescuing dogs from outside their service area. In some cases, municipalities may frown on government run shelters using taxpayer funds to rescue dogs from elsewhere. However, shelter directors at these facilities can encourage individuals to form a non-profit or raise money on their own to pay for these rescued dogs. Additionally, shelters with limited capacity or even some of the well-off private shelters could contribute funding for each dog rescued. For example, Maddie’s Fund paid an approximate $160 subsidy to rescues pulling dogs from New York Animal Care & Control. Similarly, private shelters with excess space, but limited financial resources, could expand their fundraising efforts to save more local dogs. Thus, perceived obstacles to rescuing local dogs can and should be overcome.
New Jersey Animal Shelters Need to Form Life-Saving Coalitions
The improper allocation of space within the state’s animal shelter system requires organizations to form coalitions. While putting a competent and compassionate director in every shelter would likely be even more effective, that will likely take time to do. No kill coalitions between animal control facilities and selective admission shelters have been used in places, such as Portland, Oregon, Reno, Nevada, Jacksonville, Florida and Austin, Texas to radically increase life saving. Maddie’s Fund, which has supported using coalitions for over a decade, has many resources for organizations seeking to collaborate with each other. Thus, New Jersey animal shelters need to formally work together, develop quantifiable and measurable goals (such as the targeted outcomes in this blog), and hold each organization accountable for meeting these benchmarks.
Sobering Results Require Shelter Leaders to Critically Examine Themselves
Shelters should examine the reasons why their adoption numbers fall far short of these benchmarks. In some cases, shelters need to expand the hours they are open for adoptions. Many shelters should switch from an overly judgmental adoption process based on black and white rules to a conversational one focused on educating the adopter. Organizations will need to radically increase their off-site events and do same day adoptions. Similarly, many shelters must reduce adoption fees and run frequent promotions. Executive Directors should monitor the latest life-saving programs on Maddie’s Fund’s, ASPCA Pro’s, the 2015 and 2016 American Pets Alive Conference’s, and the Best Friends National Conference’s web sites and put some of these policies into place. Shelter management teams will need to ensure their facilities are clean and customers are treated with respect (this can be measured by encouraging the public to complete surveys). Thus, poorly performing shelters need to stop making excuses and do what it takes to reach their adoption potential.
We can turn New Jersey, New York City and Philadelphia into no kill communities. It is time we give our money and volunteer efforts to organizations who raise their performance to help us reach that goal. To do otherwise, would betray all the animals whose lives are on the line.
Appendix – Life Saving Model Assumptions
The Life Saving Model utilizes the following basic animal shelter population equations to calculate the targeted dog outcomes for each facility:
Daily capacity or population = Daily animal intake x average length of stay
Average length of stay = Daily capacity or population/daily intake
Each shelter’s community dog intake (i.e. owner surrenders, strays, cruelty bite cases), number of dogs returned to owners, and maximum dog capacity were taken from its 2016 “Shelter/Pound Annual Report” submitted to the New Jersey Department of Health.
This data was then used as follows:
Community dog intake and dogs returned to owners were initially estimated for each month by dividing the annual figures by 12. In order to take into account the extra space in low intake months and reduced space in high intake months, we multiply that number by each month’s percentage of the average month. For example, assume 240 dogs were taken in during the year and the average month equals 20 dogs (240/12). In July, the dog intake is 120% higher than the average month and we therefore multiply 20 dogs by 1.2 to equal 24 dogs. If 120 dogs were returned to owners during the year, the estimated number of dogs returned to owners in July would equal 12 dogs (120/12 = 10; 10*1.2). The monthly intake percentages were based off the average of the 2016 dog intake data on New York Animal Care & Control’s and ACCT Philly’s web sites.
The estimated number of community dogs returned to owners each month are then assumed to stay 5 days on average at shelters based on data from other shelters across the country. If anything, this estimate is conservative (i.e. average length of stay for dogs returned to owners may be less than 5 days and therefore frees up more shelter space for adoptions) based on some shelters returning the bulk of their dogs to owners within 3 days.
The number of community dogs euthanized (including animals who died or are missing) is set to equal 5% of intake. 5% is a reasonable standard euthanasia rate for shelters in New Jersey to meet given few vulnerable stray puppies (i.e. who could die or require euthanasia) arrive in the state’s animal shelters. The average length of stay for euthanized dogs is assumed to equal 14.5 days. Half of dogs are assumed euthanized for untreatable aggression towards people and 21 days is the time estimated to make that determination. The other half of dogs are assumed euthanized for severe and untreatable health issues and I estimate these dogs are euthanized after 8 days (subsequent to the end of the stray hold and owner surrender protection periods).
Adopted dogs are assumed to stay at shelters for varying lengths of time. Adoption length of stay was based on data from a study in the Journal of Applied Animal Welfare and the figures used (except for space-constrained shelters) are located in a prior blog on pit bull adoption. The data primarily comes from Tompkins County SPCA during a time it saved over 90% of its dogs. This was a fairly conservative data set to use as other no kill open admission shelters’ average length of stay are substantially shorter. Specifically, the following assumptions were made:
80% and 20% of each communities dogs (including pit bulls) were adults 1 year and older and under 1 year.
Pit bulls were assumed to comprise 50%, 35% and 25% of community dog intake at poor, middle/upper middle class, and wealthy area animal control shelters. While some shelters may have pit bulls comprising more than 50% of their shelter dog population at a given time, this is due to pit bulls longer average length of stay. For example, a shelter with pit bulls making up 50% of their dog intake and pit bulls having an average length of stay three times longer than other dogs will have pit bulls constituting 75% of the dog population. Shelters without animal control contracts were assumed to only have pit bulls make up 10% of their community dogs (i.e. strays and owner surrenders) based on most of these shelters’ highly selective admission practices.
Pit bull adoption length of stay was taken directly from the Journal of Applied Animal Welfare study. The average adoption lengths of stay for other breeds from this study were averaged and used for dogs other than pit bulls in the analysis
Space constrained shelters were assumed to adopt out their easiest to adopt animals first until they ran out of space. To estimate the average adoption length of stay, I used pit bull adoption length of stay data from Greenhill Humane Society from March 2013 through May 2015. I broke the adoption length of stay data into 5 groups that each made up 20% of the data. The average adoption length of stay for each of these 5 groups was calculated. The average adoption length of stay of each group was divided by the average length of stay for all of the adopted pit bulls in the Greenhill Humane Society data set. Those percentages were then multiplied by the average dog adoption length of stay determined in the previous bullet and used to determine the adoption lengths of stay used for space-constrained shelters.
Dogs transferred to rescue or other facilities are assumed to stay at shelters 8 days on average based on the assumption strays can’t be released until the 7 day hold period elapses.
Community dogs not returned to owners or euthanized are initially assumed as adopted for each month. However, if the calculated length of stay exceeds the shelter’s required length of stay, dogs are moved from adoption (i.e. longer length of stay) to rescue (i.e. shorter length of stay) until the calculated length of stay each month approximately equals the required length of stay.
Animal control shelters have a minimum of 10% of unclaimed dogs go to rescues. To the extent shelters transfer 10% of unclaimed dogs to rescues despite having space (i.e. reclassifying dogs from adoptions with a longer length of stay to rescues with a shorter length of stay), I do not require these facilities to use that space to rescue additional dogs.
Required length of stay = Shelter’s reported capacity/adjusted daily intake for the month. Adjusted daily intake for month = Adjusted monthly intake per first bullet above/the number of days in the month.
Shelters with excess capacity are assumed to use the extra space to rescue and adopt out dogs from other New Jersey animal shelters. To the extent all healthy and treatable New Jersey animal shelter dogs are saved, I assume additional dogs are pulled from nearby states with similar types of dogs. I assume all rescued dogs will not be killed since the transferring and receiving shelters should evaluate these dogs’ behavior. Based on pit bull type dogs having longer lengths of stay at shelters, I assume 80% of dogs rescued from local animal shelters are pit bulls and 20% are non-pit bulls. 80% and 20% of pit bull and non-pit bull type dogs are considered 1 year and older and under 1 year. The average length of stay for rescued pit bulls and other dogs are the same as the adoption length of stay figures above.
Each month’s targeted outcomes are added to determine how many local dogs New Jersey animal shelters should adopt out, send to rescue, rescue from other nearby animal shelters and euthanize.
The targeted number of dogs rescued and adopted were capped at 2 pit bulls per 1,000 people in each county. If the model yielded a higher result than this cap, the targeted numbers of dogs adopted were set to equal to this cap using the pit bull percentage assumptions above. For shelters in these counties (except Passaic County), I calculated the cap at the county level and then reduced the number of cats adopted for the county to equal the cap. I excluded West Milford from Passaic County due the town’s large distance from the population centers in the rest of the county. Each shelter’s percentage of total targeted adoptions in the county from the unmodified model were applied to the the total reduction in the number of adoptions in the county to yield the targeted numbers of dogs adopted in the modified model. If the shelter also rescued animals from other shelters, the rescued numbers were also reduced since I assume rescued animals are adopted.
In a blog from earlier this year, I disclosed New Jersey’s depressing animal shelter statistics. This blog explains why so many dogs are losing their lives in the state’s animal shelters and whether these facilities can end the killing.
Successful organizations set measurable goals and regularly monitor their performance. Examples include financial budgets, customer and employee satisfaction surveys, and product reliability metrics. Unfortunately, many animal shelters for far too long have failed to set lifesaving goals and standards. Municipalities, donors and volunteers need to know where their resources will be best utilized. Time and money are scarce resources and people should allocate these assets to organizations who will best utilize them. As a result, animal shelters need to set goals and hold their leadership and staff accountable for achieving these objectives.
Model Assesses New Jersey Animal Shelters’ Life Saving Performance
In order to assess how good of a job New Jersey animal shelters are doing, I’ve developed an analysis I call the “Life Saving Model.” While shelter performance is dependent on many variables, such as finances, facility design, local laws, etc., the most critical factor impacting potential life saving is physical space. Without having enough physical space, a shelter might not have enough time to find loving homes for its animals. Shelters can overcome financial limitations through creative fundraising or recruiting more volunteers. Similarly, organizations can save their dogs despite having run down facilities if these groups enthusiastically implement policies to get animals into loving homes quickly. As a result, my analysis focuses on making the best use of space to save the maximum number of New Jersey dogs.
The Life Saving Model measures the number of local animals a shelter should adopt out, rescue from other facilities, send to rescues or other shelters, and euthanize. The targeted outcomes take into account each facility’s physical capacity and the number and types of dogs the organization receives from its community (i.e. strays, owner surrenders, cruelty/bite cases). I assume a target euthanasia rate, take the number of dogs actually returned to owners and then estimate how many community dogs a shelter should adopt out. To the extent space runs out, I then calculate how many dogs the shelter must send to rescues. If the shelter has excess space after properly serving its local community, the facility uses that room to rescue and adopt out dogs from nearby areas. The targeted results calculated from this model are compared to the actual or estimated actual results from each shelter below.
To read specific details and assumptions used in the model, please see the Appendix at the end of this blog.
My analysis puts a cap on the targeted numbers of rescued dogs from other shelters and adoptions. While my unmodified targeted numbers of rescued and adopted animals are quite achievable, I want to provide very conservative goals for New Jersey animals shelters. For example, the unmodified model resulted in a statewide per capita dog adoption rate less than one half to one quarter the level found at some of the best animal control shelters. Similarly, the unmodified model yielded a statewide pit bull per capita adoption rate (2.2 pit bulls per 1,000 people) that is less than one of the best animal control shelters in the country. In my opinion, New Jersey shelters could more easily achieve that pit bull adoption rate given my model includes far fewer dogs from competing breeds than those in this role model animal control shelter.
My modified analysis capped pit bull adoptions at 2 pit bulls per 1,000 people within each New Jersey county. In other words, the targeted numbers of dogs rescued from other shelters and adopted below are the lesser of
Number predicted by model
Number determined by capping pit bull adoptions at 2 pit bulls per 1,000 people in the county
In simple terms, a shelter is expected to achieve this per capita adoption rate unless the facility lacks enough space. If a shelter does not have sufficient room, it won’t have the time to reach all the potential adopters and requires assistance from rescues and/or other facilities. Given my model assumes 80% of rescued dogs are pit bull like dogs, my targeted numbers of dogs rescued and adopted are quite low as detailed in the section below. For example, shelters in counties where dog adoptions are capped have extra space that they do not use to adopt out other dog breeds.
New Jersey Animal Shelters Contain Enough Space to Save All of New Jersey’s Dogs and Many More from Other States
New Jersey’s animal shelter system has enough space to save all of the state’s healthy and treatable dogs. The table below details the targeted numbers of dog outcomes the New Jersey animal shelter system should achieve. Out of the 23,344 New Jersey dogs coming into the state’s animal shelters in 2015, 12,363 and 1,177 dogs should have been adopted out and sent to other shelters/rescues by the facilities originally taking the dogs in. However, other New Jersey animal shelters had more than enough capacity to rescue the 1,177 dogs from space constrained facilities. Thus, New Jersey animal shelters should be able to able to adopt out every single healthy and treatable dog taken in from the state and not require any support from rescue organizations without physical facilities.
New Jersey animal shelters have enough excess space to save many dogs from out of state as well. Specifically, New Jersey animal shelters had enough physical capacity to rescue and adopt out 9,066 dogs from out of state after achieving a 95% live release rate for New Jersey dogs. To put this number into perspective, New Jersey animal shelters could make both New York City and Philadelphia no kill cities for dogs and increase those cities’ dog live release rates to 95% in 2015 as follows:
New York City – 1,282 additional dogs need saving
Philadelphia – 1,728 additional dogs need saving
Additionally, New Jersey animal shelters could save another 6,056 dogs from other locations outside of the state. Of course, some New Jersey animal shelters do pull some dogs from New York City and Philadelphia animal control shelters. However, most of these dogs are likely easy to adopt and therefore have short lengths of stay. As a result, the additional number of dogs New Jersey animal shelters could save from New York City, Philadelphia and elsewhere is probably not much lower than the figures above. Thus, New Jersey animal shelters could make New Jersey a no kill state for dogs as well as many other places.
These adoption goals are quite achievable when comparing the performance of well-run animal control shelters across the country. New Jersey animal shelters would only need to adopt out 2.5 dogs per 1,000 people in the state (1.5 dogs if no dogs rescued from out of state). As a comparison, recent per capita dog adoption numbers from several high performing no kill open admission shelters are as follows:
Lynchburg Humane Society (Lynchburg, Virginia) – 14.2 dogs per 1,000 people
Longmont Humane Society (Longmont, Colorado area) – 10.8 dogs per 1,000 people
Nevada Humane Society (Reno, Nevada and Carson City, Nevada areas) – 8.4 dogs per 1,000 people
Charlottesville-Albemarle SPCA (Charlottesville, Virginia area) – 8.2 dogs per 1,000 people
KC Pet Project (Kansas City, Missouri) – 6.9 dogs per 1,000 people
Thus, many communities are already adopting out around three to six times as many dogs as the goal set for New Jersey animal shelters.
Some naysayers may claim New Jersey would have a more difficult time due to the state’s shelters taking in many pit bulls. However, this is a myth. My model estimates New Jersey animal shelters would need to adopt out roughly 0.6 pit bulls per 1,000 people to save 95% of New Jersey’s dogs. Our shelters would only need to adopt out around 1.4 pit bulls per 1,000 people if New Jersey shelters also rescued and adopted out the targeted number of pit bulls from other states. As a comparison, I estimate Longmont Humane Society adopts out 2.4 pit bulls per 1,000 people based on its 2014 per capita pit bull intake, the percentage dog adoptions were of total outcomes at the shelter in 2014 and Longmont Humane Society’s 15% increase in dog adoptions in 2015 compared to 2014. Furthermore, the pit bull adoption targets are even more reasonable given the model assumes there are roughly 1/8 of the number of dogs from other breeds to compete with in the New Jersey adoption market compared to the Longmont, Colorado area.
Animal Deaths Vary Widely at New Jersey Animal Shelters
The goal of any properly managed animal shelter is to save all of its healthy and treatable animals. In some cases, such as selective admission rescue oriented shelters, it is pretty easy to not kill animals. In addition, other animal shelters with easy to service animal control contracts (i.e. few animals impounded, most strays quickly returned to owners) can avoid unnecessary killing due to having lots of extra space. As a result, some shelters may have an easier time than others in preventing killing at their shelters.
The table below details the local dog death rates. Consistent with the Life Saving Model’s assumptions, the actual dogs euthanized/killed/died/missing assumes these dogs came from the local community. All dogs missing are assumed “dead” based on the assumption they died or went to a very bad place. Furthermore, I assume all dogs listed in the “Other” category on each shelter’s reporting form are dead or missing. Shelters having local dog death rates less than and greater than 5% are highlighted in green and red in the table below.
Several rescue oriented shelters had unusually high local dog death rates. While this number may be higher if some rescued dogs are euthanized/killed (i.e. targeted number assumes no rescued dogs are killed/euthanized) or many terminally ill dogs are surrendered for owner-requested euthanasia, this may possibly point to overly strict temperament testing at these facilities. In the case of St. Hubert’s-Madison, which had a total dog death rate of 6% (i.e. percentage of all dogs taken in and not just community dogs) and a local dog death rate of 10%, the total death rate may be artificially depressed by easy to adopt transported dogs. For the Humane Society of Atlantic County, which has no animal control contracts, the total dog death rate of 28% is shockingly high for a rescue oriented shelter and raises serious questions about how life and death decisions are made by this organization. The local death rates at other rescue oriented shelters, such as Ramapo-Bergen Animal Refuge and Common Sense for Animals (local death rates of 1% and 2%) are much lower than St. Hubert’s-Madison and the Humane Society of Atlantic County. Thus, I find it difficult to believe St. Hubert’s-Madison’s and Humane Society of Atlantic County’s larger than expected local death rates are due to them rescuing a large percentage of their dogs from other shelters.
The largest number of dogs unnecessarily dying occurred at a relatively small number of shelters. Specifically, 12 out of 96 or 13% of the shelters accounted for 81% of the 2,355 dogs unnecessarily losing their lives. Shelters with the greatest number of unnecessary dog deaths are as follows:
Associated Humane Societies – Newark (463)
Trenton Animal Shelter (236)
Gloucester County Animal Shelter (217)
Burlington County Animal Shelter (174)
Thus, the bulk of the dogs unnecessarily dying at New Jersey animals shelters occurs at a small number of facilities.
Most New Jersey Animal Shelters Require Little Rescue Assistance
Some animal shelters will require more support from rescues and animal shelters with excess space than others. If a shelter has relatively high intake, very limited space, and few stray dogs returned to owners, it will need more help than other shelters. The table below compares the number of dogs a shelter should transfer to other organizations per the model and the number of dogs actually sent to other animal welfare groups. Shelters marked in green are receiving less than the expected rescue support while facilities marked in red are receiving too much rescue help.
Overall, most New Jersey animal shelters require little rescue support if space-constrained facilities fast-track their most highly adoptable dogs. Shelter medicine experts advocate prioritizing the processing of highly adoptable animals to make the best use of space and reduce disease. For example, making sure these animals are the first to get spayed/neutered and vaccinated and receive microchips to ensure they can leave as soon as the shelter finds a good home.
Three shelters did not receive enough help from other animal welfare organizations. Only 12 out of the 96 facilities require any rescue support. In other words, 84 of the 96 animal shelters in the state should not need rescues or other shelters to pull any dogs due to limited space. Northern Ocean Animal Facility, Southern Ocean Animal Facility and Harmony Animal Hospital received less rescue support than needed. However, none of the shelters reported rescues taking any animals, which raises questions as to whether these shelters correctly reported their data. Thus, virtually all New Jersey shelters are receiving enough rescue assistance.
Associated Humane Societies-Newark hogged up the most rescue support. Specifically, rescues and other shelters pulled 701 more dogs than needed from AHS-Newark. Even worse, AHS-Tinton Falls and AHS-Popcorn Park rescued far fewer dogs than they should. As a result of this poor performance, AHS diverted much needed rescue assistance from more needy shelters in the region.
Rescue groups and shelters with extra space should pull dogs from kill shelters with the highest rescue “target” numbers and deficits in the tables below. If shelters not needing rescue support get that extra help, these shelters will not take the steps necessary to properly run their facilities. As a result of enabling poorly performing shelters and not pulling dogs from truly space constrained facilities, rescuing dogs from shelters with enough space leads to less lifesaving.
Shelters receiving less than needed rescue support should also examine their own policies and performance. Are the shelter’s operating processes allowing too many animals to get sick and therefore discouraging organizations to rescue their animals due to subsequent medical costs? Does the shelter actively reach out to rescues/other shelters and treat them with respect? Does the shelter make it convenient for other organizations to pull their animals?
Given killing animals for space is intolerable, the space-constrained shelters need to expand their effective dog capacity. These facilities could use extra space in their buildings to house dogs on a short-term basis. These shelters can enter into arrangements with local veterinarians to house and adopt out some dogs. Furthermore, shelters can create or expand foster programs to increase the number of dogs cared for. Additionally, creating a pet owner surrender prevention program and making serious efforts to return lost dogs to owners could free up space in these shelters. Finally, space-constrained shelters with multiple animal control contracts should terminate some of these arrangements to bring their capacity for care in line with the number of dogs they take in. As a result, space constrained shelters still need to take active steps to reduce killing rather than simply solely relying on rescue support.
In certain circumstances, it may make sense for shelters with excess space to send dogs to rescues. For example, a unique breed or a dog needing very specialized behavioral or medical rehabilitation. However, these cases are relatively uncommon and do not significantly impact this analysis.
Most New Jersey Animal Shelters Fail to Come Close to Reaching Their Local Dog Adoption Potential
We can assess each shelter’s contribution to making New Jersey and nearby areas no kill. While a shelter may be able to avoid killing healthy and treatable animals, it still may not live up to its potential for adopting out local dogs. On the other hand, a space constrained shelter may kill healthy and treatable dogs, but still do a good job adopting animals out.
The tables below compare the number of dogs from New Jersey and nearby states each animal shelter should adopt out with the estimated number of local dogs actually adopted out.
Many rescue oriented shelters likely pull much easier to adopt dogs than the bulk of dogs needing to get rescued from local facilities. Thus, the results from rescue oriented shelters may look better than they actually are.
Few organizations reached or exceeded their adoption targets. Specifically, only 8 out of 96 shelters met the adoptions goals computed by the Life Saving Model. Thus, the overwhelming number of New Jersey animal shelters need to step up their adoption efforts.
Several rescue oriented shelters exceeded or came close to achieving their adoption targets. Beacon Animal Rescue and Ramapo-Bergen Animal Refuge adopted out more animals than I targeted. While these organizations are both rescue-oriented shelters that appear to pull fewer pit bulls than I target, these two shelters do at least have a reasonable number of pit bull like dogs up for adoption. Additionally, these shelters rescue animals primarily from other New Jersey animal shelters rather than transport large numbers of dogs from the south. St. Hubert’s-Madison and St. Hubert’s-North Branch also exceeded their adoption targets. Despite these shelters having some animal control contracts, this organization rescues most of its animal from other shelters. St. Hubert’s uses progressive adoption policies, such as open or conversational based adoptions, adopts animals out as gifts, and adopts out animals almost every day of the year. On the other hand, St. Hubert’s appears to rescue far more adoptable animals than my model assumes (i.e. 80% of rescued dogs are pit bulls) and that likely also may explain their strong performance. Mt. Pleasant Animal Shelter and Salem County Humane Society also exceeded their adoption targets, but this is likely due to these organizations rescuing easier to adopt dogs from New Jersey.
Three animal control shelters exceeded their adoption targets, but this was likely due to factors unrelated to performance. As discussed above, both Northern Ocean Animal Facility and Southern Ocean Animal Facility reported no animals sent to rescue. Personally, I doubt this is the case and it is likely rescues saved a significant number of dogs reported as adopted. Additionally, these two shelters may have benefited from the method I used to cap adoptions in the county and reduce the adoption targets for these two shelters. For example, Northern Ocean Animal Facility and Southern Ocean Animal Facility only reached 84% and 87% of their adoption targets using my unadjusted model only taking the shelter’s physical space into account. Similarly, Montville Animal Shelter also likely benefited from the method I used to cap adoptions as the shelter only reached 34% of its unadjusted adoption target. Thus, none of the animal control shelters in the state may have really done a great job adopting out dogs.
Shelters adopting out the fewest animals in total relative to their targets were as follows:
Associated Humane Societies-Newark – 1,727 fewer dogs adopted than targeted
Associated Humane Societies-Popcorn Park – 1,138 fewer dogs adopted than targeted
Monmouth SPCA – 587 fewer dogs adopted than targeted
Bergen Protect and Rescue Foundation – 530 fewer dogs adopted than targeted
Bergen County Animal Shelter – 477 fewer dogs adopted than targeted
Unsurprisingly, Associated Humane Societies has archaic adoption policies that make it more difficult to adopt than the procedures recommended from national animal welfare organizations. Furthermore, Associated Humane Societies-Newark, Associated Humane Societies-Tinton Falls, Monmouth SPCA, Bergen Protect and Rescue Foundation and Bergen County Animal Shelter had troublesome stories involving the shelters and/or prominent people affiliated with these organizations over the last couple of years.
Shelters Fail to Use Excess Space to Save Local Dogs
To further examine New Jersey animal shelters’ performance in saving the state’s homeless dogs, I compared the targeted number of dogs each shelter should pull from nearby shelters and compared it to the number actually rescued from local facilities. I assume all reported out of state rescued dogs came from southern or other far away states (except for Animal Alliance due to the shelter stating it primarily pulls out of state dogs from Pennsylvania). While some of the out of state rescued dogs may have comes from nearby areas, I believe this is a small number and does not significantly impact the results.
Virtually all New Jersey animal shelters are failing to rescue the number of local dogs they should. 87 of the 96 shelters should rescue some dogs from other local shelters. In fact, 50 of the 87 shelters with targeted excess capacity failed to rescue even a single dog from a New Jersey animal shelter. Of the 87 shelters with the space to rescue dogs from nearby shelters, only Somerset Regional Animal Shelter, Montville Animal Shelter, Salem County Humane Society, Animal Welfare Association, Mt. Pleasant Animal Shelter, St. Hubert’s-North Branch, St. Hubert’s-Madison, Beacon Animal Rescue and Ramapo-Bergen Animal Refuge met or exceeded their local dog rescue targets. As mentioned above, many of these shelters local rescue numbers are inflated due to these organizations cherry picking highly adoptable animals to rescue. Thus, nearly all New Jersey animal shelters with targeted excess capacity are failing to do their share in ending the killing of local healthy and treatable dogs.
Shelters can overcome challenges in rescuing dogs from outside their service area. In some cases, municipalities may frown on government run shelters using taxpayer funds to rescue dogs from elsewhere. However, shelter directors at these facilities can encourage individuals to form a non-profit or raise money on their own to pay for these rescued dogs. Additionally, shelters with limited capacity or even some of the well-off private shelters could contribute funding for each dog rescued. For example, Maddie’s Fund paid an approximate $160 subsidy to rescues pulling dogs from New York Animal Care & Control. Similarly, private shelters with excess space, but limited financial resources, could expand their fundraising efforts to save more local dogs. Thus, perceived obstacles to rescuing local dogs can and should be overcome.
New Jersey Animal Shelters Need to Form Life-Saving Coalitions
The improper allocation of space within the state’s animal shelter system requires organizations to form coalitions. While putting a competent and compassionate director in every shelter would likely be even more effective, that will likely take time to do. No kill coalitions between animal control facilities and selective admission shelters have been used in places, such as Portland, Oregon, Reno, Nevada, Jacksonville, Florida and Austin, Texas to radically increase life saving. Maddie’s Fund, which has supported using coalitions for over a decade, has many resources for organizations seeking to collaborate with each other. Thus, New Jersey animal shelters need to formally work together, develop quantifiable and measurable goals (such as the targeted outcomes in this blog), and hold each organization accountable for meeting these benchmarks.
Sobering Results Require Shelter Leaders to Critically Examine Themselves
Shelters should examine the reasons why their adoption numbers fall far short of these benchmarks. In some cases, shelters need to expand the hours they are open for adoptions. Many shelters should switch from an overly judgmental adoption process based on black and white rules to a conversational one focused on educating the adopter. Organizations will need to radically increase their off-site events and do same day adoptions. Similarly, many shelters must reduce adoption fees and run frequent promotions. Executive Directors should monitor the latest life-saving programs on Maddie’s Fund’s, ASPCA Pro’s, the 2015 American Pets Alive Conference’s and the Best Friends National Conference’s web sites and put some of these policies into place. Shelter management teams will need to ensure their facilities are clean and customers are treated with respect (this can be measured by encouraging the public to complete surveys). Thus, poorly performing shelters need to stop making excuses and do what it takes to reach their adoption potential.
We can turn New Jersey, New York City and Philadelphia into no kill communities. It is time we give our money and volunteer efforts to organizations who raise their performance to help us reach that goal. To do otherwise, would betray all the animals whose lives are on the line.
Appendix – Life Saving Model Assumptions
The Life Saving Model utilizes the following basic animal shelter population equations to calculate the targeted dog outcomes for each facility:
Daily capacity or population = Daily animal intake x average length of stay
Average length of stay = Daily capacity or population/daily intake
Each shelter’s community dog intake (i.e. owner surrenders, strays, cruelty bite cases), number of dogs returned to owners, and maximum dog capacity were taken from its 2015 “Shelter/Pound Annual Report” submitted to the Office of Animal Welfare.
This data was then used as follows:
Community dog intake and dogs returned to owners were initially estimated for each month by dividing the annual figures by 12. In order to take into account the extra space in low intake months and reduced space in high intake months, we multiply that number by each month’s percentage of the average month. For example, assume 240 dogs were taken in during the year and the average month equals 20 dogs (240/12). In July, the dog intake is 120% higher than the average month and we therefore multiply 20 dogs by 1.2 to equal 24 dogs. If 120 dogs were returned to owners during the year, the estimated number of dogs returned to owners in July would equal 12 dogs (120/12 = 10; 10*1.2). The monthly intake percentages were based off the average of the 2015 dog intake data on New York Animal Care & Control’s and ACCT Philly’s web sites.
The estimated number of community dogs returned to owners each month are then assumed to stay 5 days on average at shelters based on data from other shelters across the country. If anything, this estimate is conservative (i.e. average length of stay for dogs returned to owners may be less than 5 days and therefore frees up more shelter space for adoptions) based on some shelters returning the bulk of their dogs to owners within 3 days.
The number of community dogs euthanized (including animals who died or are missing) is set to equal 5% of intake. 5% is a reasonable standard euthanasia rate for shelters in New Jersey to meet given few vulnerable stray puppies (i.e. who could die or require euthanasia) arrive in the state’s animal shelters. The average length of stay for euthanized dogs is assumed to equal 14.5 days. Half of dogs are assumed euthanized for untreatable aggression towards people and 21 days is the time estimated to make that determination. The other half of dogs are assumed euthanized for severe and untreatable health issues and I estimate these dogs are euthanized after 8 days (subsequent to the end of the stray and owner surrender hold periods).
Adopted dogs are assumed to stay at shelters for varying lengths of time. Adoption length of stay was based on data from a study in the Journal of Applied Animal Welfare and the figures used (except for space-constrained shelters) are located in a prior blog on pit bull adoption. The data primarily comes from Tompkins County SPCA during a time it saved over 90% of its dogs. This was a fairly conservative data set to use as other no kill open admission shelters’ average length of stay are substantially shorter. Specifically, the following assumptions were made:
80% and 20% of each communities dogs (including pit bulls) were adults 1 year and older and under 1 year.
Pit bulls were assumed to comprise 50%, 35% and 25% of community dog intake at poor, middle/upper middle class, and wealthy area animal control shelters. While some shelters may have pit bulls comprising more than 50% of their shelter dog population at a given time, this is due to pit bulls longer average length of stay. For example, a shelter with pit bulls making up 50% of their dog intake and pit bulls having an average length of stay three times longer than other dogs will have pit bulls constituting 75% of the dog population. Shelters without animal control contracts were assumed to only have pit bulls make up 10% of their community dogs (i.e. strays and owner surrenders) based on most of these shelters’ highly selective admission practices.
Pit bull adoption length of stay was taken directly from the Journal of Applied Animal Welfare study. The average adoption lengths of stay for other breeds from this study were averaged and used for dogs other than pit bulls in the analysis
Space constrained shelters were assumed to adopt out their easiest to adopt animals first until they ran out of space. To estimate the average adoption length of stay, I used pit bull adoption length of stay data from Greenhill Humane Society from March 2013 through May 2015. I broke the adoption length of stay data into 5 groups that each made up 20% of the data. The average adoption length of stay for each of these 5 groups was calculated. The average adoption length of stay of each group was divided by the average length of stay for all of the adopted pit bulls in the Greenhill Humane Society data set. Those percentages were then multiplied by the average dog adoption length of stay determined in the previous bullet and used to determine the adoption lengths of stay used for space-constrained shelters.
Dogs transferred to rescue or other facilities are assumed to stay at shelters 8 days on average based on the assumption strays can’t be released until the 7 day hold period elapses.
Community dogs not returned to owners or euthanized are initially assumed as adopted for each month. However, if the calculated length of stay exceeds the shelter’s required length of stay, dogs are moved from adoption (i.e. longer length of stay) to rescue (i.e. shorter length of stay) until the calculated length of stay each month approximately equals the required length of stay.
Required length of stay = Shelter’s reported capacity/adjusted daily intake for the month. Adjusted daily intake for month = Adjusted monthly intake per first bullet above/the number of days in the month.
Shelters with excess capacity are assumed to use the extra space to rescue and adopt out dogs from other New Jersey animal shelters. To the extent all healthy and treatable New Jersey animal shelter dogs are saved, I assume additional dogs are pulled from nearby states with similar types of dogs. I assume all rescued dogs will not be killed since the transferring and receiving shelters should evaluate these dogs’ behavior. Based on pit bull type dogs having longer lengths of stay at shelters, I assume 80% of dogs rescued from local animal shelters are pit bulls and 20% are non-pit bulls. 80% and 20% of pit bull and non-pit bull type dogs are considered 1 year and older and under 1 year. The average length of stay for rescued pit bulls and other dogs are the same as the adoption length of stay figures above.
Each month’s targeted outcomes are added to determine how many local dogs New Jersey animal shelters should adopt out, send to rescue, rescue from other nearby animal shelters and euthanize.
The targeted number of dogs rescued and adopted were capped at 2 pit bulls per 1,000 people in each county. If the model yielded a higher result than this cap, the targeted numbers of dogs adopted were set to equal to this cap using the pit bull percentage assumptions above. For shelters in these counties (except Passaic County), I calculated the cap at the county level and then reduced the number of cats adopted for the county to equal the cap. I excluded West Milford from Passaic County due the town’s large distance from the population centers in the rest of the county. Each shelter’s percentage of total targeted adoptions in the county from the unmodified model were applied to the the total reduction in the number of adoptions in the county to yield the targeted numbers of dogs adopted in the modified model. If the shelter also rescued animals from other shelters, the rescued numbers were also reduced since I assume rescued animals are adopted.