In my last blog, I disclosed New Jersey’s depressing animal shelter statistics. This blog explains why so many dogs are losing their lives in the state’s animal shelters and whether these facilities can end the killing.
Successful organizations set measurable goals and regularly monitor their performance. Examples include financial budgets, customer and employee satisfaction surveys, and product reliability metrics. Unfortunately, many animal shelters for far too long have failed to set lifesaving goals and standards. Municipalities, donors and volunteers need to know where their resources will be best utilized. Time and money are scarce resources and people should allocate these assets to organizations who will best utilize them. As a result, animal shelters need to set goals and hold their leadership and staff accountable for achieving these objectives.
Model Assesses New Jersey Animal Shelters’ Life Saving Performance
In order to assess how good of a job New Jersey animal shelters are doing, I’ve developed an analysis I call the “Life Saving Model.” While shelter performance is dependent on many variables, such as finances, facility design, local laws, etc., the most critical factor impacting potential life saving is physical space. Without having enough physical space, a shelter might not have enough time to find loving homes for its animals. Shelters can overcome financial limitations through creative fundraising or recruiting more volunteers. Similarly, organizations can save their dogs despite having run down facilities if these groups enthusiastically implement policies to get animals into loving homes quickly. As a result, my analysis focuses on making the best use of space to save the maximum number of New Jersey dogs.
The Life Saving Model measures the number of local animals a shelter should adopt out, rescue from other facilities, send to rescues or other shelters, and euthanize. The targeted outcomes take into account each facility’s physical capacity and the number and types of dogs the organization receives from its community (i.e. strays, owner surrenders, cruelty/bite cases). I assume a target euthanasia rate, take the number of dogs actually returned to owners and then estimate how many community dogs a shelter should adopt out. To the extent space runs out, I then calculate how many dogs must be sent to rescue. If the shelter has excess space after properly serving its local community, the facility uses that room to rescue and adopt out dogs from nearby areas. The targeted results calculated from this model are compared to the actual or estimated actual results from each shelter below.
To read specific details and assumptions used in the model, please see the Appendix II at the end of this blog.
I modified the methodology for space-constrained shelters for this year’s analysis. Space constrained shelters do not have enough room to adopt out all of the animals they need to. Therefore, these shelters require rescue help. In the past, I assumed these shelters adopted out each dog based on the average time it takes to adopt out all dogs. However, many dogs require much less time to get adopted. Therefore, I assumed space-constrained shelters adopted out these animals first and then sent the dogs taking longer to adopt out to rescues. While this significantly changed the results for space-constrained shelters, this assumption only had a minor impact on the overall results for all New Jersey animal shelters.
I also revised my analysis this year to put a cap on the targeted numbers of rescued dogs from other shelters and adoptions. While my unmodified targeted numbers of rescued and adopted animals are quite achievable, I wanted to provide very conservative goals for New Jersey animals shelters. For example, the unmodified model resulted in a statewide per capita dog adoption rate less than half the level found at some of the best animal control shelters. Similarly, the unmodified model yielded a statewide pit bull per capita adoption rate (2.1 pit bulls per 1,000 people) equal to one of the best animal control shelters in the country. In my opinion, New Jersey shelters could more easily achieve that pit bull adoption rate given my model has far fewer dogs from competing breeds than those in this role model animal control shelter.
My modified analysis capped pit bull adoptions at 2 pit bulls per 1,000 people within each New Jersey county. In other words, the targeted numbers of dogs rescued from other shelters and adopted below are the lesser of
- Number predicted by model
- Number determined by capping pit bull adoptions at 2 pit bulls per 1,000 people in the county
In simple terms, a shelter is expected to achieve this per capita adoption rate unless the facility lacks enough space. If a shelter does not have sufficient room, it won’t have the time to reach all the potential adopters and requires assistance from rescues and/or other facilities. Given my model assumes most rescued dogs are pit bull like dogs, my targeted numbers of dogs rescued and adopted are quite low as detailed in the section below. For example, shelters in counties where dog adoptions are capped have extra space that they do not use to adopt out other dog breeds. See Appendix I at the end of this blog for a comparison of how the unmodified model’s results compare to the revised model with caps on rescued and adopted animals.
New Jersey Animal Shelters Contain Enough Space to Save All of New Jersey’s Dogs and Many More from Other States
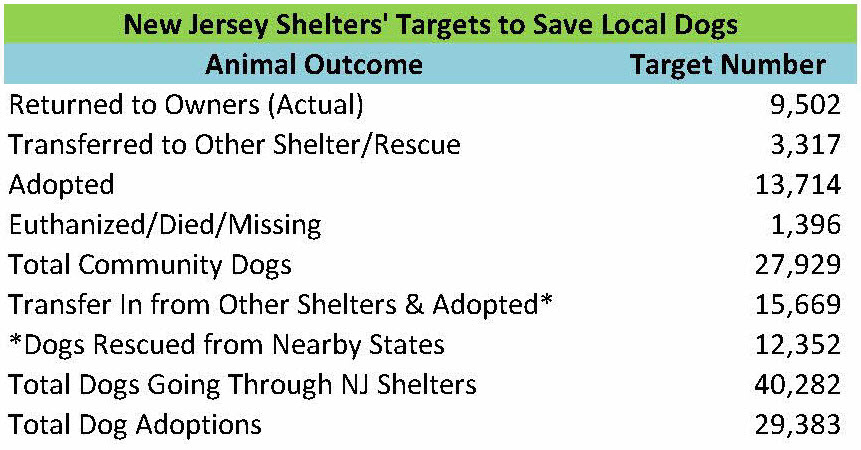
New Jersey’s animal shelter system has enough space to save all of the state’s healthy and treatable dogs. The table below details the targeted numbers of dog outcomes the New Jersey animal shelter system should achieve. Out of the 25,408 New Jersey dogs coming into the state’s animal shelters in 2014, 14,033 and 1,145 dogs should have been adopted out and sent to other shelters/rescues by the facilities originally taking the dogs in. However, other New Jersey animal shelters had more than enough capacity to rescue the 1,145 dogs from space constrained facilities. Thus, New Jersey animal shelters should be able to able to adopt out every single healthy and treatable dog taken in from the state and not require any support from rescue organizations without physical facilities.
New Jersey animal shelters have enough excess space to save many dogs from out of state as well. Specifically, New Jersey animal shelters had enough physical capacity to rescue and adopt out 8,603 dogs from out of state after achieving a 95% live release rate for New Jersey dogs. To put this number into perspective, New Jersey animal shelters could make both New York City and Philadelphia no kill cities for dogs and increase those cities’ dog live release rates to 95% in 2014 as follows:
- New York City – 1,877 additional dogs need saving
- Philadelphia – 2,113 additional dogs need saving
Additionally, New Jersey animal shelters could save another 4,613 dogs from other locations outside of the state. Of course, some New Jersey animal shelters do pull some dogs from New York City and Philadelphia animal control shelters. However, most of these dogs are likely easy to adopt and therefore have short lengths of stay. As a result, the additional number of dogs New Jersey animal shelters could save from New York City, Philadelphia and elsewhere is probably not much lower than the figures above. Thus, New Jersey animal shelters could make New Jersey a no kill state for dogs as well as many other places.
These adoption goals are quite achievable when comparing the performance of well-run animal control shelters across the country. New Jersey animal shelters would only need to adopt out 2.7 dogs per 1,000 people in the state (1.7 dogs if no dogs rescued from out of state). As a comparison, recent per capita dog adoption numbers from several high performing no kill open admission shelters are as follows:
- Longmont Humane Society (Longmont, Colorado area) – 9.4 dogs per 1,000 people
- Charlottesville-Albemarle SPCA (Charlottesville, Virginia area) – 9.1 dogs per 1,000 people
- Nevada Humane Society (Reno, Nevada area) – 8.2 dogs per 1,000 people
- KC Pet Project (Kansas City, Missouri) – 7.3 dogs per 1,000 people
Thus, many communities are already adopting out around three times as many dogs as the goal set for New Jersey animal shelters.
Some naysayers may claim New Jersey would have a more difficult time due to the state’s shelters taking in many pit bulls. However, this is a myth. My model estimates New Jersey animal shelters would need to adopt out roughly 0.7 pit bulls per 1,000 people to save 95% of New Jersey’s dogs. Our shelters would only need to adopt out around 1.4 pit bulls per 1,000 people if New Jersey shelters also rescued and adopted out the targeted number of pit bulls from other states. As a comparison, I estimate Longmont Humane Society adopts out 2.1 pit bulls per 1,000 people based on its per capita pit bull intake and the percentage dog adoptions are of total outcomes at the shelter. Furthermore, the pit bull adoption targets are even more reasonable given the model assumes there are roughly 1/5 of the number of dogs from other breeds to compete with in the New Jersey adoption market compared to the Longmont, Colorado area.

Animal Deaths Vary Widely at New Jersey Animal Shelters
The goal of any properly managed animal shelter is to save all of its healthy and treatable animals. In some cases, such as selective admission rescue oriented shelters, it is pretty easy to not kill animals. In addition, other animal shelters with easy to service animal control contracts (i.e. few animals impounded, most strays quickly returned to owners) can avoid unnecessary killing due to having lots of extra space. As a result, some shelters may have an easier time than others in preventing killing at their shelters.
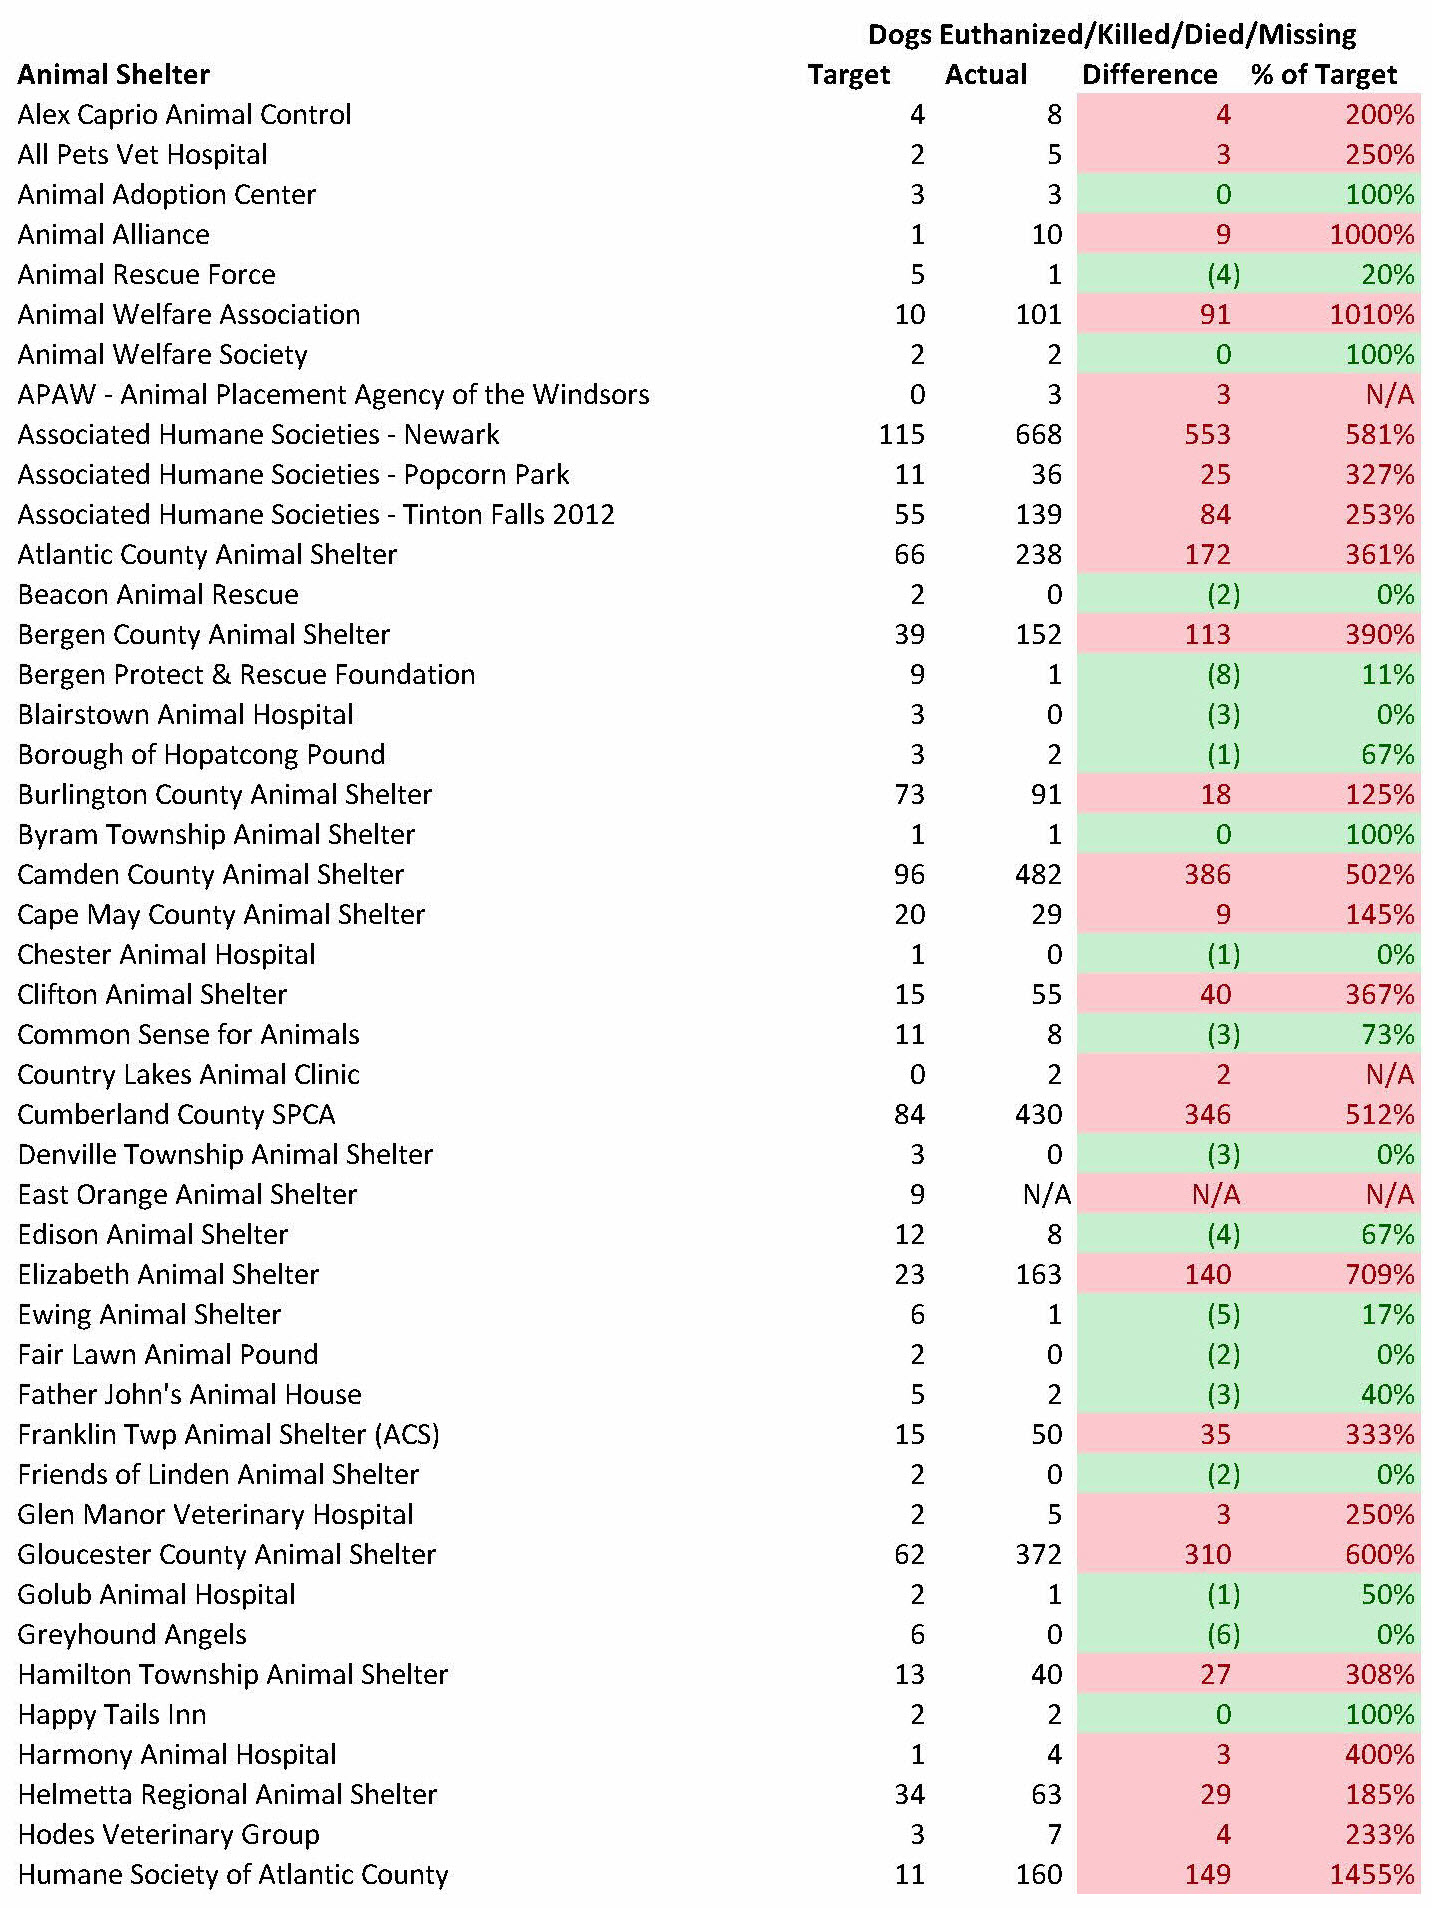
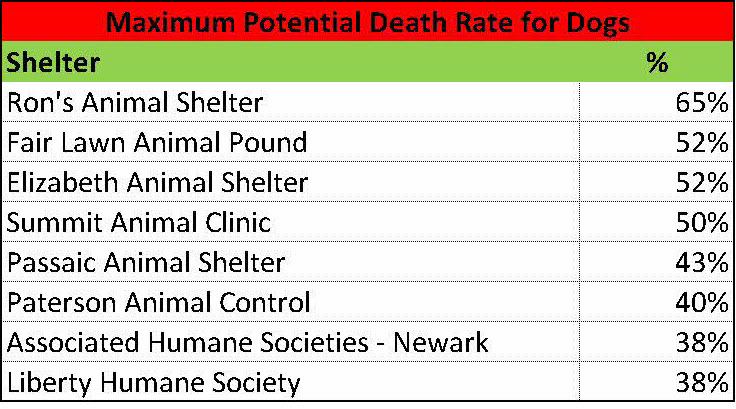
The table below details the local death rates for dogs from my last blog. Consistent with the Life Saving Model’s assumptions, the actual dogs euthanized/killed/died/missing assumes these dogs came from the local community. All dogs missing are assumed “dead” based on the assumption they died or went to a very bad place. Shelters having local dog death rates less than and greater than 5% are highlighted in green and red in the table below.
Surprisingly, several rescue oriented shelters had very high local dog death rates. While this number may be higher if some rescued dogs are euthanized/killed (i.e. targeted number assumes no rescued dogs are killed/euthanized) or many terminally ill dogs are surrendered for owner-requested euthanasia, this may possibly point to overly strict temperament testing at these facilities. In the case of St. Hubert’s-Madison, which has a total dog death rate of 11% (i.e. percentage of all dogs taken in and not just community dogs), the total death rate may be artificially depressed by easy to adopt transported dogs. For the Humane Society of Atlantic County, which has no animal control contracts, the total dog death rate of 22% is shockingly high for a rescue oriented shelter and raises serious questions about how life and death decisions are made by this organization. The local death rates at other rescue oriented shelters, such as Ramapo-Bergen Animal Refuge and Common Sense for Animals (local death rates of 2% and 3%) are much lower than St. Hubert’s-Madison and the Humane Society of Atlantic County (local death rates of 23% and 69%).
Thus, I find it difficult to believe St. Hubert’s-Madison’s and Humane Society of Atlantic County’s larger than expected local death rate is due to them rescuing a large percentage of their dogs from other shelters.
The largest number of dogs unnecessarily dying occurred at a relatively small number of shelters. Specifically, 12 out of 96 or 13% of the shelters accounted for 80% of the 3,364 unnecessary dogs unnecessarily losing their lives. Shelters with the greatest number of unnecessary dog deaths are as follows:
- Associated Humane Societies – Newark (693)
- Gloucester County Animal Shelter (306)
- Trenton Animal Shelter (247)
- Cumberland County SPCA (211)
Thus, the bulk of the dogs unnecessarily dying at New Jersey animals shelters occurs at a few facilities.


Most New Jersey Animal Shelters Require Little Rescue Assistance
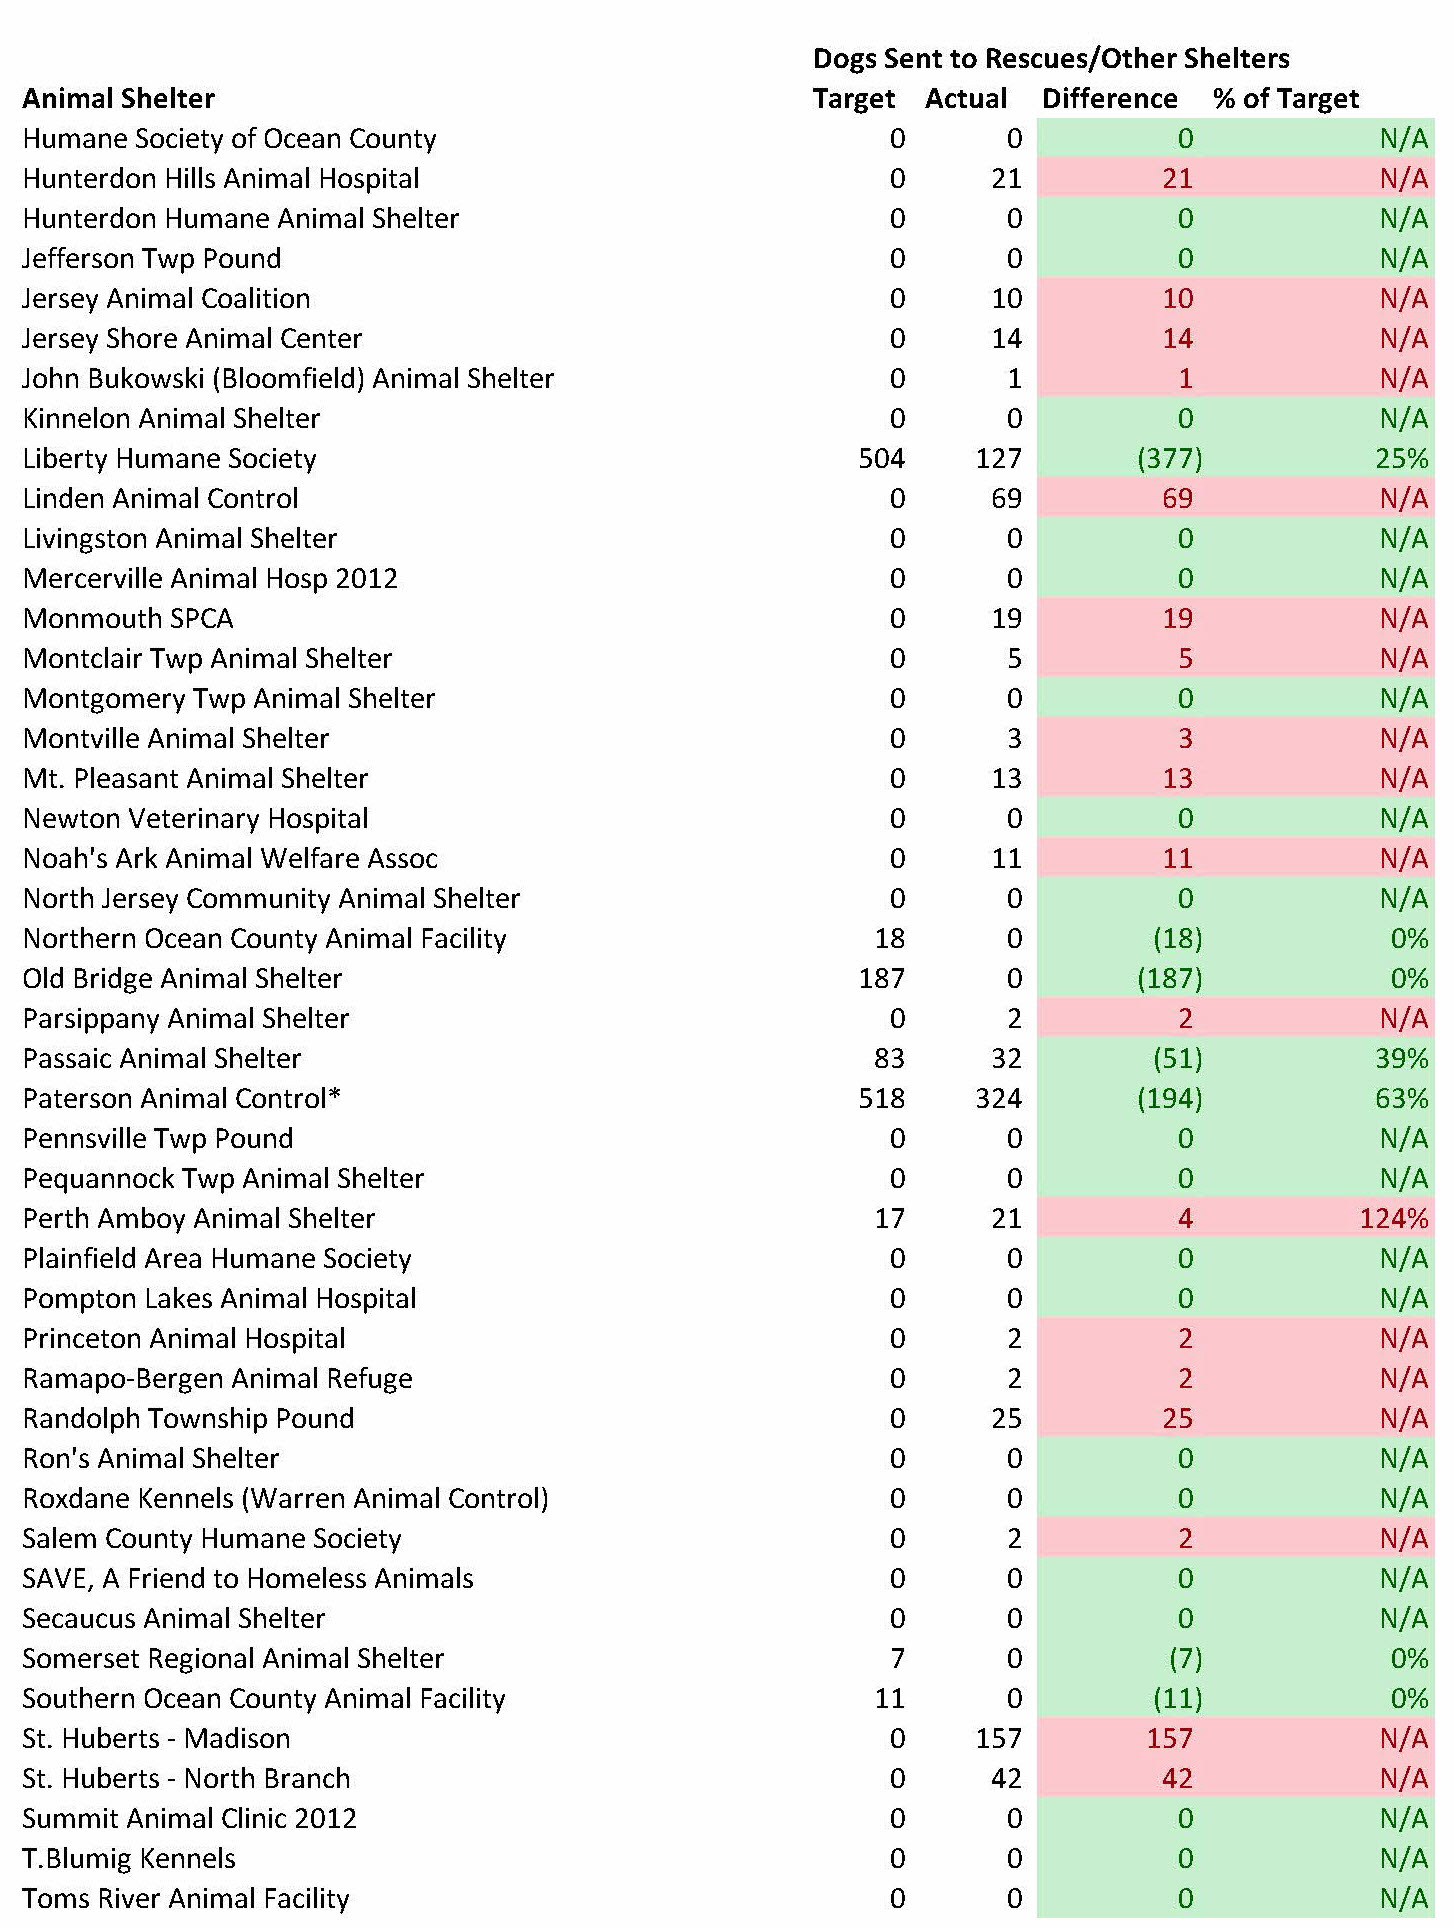
Some animal shelters will require more support from rescues and animal shelters with excess space than others. If a shelter has relatively high intake, very limited space, and few stray dogs returned to owners, it will need more help than other shelters. The table below compares the number of dogs a shelter should transfer to other organizations per the model and the number of dogs actually sent to other animal welfare groups. Shelters marked in green are receiving less than the expected rescue support while facilities marked in red are receiving too much rescue help.
Overall, most New Jersey animal shelters require little rescue support if space-constrained facilities fast-track their most highly adoptable dogs. Shelter medicine experts advocate prioritizing the processing of highly adoptable animals to make the best use of space and reduce disease. For example, making sure these animals are the first to get spayed/neutered and vaccinated and receive microchips to ensure they can leave as soon as the shelter finds a good home.
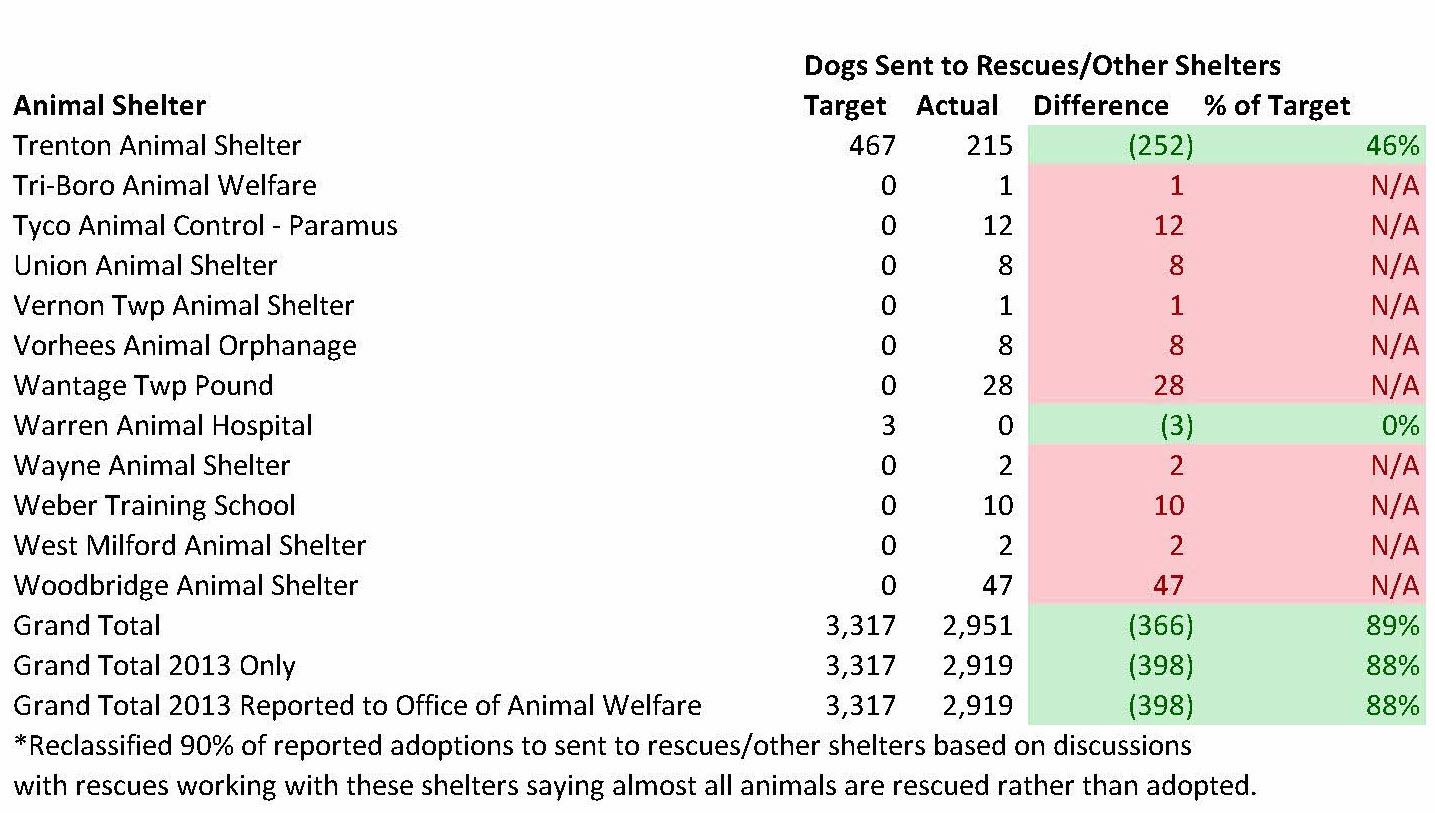
Some New Jersey shelters are not receiving enough help from other animal welfare organizations. While the overall number of dogs rescued from all of the state’s shelters was more than needed, the actual number of dogs needing rescue was higher since many dogs were rescued from facilities who did not need any rescue assistance. Only 14 out of the 96 facilities require any rescue support. In other words, 82 of the 96 animal shelters in the state should not need rescues or other shelters to pull any dogs. As a result, 203 dogs were not rescued from shelters who truly need that support and instead were pulled from shelters not requiring this help.
Associated Humane Societies-Newark hogged up the most rescue support. Specifically, rescues and other shelters pulled 965 more dogs than needed from AHS-Newark. Even worse, AHS-Tinton Falls and AHS-Popcorn Park rescued far fewer dogs than they should. As a result of this poor performance, AHS diverted much needed rescue assistance from more needy shelters.
On the other hand, many space constrained shelters received far less rescue help than needed. Facilities who received the lowest amount of rescue support in relation to their needs were as follows:
- Hamilton Township Animal Shelter – 114 fewer dogs transferred than necessary
- Trenton Animal Shelter – 64 fewer dogs transferred than necessary
Rescue groups and shelters with extra space should pull dogs from kill shelters with the highest rescue “target” numbers and deficits in the tables below. If shelters not needing rescue support get that extra help, these shelters will not take the steps necessary to properly run their facilities. As a result of enabling poorly performing shelters and not pulling dogs from truly space constrained facilities, rescuing dogs from shelters with enough space leads to less lifesaving.
Shelters receiving less than needed rescue support should also examine their own policies and performance. Are the shelter’s operating processes allowing too many animals to get sick and therefore discouraging organizations to rescue their animals due to subsequent medical costs? Does the shelter actively reach out to rescues/other shelters and treat them with respect? Does the shelter make it convenient for other organizations to pull their animals?
Given killing animals for space is intolerable, the space-constrained shelters need to expand their effective dog capacity. These facilities could use extra space in their buildings to house dogs on a short-term basis. These shelters can enter into arrangements with local veterinarians to house and adopt out some dogs. Furthermore, shelters can create or expand foster programs to increase the number of dogs cared for. Additionally, creating a pet owner surrender prevention program and making serious efforts to return lost dogs to owners could free up space in these shelters. Finally, space-constrained shelters with multiple animal control contracts should terminate some of these arrangements to bring their capacity for care in line with the number of dogs they take in. As a result, space constrained shelters still need to take active steps to reduce killing rather than simply solely relying on rescue support.


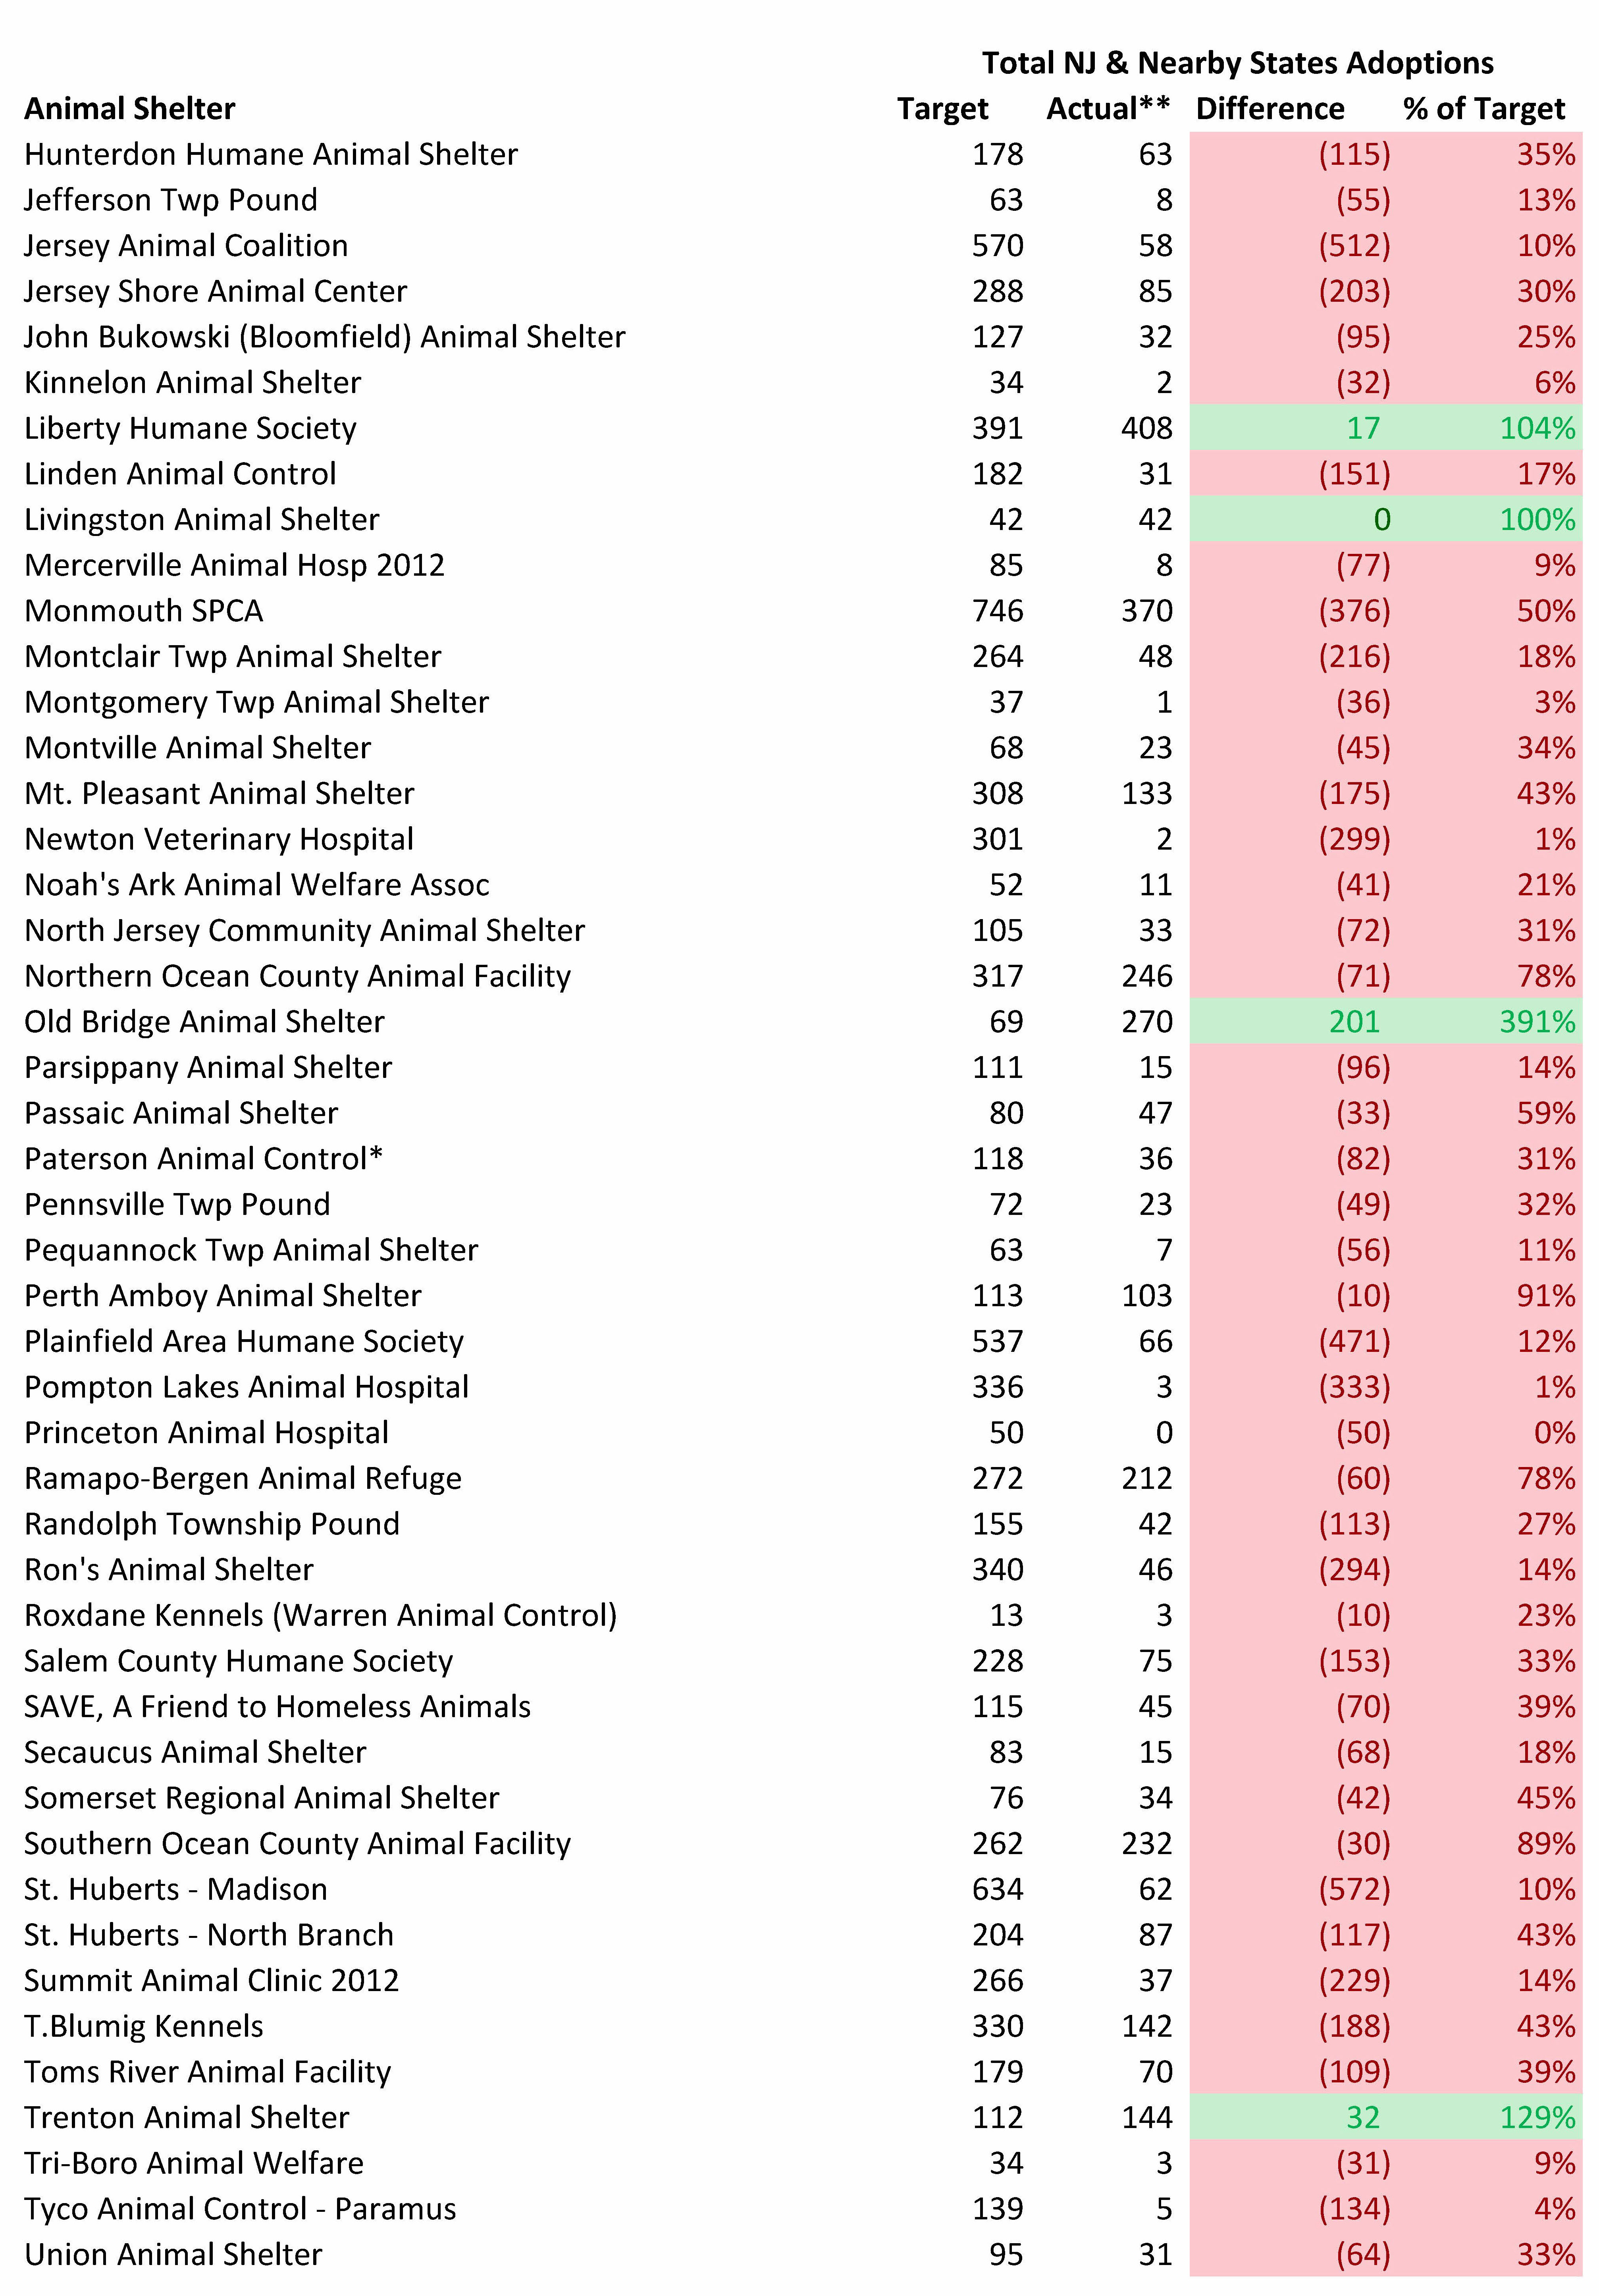
Most New Jersey Animal Shelters Fail to Come Close to Reaching Their Local Dog Adoption Potential
We can assess each shelter’s contribution to making New Jersey and nearby areas no kill. While a shelter may be able to avoid killing healthy and treatable animals, it still may not live up to its potential for adopting out local dogs. On the other hand, a space constrained shelter may kill healthy and treatable dogs, but still do a good job adopting animals out.
The tables below compare the number of dogs from New Jersey and nearby states each animal shelter should adopt out with the estimated number of local dogs actually adopted out.
Many rescue oriented shelters likely pull much easier to adopt dogs than the bulk of dogs needing to get rescued from local facilities. Thus, the results from rescue oriented shelters may look better than they actually are.
Few organizations reached or exceeded their adoption targets. Specifically, only 5 out of 96 shelters met the adoptions goals computed by the Life Saving Model. 1 of the 5 facilities reaching the adoption targets (Denville Township Animal Shelter) had space to only place a small number of animals. Thus, the overwhelming number of New Jersey animal shelters need to step up their adoption efforts.
Several shelters exceeded or came close to achieving their adoption targets. Beacon Animal Rescue and Ramapo-Bergen Animal Refuge adopted out more animals than I targeted. While these organizations are both rescue-oriented shelters that appear to pull fewer pit bulls than I target, these two shelters do at least have a reasonable number of pit bull like dogs up for adoption. Additionally, these shelters rescue animals primarily from other New Jersey animal shelters rather than transport large numbers of dogs from the south. While Animal Alliance and Country Lakes Animal Clinic exceeded their adoption targets, this result is due to these shelters pulling easier to adopt dogs (i.e. few pit bull like dogs) from other shelters. Large animal control shelters coming closest to reaching their adoption targets include St. Hubert’s-North Branch (88% of target) and Burlington County Animal Shelter (75% of target). Unfortunately, I have doubts about the accuracy of the adoption totals of some of the other large animal control shelters that came close to reaching their adoption targets.
Shelters adopting out the fewest animals in total relative to their targets were as follows:
- Associated Humane Societies-Newark – 1,827 fewer dogs adopted than targeted
- Associated Humane Societies-Popcorn Park – 830 fewer dogs adopted than targeted
- Associated Humane Societies-Tinton Falls – 706 fewer dogs adopted than targeted
- Bergen County Animal Shelter – 621 fewer dogs adopted than targeted
Unsurprisingly, Associated Humane Societies has archaic adoption policies that make it more difficult to adopt than the procedures recommended from national animal welfare organizations.
Shelters transporting dogs from out of state also significantly failed to achieve their adoption targets for New Jersey dogs. In fact, shelters rescuing dogs from out of state facilities have a New Jersey dog adoption shortfall exceeding half the number of New Jersey dogs unnecessarily dying in our state’s shelters. Not surprisingly many of these facilities’ total adoptions including transported dogs exceeded the local dog adoption targets as most transported dogs are easier to adopt. These transporting shelters’ local adoption performance is even worse considering most of these organizations likely take in much more adoptable local dogs than my model targets. In addition, the revenues these transporting shelters bring in from adoption fees and dramatic fundraising stories likely divert funding from New Jersey animal control shelters. Thus, it is quite clear most transporting shelters are not doing their part in helping New Jersey’s homeless dogs.


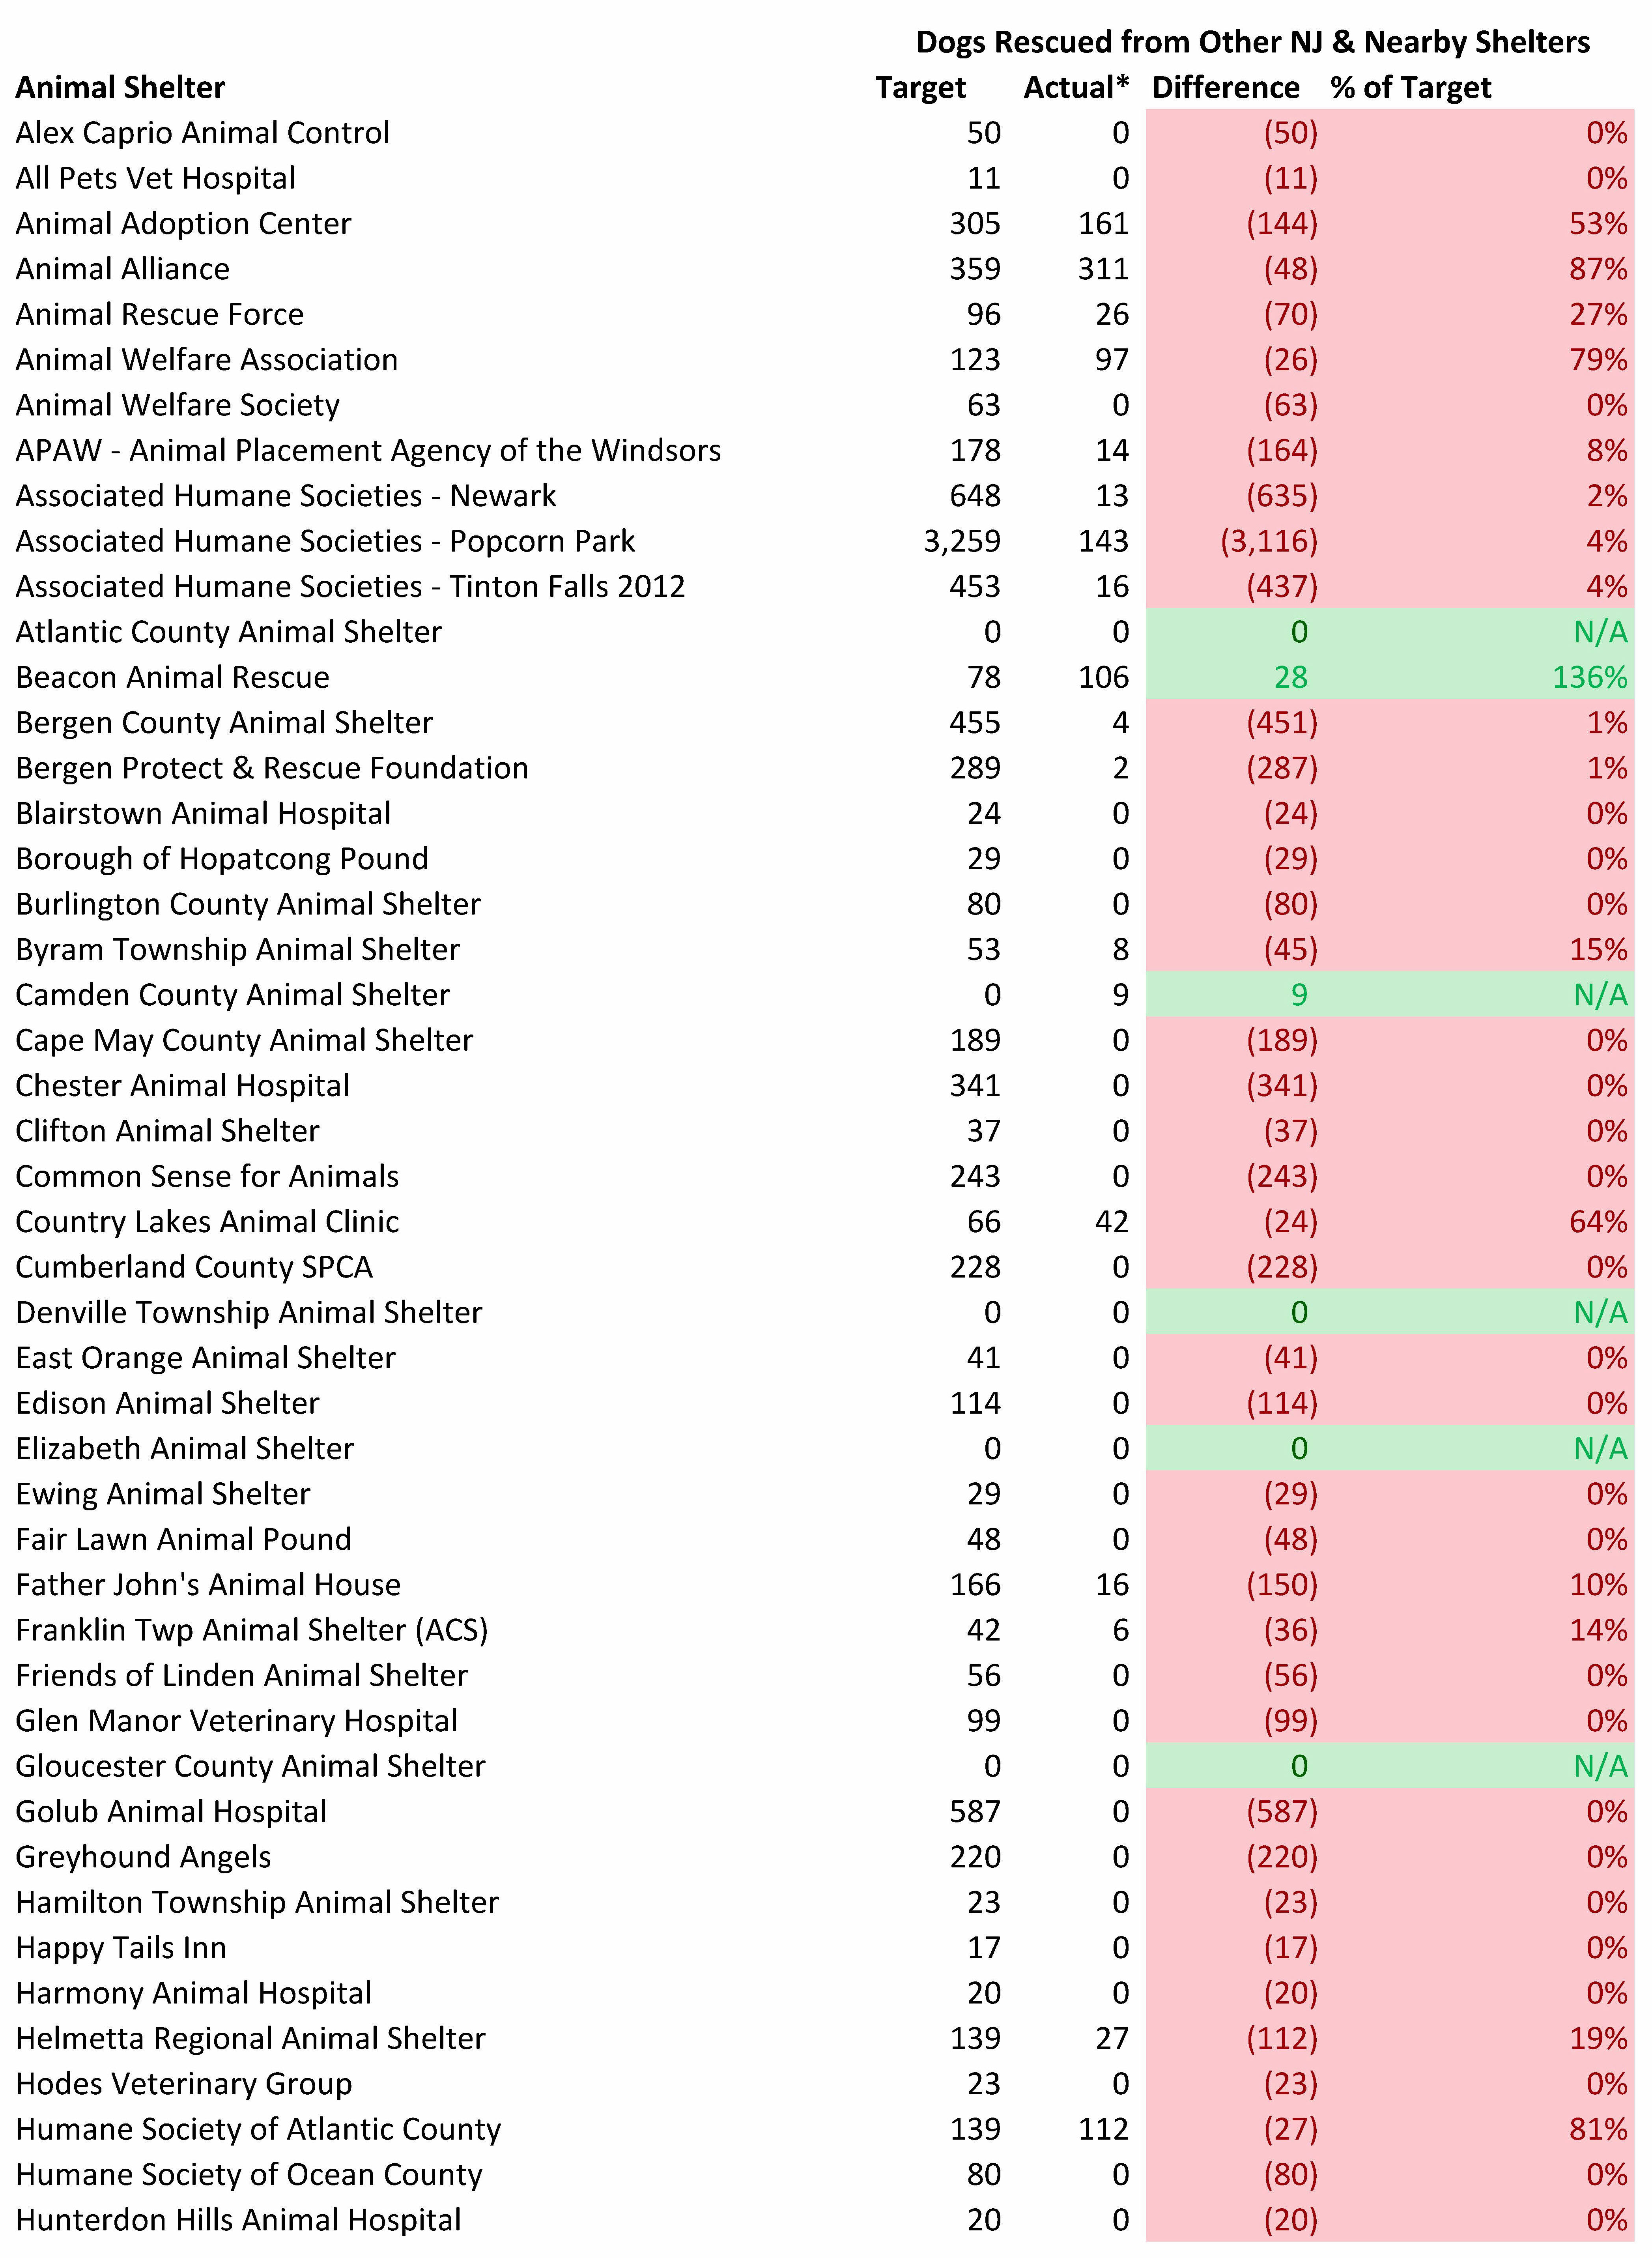
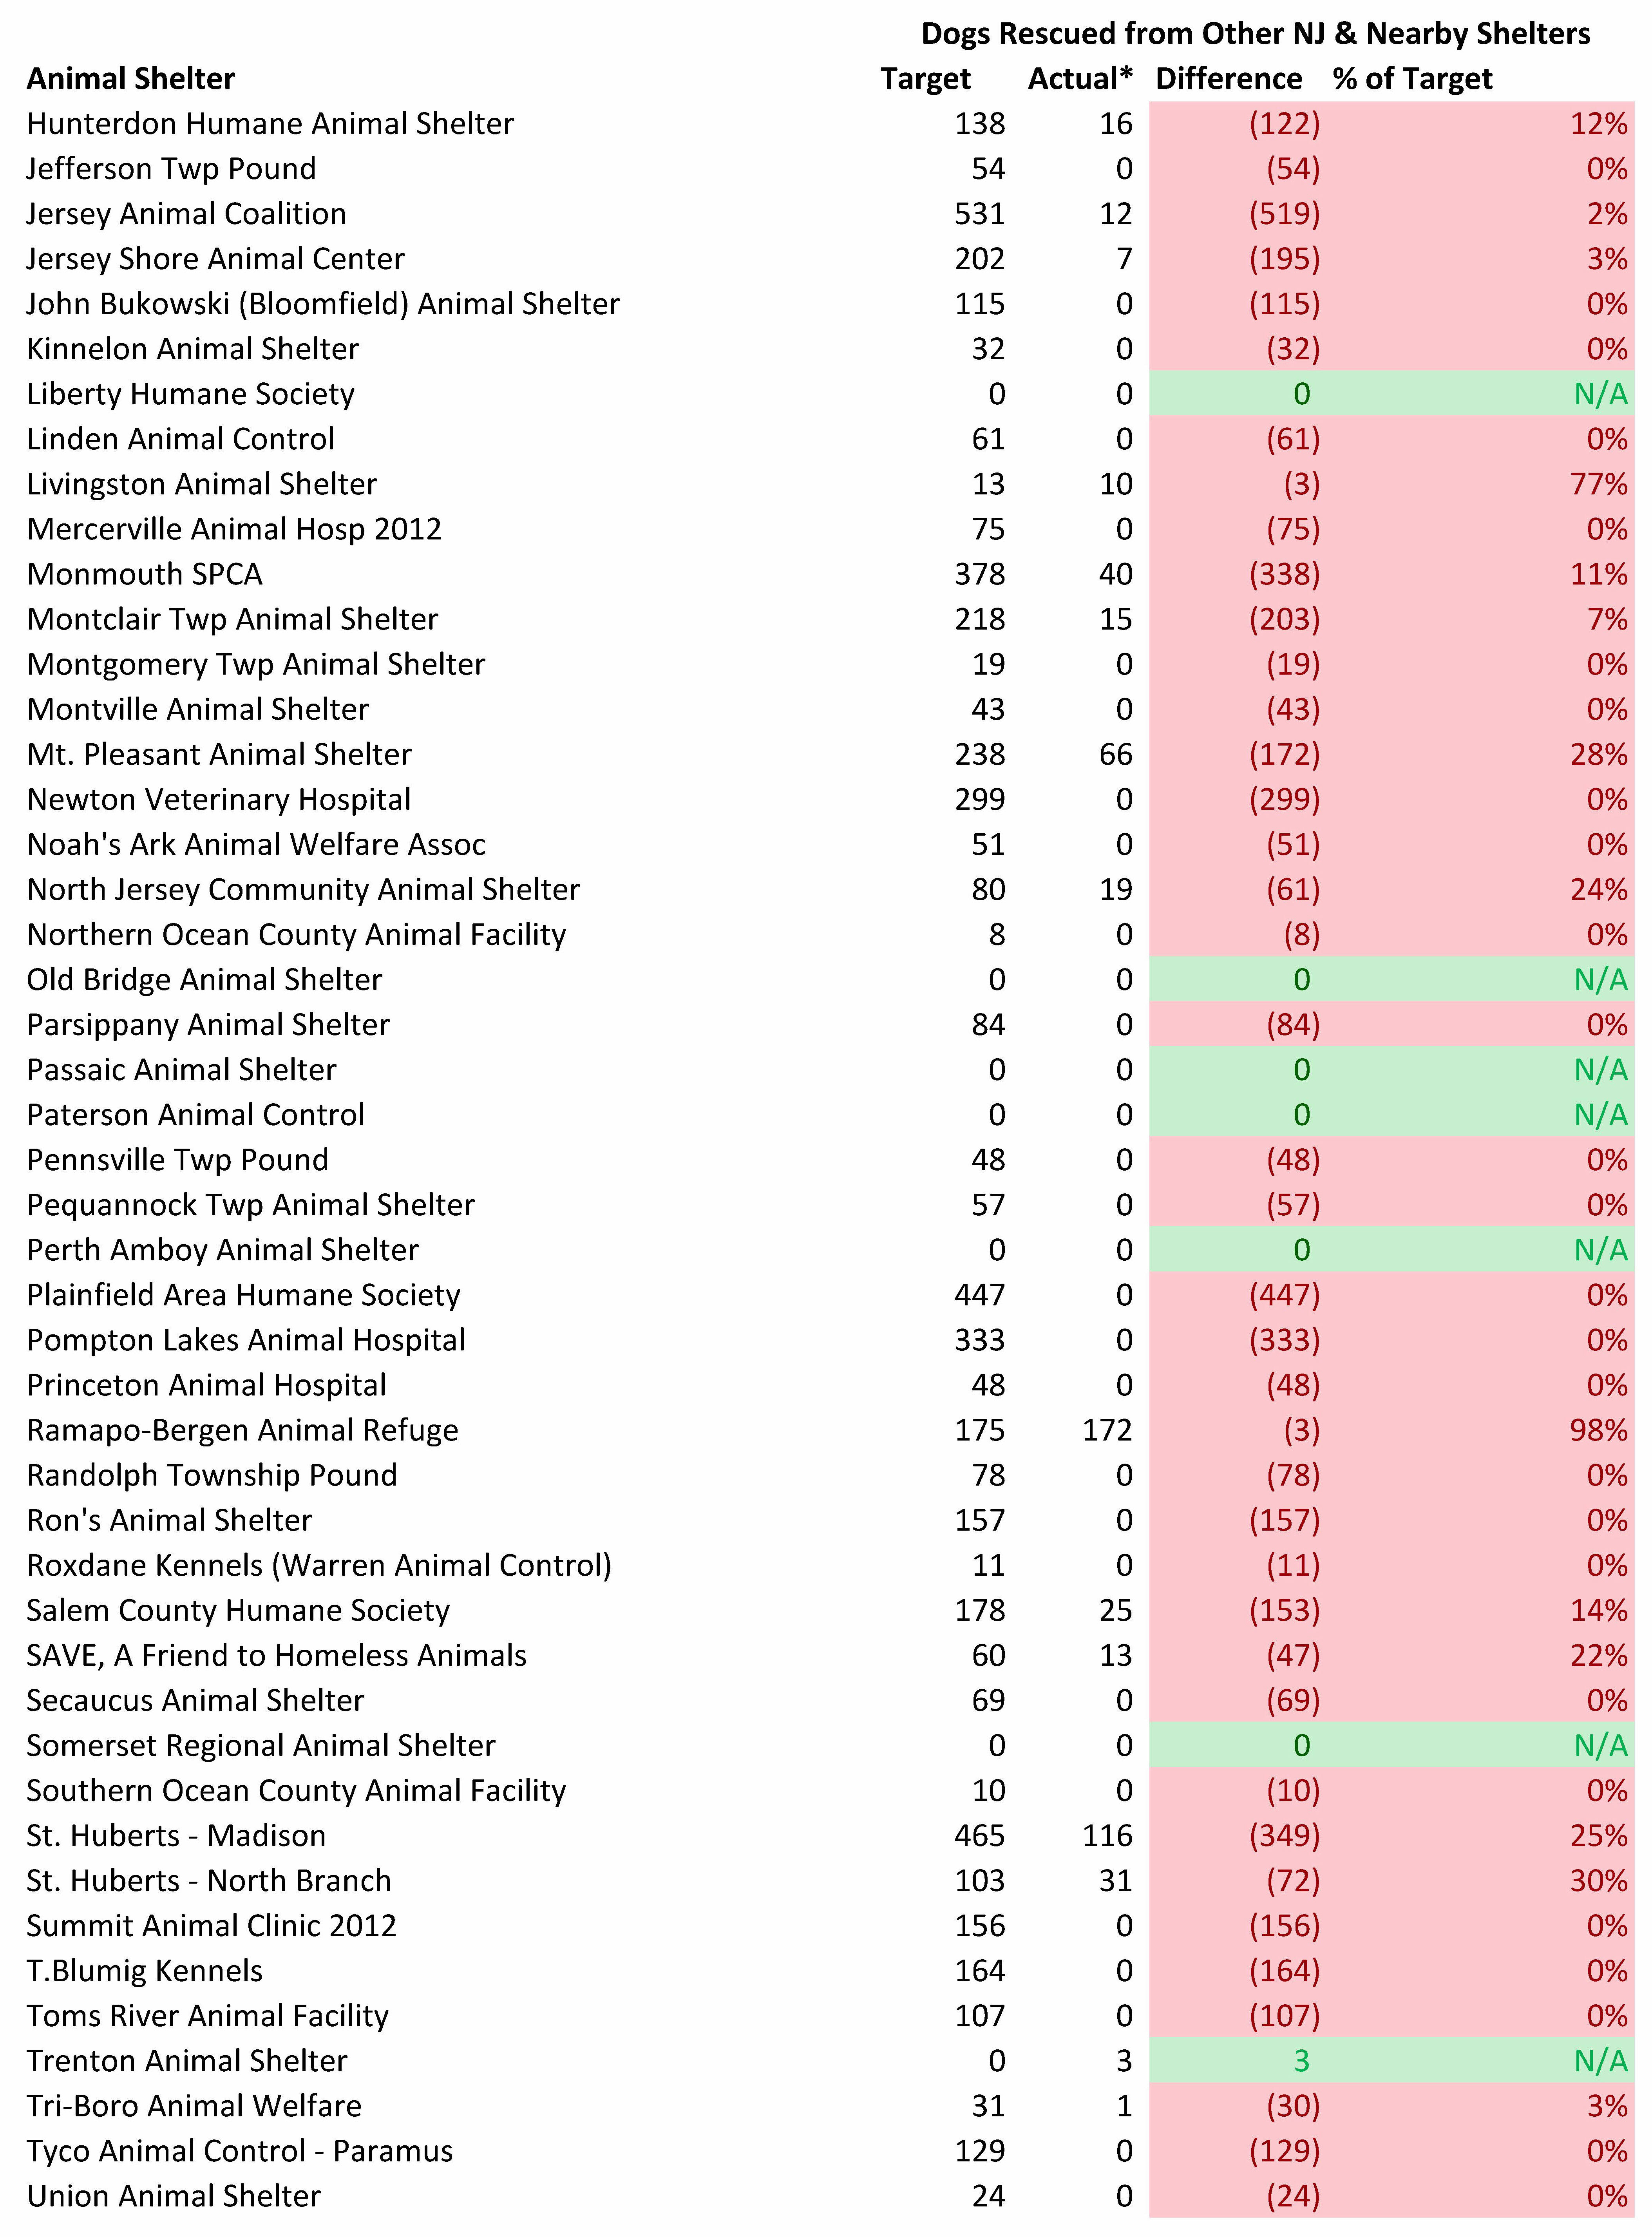
Shelters Fail to Use Excess Space to Save Local Dogs
To further examine New Jersey animal shelters’ performance in saving the state’s homeless dogs, I compared the targeted number of dogs each shelter should pull from nearby shelters and compared it to the number actually rescued from local facilities. I assume all reported out of state rescued dogs came from southern or other far away states (except for Animal Alliance due to the shelter stating it primarily pulls out of state dogs from Pennsylvania). While some of the out of state rescued dogs may have comes from nearby areas, I believe this is a small number and does not significantly impact the results.
Virtually all New Jersey animal shelters are failing to rescue the number of local dogs they should. 87 of the 96 shelters should rescue some dogs from other local shelters. In fact, 54 of the 87 shelters with targeted excess capacity failed to rescue even a single dog from a New Jersey animal shelter. Of the 87 shelters with the space to rescue dogs from nearby shelters, only Beacon Animal Rescue, Ramapo-Bergen Animal Refuge, Animal Welfare Association, Animal Alliance, County Lakes Animal Clinic, Pennsville Township Pound and Salem County Humane Society met or exceeded their local dog rescue targets. As mentioned above, scores for Animal Alliance, Country Lakes Animal Clinic and Animal Alliance are inflated due to these shelters cherry picking highly adoptable animals to rescue. Thus, nearly all New Jersey animal shelters with targeted excess capacity are failing to do their share in ending the killing of local healthy and treatable dogs.
Shelters can overcome challenges in rescuing dogs from outside their service area. In some cases, municipalities may frown on government run shelters using taxpayer funds to rescue dogs from elsewhere. However, shelter directors at these facilities can encourage individuals to form a non-profit or raise money on their own to pay for these rescued dogs. Additionally, shelters with limited capacity or even some of the well-off private shelters could contribute funding for each dog rescued. For example, Maddie’s Fund paid an approximate $160 subsidy to rescues pulling dogs from New York Animal Care & Control. Similarly, private shelters with excess space, but limited financial resources, could expand their fundraising efforts to save more local dogs. Thus, perceived obstacles to rescuing local dogs can and should be overcome.


New Jersey Animal Shelters Need to Form Life-Saving Coalitions
The improper allocation of space within the state’s animal shelter system requires organizations to form coalitions. While putting a competent and compassionate director in every shelter would likely be even more effective, that will likely take time to do. No kill coalitions between animal control facilities and selective admission shelters have been used in places, such as Portland, Oregon, Reno, Nevada, Jacksonville, Florida and Austin, Texas to radically increase life saving. Maddie’s Fund, which has supported using coalitions for over a decade, has many resources for organizations seeking to collaborate with each other. Thus, New Jersey animal shelters need to formally work together, develop quantifiable and measurable goals (such as the targeted outcomes in this blog), and hold each organization accountable for meeting these benchmarks.
Sobering Results Require Shelter Leaders to Critically Examine Themselves
Shelters should examine the reasons why their adoption numbers fall far short of these benchmarks. In some cases, shelters, such as Woodbridge Animal Shelter, need to expand the hours they are open for adoptions. Many shelters should switch from an overly judgmental adoption process based on black and white rules to a conversational one focused on educating the adopter. Organizations will need to radically increase their off-site events and do same day adoptions. Similarly, many shelters must reduce adoption fees and run frequent promotions. Executive Directors should monitor the latest life-saving programs on Maddie’s Fund’s, ASPCA Pro’s, and the Best Friends National Conference’s web sites and put some of these policies into place. Shelter management teams will need to ensure their facilities are clean and customers are treated with respect (this can be measured by encouraging the public to complete surveys). Thus, poorly performing shelters need to stop making excuses and do what it takes to reach their adoption potential.
We can turn New Jersey, New York City and Philadelphia into no kill communities. It is time we give our money and volunteer efforts to organizations who raise their performance to help us reach that goal. To do otherwise, would betray all the animals whose lives are on the line.
Appendix I – Animal Shelter Report Cards Without Adoption and Rescue Caps
Below are the shelter report cards’ targets using the model without caps for adopted and rescued animals. New Jersey shelters could adopt out nearly 7,000 or around 30% more dogs if I did not place a cap on dog adoption in certain counties. Overall, the unmodified model yields pit bull and dog per capita adoption rates of 3.5 dogs per 1,000 people and 2.1 pit bulls per 1,000 people in New Jersey. As a comparison, several animal control shelters per capita dog adoption rates are 2-3 times higher than this target and Longmont Humane Society’s per capita pit bull adoption rate is equal to this benchmark.
The dog adoption tables below compare the results using the modified and unmodified models for each shelter. Overall, the targeted numbers of dogs rescued and adopted were capped in Camden County, Cape May County, Essex County, Hunterdon County, Morris County, Ocean County, Salem County, Sussex County and Warren County. In other words, the targeted numbers of dogs rescued and adopted were capped in 9 of the 21 New Jersey counties.


Appendix II – Life Saving Model Assumptions
The Life Saving Model utilizes the following basic animal shelter population equations to calculate the targeted dog outcomes for each facility:
Daily capacity or population = Daily animal intake x average length of stay
Average length of stay = Daily capacity or population/daily intake
Each shelter’s community dog intake (i.e. owner surrenders, strays, cruelty bite cases), number of dogs returned to owners, and maximum dog capacity were taken from its 2014 “Shelter/Pound Annual Report” submitted to the Office of Animal Welfare. Unfortunately, all the 2015 data will not be available until the end of August in 2016.
This data was then used as follows:
- Community dog intake and dogs returned to owners were initially estimated for each month by dividing the annual figures by 12. In order to take into account the extra space in low intake months and reduced space in high intake months, we multiply that number by each month’s percentage of the average month. For example, assume 240 dogs were taken in during the year and the average month equals 20 dogs (240/12). In July, the dog intake is 120% higher than the average month and we therefore multiply 20 dogs by 1.2 to equal 24 dogs. If 120 dogs were returned to owners during the year, the estimated number of dogs returned to owners in July would equal 12 dogs (120/12 = 10; 10*1.2). The monthly intake percentages were based off 2014 dog intake data on the New York Animal Care & Control web site.
- The estimated number of community dogs returned to owners each month are then assumed to stay 5 days on average at shelters based on data from other shelters across the country. If anything, this estimate is conservative (i.e. average length of stay for dogs returned to owners may be less than 5 days and therefore frees up more shelter space for adoptions) based on some shelters returning the bulk of their dogs to owners within 3 days.
- The number of community dogs euthanized (including animals who died or are missing) is set to equal 5% of intake. 5% is a reasonable standard euthanasia rate for shelters in New Jersey to meet given few vulnerable stray puppies (i.e. who could die or require euthanasia) arrive in the state’s animal shelters. The average length of stay for euthanized dogs is assumed to equal 14.5 days. Half of dogs are assumed euthanized for untreatable aggression towards people and 21 days is the time estimated to make that determination. The other half of dogs are assumed euthanized for severe and untreatable health issues and I estimate these dogs are euthanized after 8 days (subsequent to the end of the stray and owner surrender hold periods).
- Adopted dogs are assumed to stay at shelters for varying lengths of time. Adoption length of stay was based on data from a study in the Journal of Applied Animal Welfare and the figures used (except for space-constrained shelters) are located in a prior blog on pit bull adoption. The data primarily comes from Tompkins County SPCA during a time it saved over 90% of its dogs. This was a fairly conservative data set to use as other no kill open admission shelters’ average length of stay are substantially shorter. Specifically, the following assumptions were made:
- 80% and 20% of each communities dogs (including pit bulls) were adults 1 year and older and under 1 year.
- Pit bulls were assumed to comprise 50%, 35% and 25% of community dog intake at poor, middle/upper middle class, and wealthy area animal control shelters. While some shelters may have pit bulls comprising more than 50% of their shelter dog population at a given time, this is due to pit bulls longer average length of stay. For example, a shelter with pit bulls making up 50% of their dog intake and pit bulls having an average length of stay three times longer than other dogs will have pit bulls constituting 75% of the dog population. Shelters without animal control contracts were assumed to only have pit bulls make up 10% of their community dogs (i.e. strays and owner surrenders) based on most of these shelters’ highly selective admission practices.
- Pit bull length of stay was taken directly from the Journal of Applied Animal Welfare study. The average lengths of stay for other breeds from this study were averaged and used for dogs other than pit bulls in the analysis
- Space constrained shelters were assumed to adopt out their easiest to adopt animals first until they ran out of space. To estimate the average adoption length of stay, I used pit bull adoption length of stay data from Greenhill Humane Society from March 2013 through May 2014. I broke the adoption length of stay data into 5 groups that each made up 20% of the data. The average adoption length of stay for each of these 5 groups was calculated. The average adoption length of stay of each group was divided by the average length of stay for all of the adopted pit bulls in the Greenhill Humane Society data set. Those percentages were then multiplied by the average dog adoption length of stay determined in the previous bullet and used to determine the adoption lengths of stay used for space-constrained shelters.
- Dogs transferred to rescue or other facilities are assumed to stay at shelters 8 days on average based on the assumption strays can’t be released until the 7 day hold period elapses.
- Community dogs not returned to owners or euthanized are initially assumed as adopted for each month. However, if the calculated length of stay exceeds the shelter’s required length of stay, dogs are moved from adoption (i.e. with a longer length of stay) to rescue (i.e. shorter length of stay) until the calculated length of stay each month approximately equals the required length of stay.
- Required length of stay = Shelter’s reported capacity/adjusted daily intake for the month. Adjusted daily intake for month = Adjusted monthly intake per first bullet above/the number of days in the month.
- Shelters with excess capacity are assumed to use the extra space to rescue and adopt out dogs from other New Jersey animal shelters. To the extent all healthy and treatable New Jersey animal shelter dogs are saved, I assume additional dogs are pulled from nearby states with similar types of dogs. I assume all rescued dogs will not be killed since the transferring and receiving shelters should evaluate these dogs’ behavior. Based on pit bull type dogs having longer lengths of stay at shelters, I assume 80% of dogs rescued from local animal shelters are pit bulls and 20% are non-pit bulls. 80% and 20% of pit bull and non-pit bull type dogs are considered 1 year and older and under 1 year. The average length of stay for rescued pit bulls and other dogs are the same as above.
- Each month’s targeted outcomes are added to determine how many local dogs New Jersey animal shelters should adopt out, send to rescue, rescue from other nearby animal shelters and euthanize.
- The targeted number of dogs rescued and adopted were capped at 2 pit bulls per 1,000 people in each county. If the model yielded a higher result than this cap, the targeted numbers of dogs rescued and adopted were equal to this cap using the pit bull percentage assumptions above. For shelters in these counties, I calculated the cap at the county level and then reduced the number of dogs rescued and adopted for the county to equal the cap. Each shelter’s percentage of total targeted rescues in the county from the unmodified model were applied to the the total reduction in the number of rescues in the county to yield the targeted numbers of dogs rescued and adopted in the modified model.


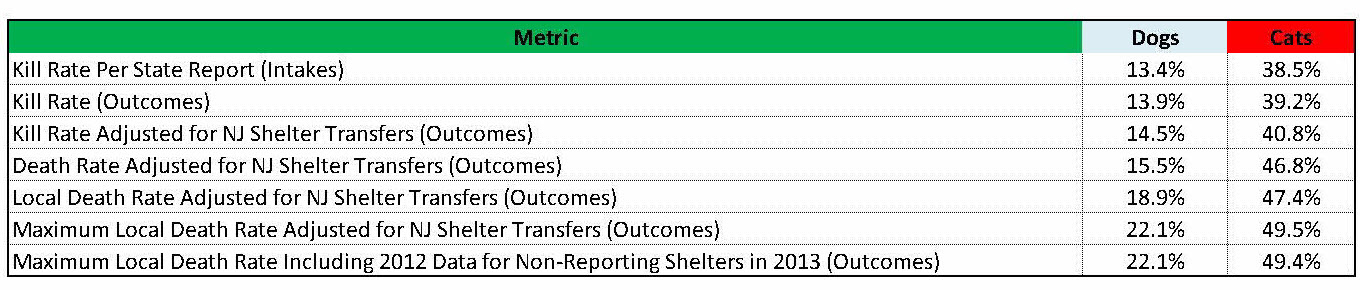
 The Animal Intake and Disposition report prepared by the New Jersey Department of Health only allows one to calculate the number of animals killed as a percentage of total animals impounded or intake. I prefer calculating the kill rate as a percentage of outcomes rather than intake as this metric directly compares positive and negative outcomes. Using intake depresses the kill rate since shelters can simply hold animals for a long time to the point of overcrowding. Calculating kill rate based on outcomes rather than intake increases the cat kill rate from 34.6% to 35.2% and the dog kill rate remains the same.


