Associated Humane Societies-Newark Violates State Law and the New Jersey and Newark Health Departments Look the Other Way

Newark has long had severe problems with Associated Humane Societies-Newark. Over 50 years ago, the modern form of AHS-Newark began with a corrupt contract that a court threw out and resulted in AHS long-time Executive Director, Lee Bernstein, being sentenced to jail. In 2003, the New Jersey Commission of Investigation issued a scathing report on AHS that found the organization raising massive amounts of money and failing to properly care for their animals. Over the years, state health department inspectors uncovered horrific problems and former Mayor Cory Booker tried to build a new no kill shelter to replace AHS-Newark. I published blogs about how the shelter killed massive numbers of Newark animals and broke state law left and right.

The New Jersey Department of Health found horrific problems at AHS-Newark in 2017. You can read the August 22, 2017 inspection here, the September 26, 2017 inspection here and the October 20, 2017 inspection report here. Overall, the problems were so severe that authorities charged former Executive Director, Roseann Trezza, with animal cruelty. Ultimately, the prosecutor and Roseann Trezza entered into an agreement in May 2018 to supposedly bar Ms. Trezza from the Newark shelter for two years and make her pay a $3,500 fine in exchange for dismissing the charges.

After the October 20, 2017 New Jersey Department of Health inspection, the state health department stopped inspecting AHS-Newark. As I documented at that time, the City of Newark and its health department inadequately inspected the shelter for years and tried to sweep the problems under the rug. In fact, the Newark Department of Health and Community Wellness reported few to no issues around the same times the state health department found massive problems in the past and in 2017.

The Department of Health and Community Wellness official overseeing the AHS-Newark inspection process uncovered the City of Newark’s intentions in 2017. Specifically, Michael Wlison, City of Newark Manager of Environmental Health, stated a “feasibility study” found it was cheaper for the City of Newark to contract with AHS-Newark than to build and operate their own shelter. Additionally, Michael Wilson mentioned unnamed “political issues” in what seemed as a justification to keep contracting with AHS-Newark.

Ultimately, the City of Newark did not pursue operating its own shelter. After Newark and AHS-Newark had a significant contract dispute in March 2018, AHS-Newark stopped providing any services during a second dispute in November 2018. Subsequently, AHS-Newark contracted with St. Hubert’s for around six months. St. Hubert’s terminated its arrangement with Newark citing “financial hardship” in April 2019 and the City of Newark contracted again with AHS-Newark at around a 50% higher monthly cost than its previous arrangement with the shelter.

Has AHS-Newark improved since this time? Is the New Jersey Department of Health and Newark Department of Health and Community Wellness ensuring AHS-Newark follows state law and treats animals properly?

Data Reviewed

To get a better understanding of the job the Newark Department of Health and Community Wellness did at inspecting AHS-Newark, I submitted an Open Public Records Request for all AHS-Newark inspection reports conducted from January 1, 2019 until early September 2020. The City of Newark sent me a number of inspection reports, emails and AHS-Newark records. You can see all the records at this link.

Overall, the inspection reports were of poor quality. Specifically, the inspectors frequently reacted to complaints and did not proactively inspect the shelter for other problems. Additionally, the inspectors did not even take the time to type out their findings. Instead, they appeared to just quickly write down a few notes that were often difficult to read. Additionally, it was often impossible to determine which set of inspection report notes related to which specific inspection. Thus, the Newark Department of Health and Community Wellness continued to do a poor job at inspecting AHS-Newark.

City of Newark’s Poor Quality Inspections Still Find Problems in 2019

Michael Wilson inspected AHS-Newark on April 15, 2019 and gave the shelter a Conditional A grade. As you can see, the inspection only took a mere one hour and 15 minutes and noted an isolation room violation. Unfortunately, I could not find any accompanying notes detailing the nature of the violations.

While I could not determine if the inspection notes below were from the April 15, 2019 inspection, they did lay out some serious issues. AHS-Newark again had food debris, which can lead to rodent infestations, a broken baseboard, an unsanitary isolation room in the shelter’s infamous basement, had a dirty area with dead animals and also failed to finish the required painting in the facility. Thus, even the inept Newark Department of Health and Community Wellness found serious problems.

Miraculously, Michael Wilson came back to the shelter eight days later and gave the shelter a “Satisfactory” grade with no comments in the inspection report provided to me.

Newark Health Department Finds Massive Problems in 2020

After receiving a complaint on January 6, 2020, Michael Wilson inspected the shelter three days later. The complaint alleged the shelter had a foul odor, unsanitary conditions and cats having upper respiratory infections. During the inspection, the Newark Department of Health and Community Wellness found the shelter had a “strong animal odor”, all the main dog kennels required painting/stripping and pigeons inside the facility. Mr. Wilson ordered the shelter to separate dogs and cats to reduce stress (i.e. cats are a prey to dogs and cats understandably are scared in such an environment) and get more volunteers to provide mental stimulation to the animals.

In February 2020, the New Jersey Department of Health received multiple complaints about a serious disease in a dog that died at AHS-Newark and the shelter imposing a quarantine in part of the facility. Instead of inspecting AHS-Newark, the New Jersey Department of Health inspector, Linda Frese, told the Newark Department of Health and Community Wellness to investigate and ensure there was no outbreak at the shelter and in the community.

Once again, Michael Wilson conducted a reactionary and low quality inspection on February 19, 2020. In the report, Mr. Wilson noted AHS-Newark had 284 dogs and 359 cats at the facility. This was a dramatic increase from the 117 dogs and 49 cats the shelter had in the April 15, 2019 inspection report. Therefore, the risk of a disease outbreak was much greater. Despite this, the inspector only noted a fire inspection violation. Mr. Wilson did not even provide an inspection grade nor write down when he completed the inspection to let us know how long this inspection was.

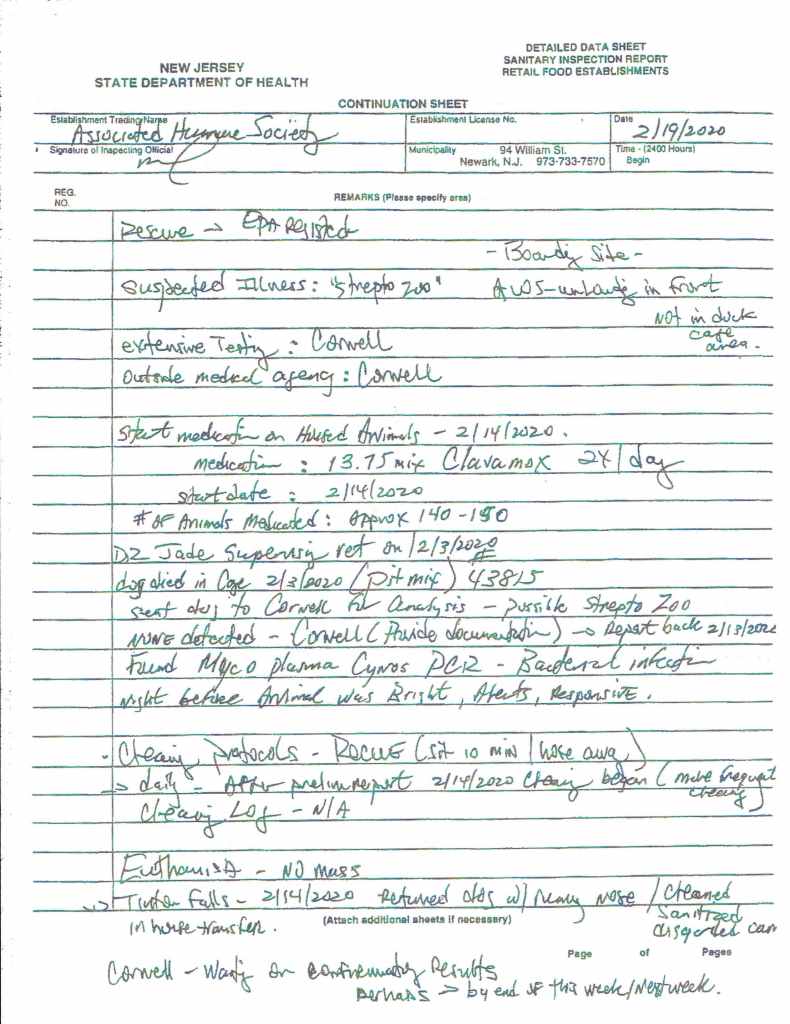
The inspection report comments raise serious question about the job Michael Wilson did. Mr. Wilson obtained an “Interim Report” from Cornell University that showed the deceased dog had a “Moderate Positive” result for Coronavirus PCR and “High Positive PCR, Beta” for Mycoplasma cynos. The report stated these were preliminary results and additional testing was in progress. While Michael Wilson’s inspection report comments stated he was waiting for final results, the City of Newark did not provide them to me. Thus, the Newark Department of Health and Community Wellness did not appear to obtain the final report.

The inspection report comments also showed no proactive efforts in this inspection. Basically, Mr. Wilson reiterated the Cornell University preliminary report’s findings. Additionally, he wrote some quick notes about cleaning protocols, but they seemed more like what the shelter told him rather than him actually observing the staff. For example, the report states the shelter cleaned daily, but then cleaned more after receiving the preliminary report. However, Mr. Wilson could not obtain a cleaning log to verify that claim. Also, I also found it a bit unusual that the shelter stated it got a new supervising veterinarian on the very day this sick dog died in his cage. Thus, I did not get a warm fuzzy feeling after reading this shoddy inspection report.

Massive Problems Emerge Recently

The Newark Department of Health and Community Wellness inspected AHS-Newark after receiving a complaint about cats at the shelter on August 10, 2020. During this inspection, Michael Wilson, who apparently got a promotion to Chief REHS, assigned another person to inspect the shelter. Based on the inspector’s report and email to Michael Wilson, the inspector simply talked with Assistant Executive Director, Ken McKeel, and the shelter manager, reviewed “some med records” and hardly did anything else.

Despite this being an inadequate inspection, the report noted 60 under 8 week kittens died of Feline panleukopenia. According to the UC Davis Koret Shelter Medicine Program, Feline panleukopenia is a devastating disease that “causes vomiting, diarrhea, and can cause sudden death in cats”, is transmitted through cat feces or poop and can last in a shelter for months or even years without proper disinfection. The virus is transmitted primarily by the fecal-oral route (including through exposure to objects/clothing/hands contaminated with virus from feces). FPV is very durable and can persist in the environment for months or even years unless inactivated by an effective disinfectant. However, the UC Davis Koret Shelter Medicine Program also states its very preventable through common sense measures:

Although panleukopenia can be a scary and potentially devastating disease in a shelter, reliable vaccination on intake, effective routine cleaning with a parvocidal disinfectant, and housing that minimizes fomite transmission will greatly reduce the risk of spread. With new tools for diagnosis and risk assessment, even outbreaks can generally be managed without resorting to depopulation.

Even though AHS-Newark was clearly not following these disease prevention and control guidelines, the wonderful Newark Department of Health and Community Wellness inspector simply stated management was doing things to minimize this disease. The inspector made some general comments about vaccination protocols, cleaning and isolating animals. Nothing in the report indicates they observed the shelter doing these things, obtained the specific detailed protocols from the supervising veterinarian and observed all the shelter’s cats for signs of disease. However, the report noted AHS-Newark had over 400 cats (up from 49 cats and 284 cats from other inspections) and 589 other animals in the building. Based on AHS-Newark’s 2019 Shelter/Pound Annual Report, the shelter’s cat capacity is 300 cats and 275 dogs and other animals. In other words, the shelter exceeded its cat capacity by over 33% and its dog and other animal capacity by almost 100%. Thus, AHS-Newark was at high risk of disease outbreaks.

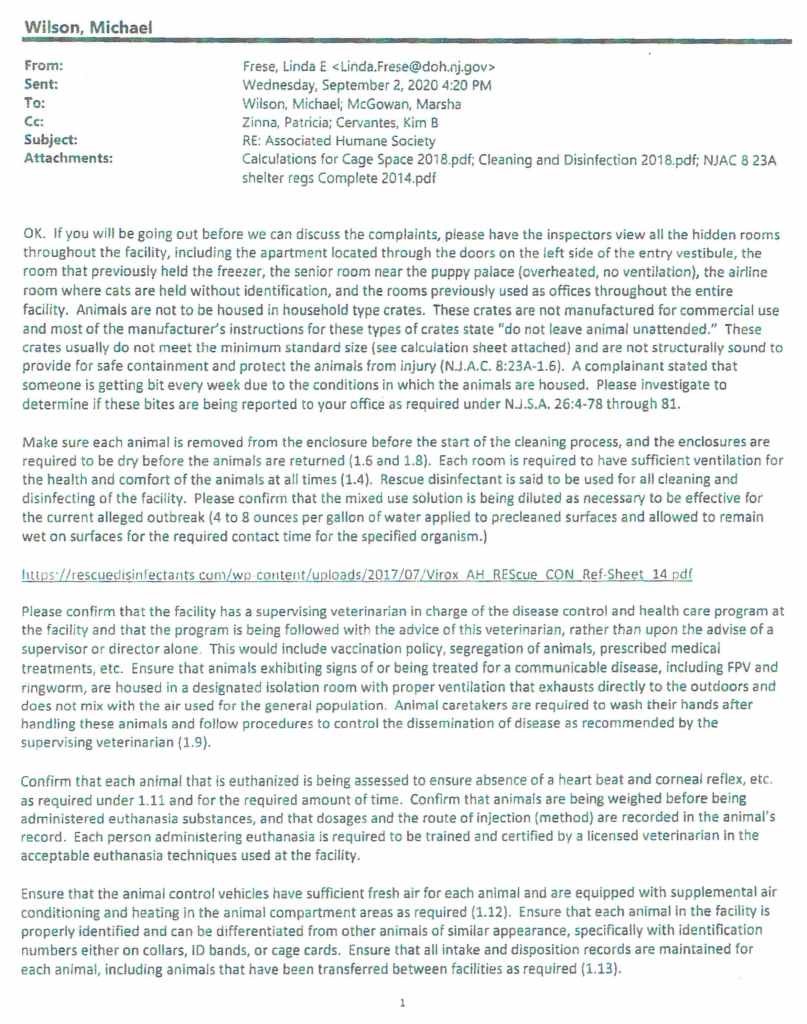
The Newark Department of Health and Community Wellness inspection did little to reduce AHS-Newark’s issues as complaints poured into the New Jersey Department of Health. In a September 2, 2020 email from New Jersey Department of Health inspector, Linda Frese, Ms. Frese stated the shelter received “a few extensive complaints regarding the current conditions at the Associated Humane Societies in Newark.” Specifically, Ms. Frese mentioned cats dying from Feline panleukopenia, animals not being properly identified, the shelter cleaning with animals in their cages that resulted in chemical burns, animals not receiving proper medical care and the shelter possibly not having a required supervising veterinarian. Additionally, AHS-Newark was alleged to not have air conditioning in its ACO vans that potentially caused a dog to die last August.

At the end of the email, Linda Frese requested they have a conference call to discuss the complaints. What was Michael Wilson’s response just twenty minutes later? Three words: “Will investigate ASAP.”

Clearly, Linda Frese was alarmed at this response as she laid out a detailed email stating all the things the Newark Department of Health and Community Wellness should look for. Additionally, Ms. Frese asked Michael Wilson to have his inspectors check “all the hidden rooms throughout the facility.” After reading this email, I got the impression Linda Frese did not trust Michael Wilson’s inspectors to do the job correctly.

In response, Michael Wilson sent one of his inspectors in and they once again did a reactive and poor quality inspection. First, the inspector did not even complete an inspection report. Instead, they just listed out the New Jersey Department of Health’s areas to investigate and wrote mostly one or two sentence responses. Once again, the inspector often relied on AHS-Newark’s assertions. For example, the inspector simply accepted management’s word that 1) animals are removed from cages during deep cleaning, 2) all the animal control vans have air conditioning despite multiple allegations that these vehicles don’t and one dog died and another dog became seriously ill in one of these vehicles and 3) that animals are euthanized humanely. Thus, this was another inadequate inspection.

Despite the poor quality inspection, the report still found numerous violations of state animal shelter laws. The shelter admitted more kittens died the night before which could indicate violations of N.J.A.C. 8.23A-1.9 (c) that requires animals be observed daily for illness and receive prompt treatment. AHS-Newark also didn’t know the amount of water and disinfectant used in its solutions to clean cages. Obviously, the correct ratio of water to disinfectant in these solutions is critical to ensure proper disinfection and safety for the animals (i.e. avoid chemical burns, breathing in chemicals, etc.). Clearly, the shelter violated N.J.A.C. 8.23A-1.8 (c) that states shelters must clean with “all soiled surfaces with a detergent solution followed by a safe and effective disinfectant.” The shelter also violated N.J.A.C. 8.23A-1.6 and N.J.A.C. 8.23A-1.8 by not taking animals out of their cages during cleaning and allowing the animals to be in the enclosures while they were still wet. Also, AHS-Newark did not have hand drying paper which also violates N.J.A.C. 8.23A-1.8 (d) that states “Premises (buildings and grounds) shall be kept clean and in good repair in order to protect the animals from injury and disease, to facilitate the prescribed sanitary practices as set forth in these rules, and to prevent nuisances.” AHS-Newark also had numerous cats with no identification cards (i.e. how can the shelter know the medical history of animals and provide treatment if it can’t tell which cats are which). This violates N.J.A.C. 8.23A-1.13 which requires the shelter have accurate records of each animal.

The inspection report indicates AHS-Newark may have violated the humane euthanasia regulations in N.J.A.C. 8.23A-1.11. AHS-Newark records did not show it weighing animals to ensure it gave sufficient sedatives and euthanasia drug doses. Similarly, the euthanasia records did not indicate the shelter used the required humane injection method (typically intravenous). Additionally, the shelter provided no documentation that individuals who were not veterinarians were properly certified to humanely euthanize animals. Finally, AHS-Newark provided no documentation that it confirmed euthanized animals lacked a heartbeat, pulse, respiration and eye movement to ensure the animals were in fact dead before they was disposed of or cremated. Thus, AHS-Newark’s records indicate it may have violated N.J.A.C. 8.23A-1.11.

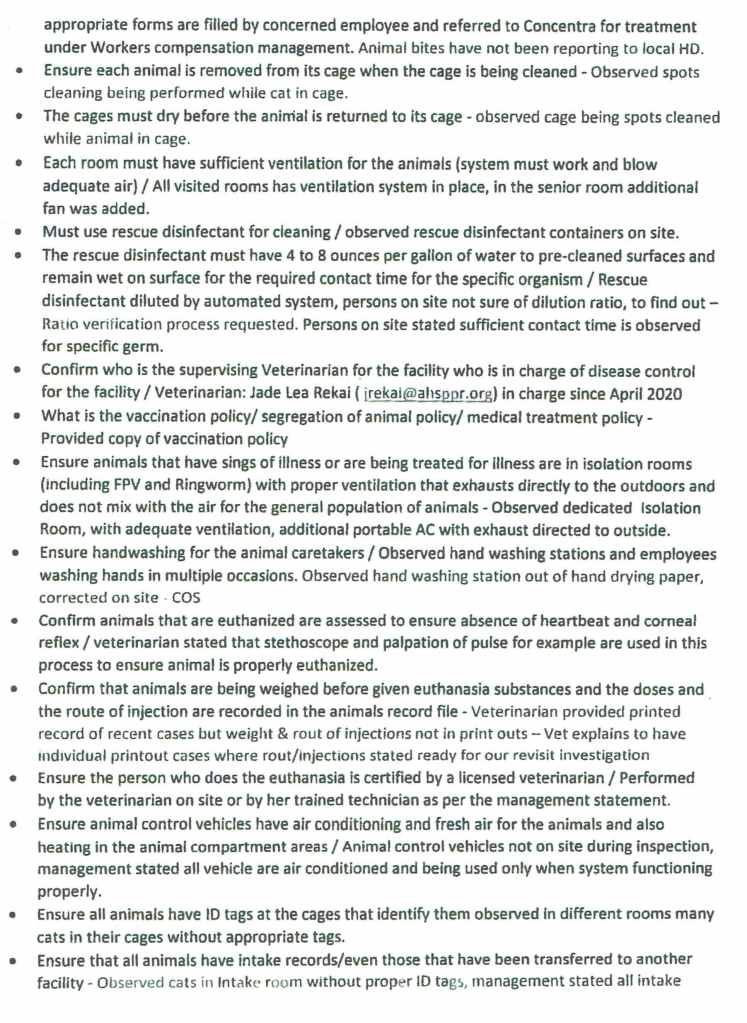
Subsequently, Michael Wilson stated AHS-Newark had several of these violations. In addition, Mr. Wilson said AHS-Newark broke the law by not reporting bites to the Newark Department of Health and Community Wellness.

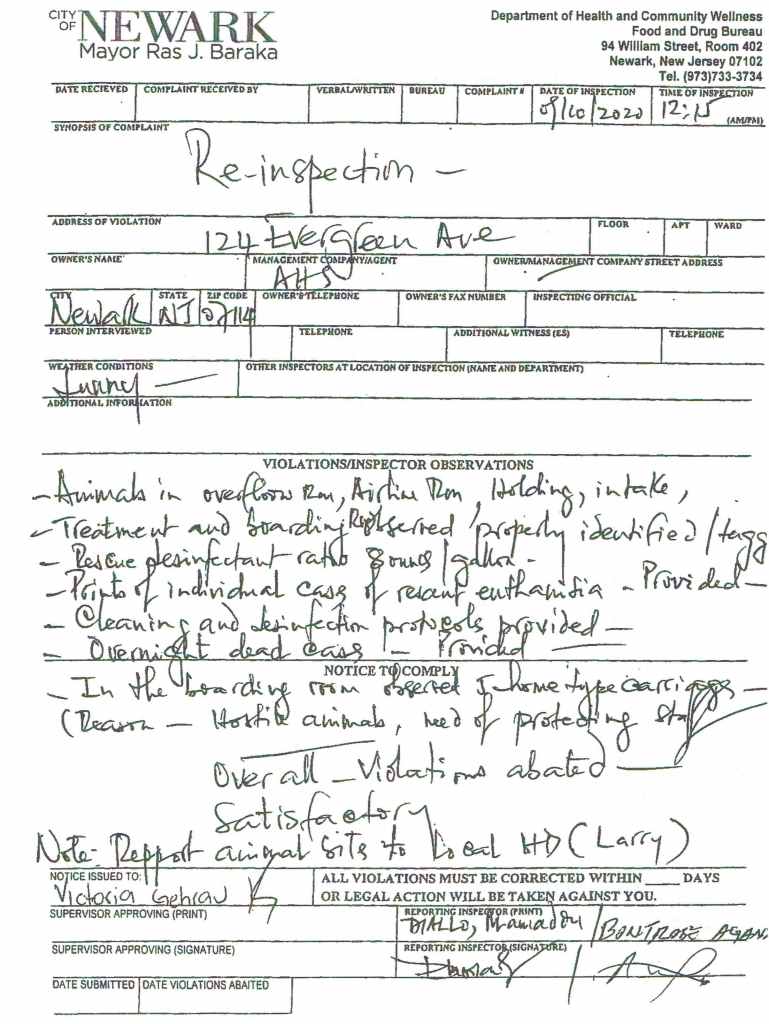
Miraculously, Michael Wilson’s inspectors visited AHS-Newark the next day and jotted down a few messy handwritten sentences stating the shelter fixed the violations. Furthermore, the inspectors gave AHS-Newark a “Satisfactory” grade despite the report indicating the inspectors did not do a full inspection. Does anyone in their right mind believe AHS-Newark should have a “Satisfactory” rating?

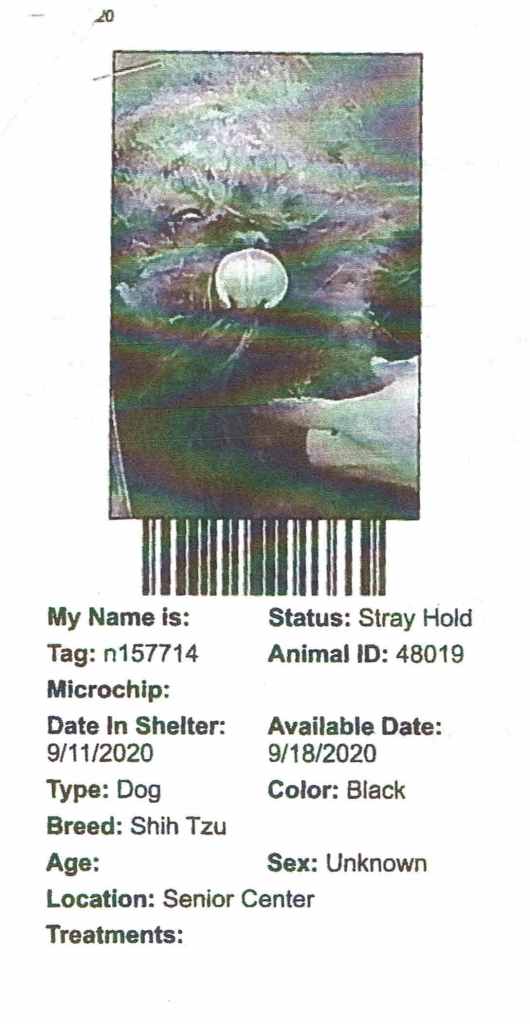
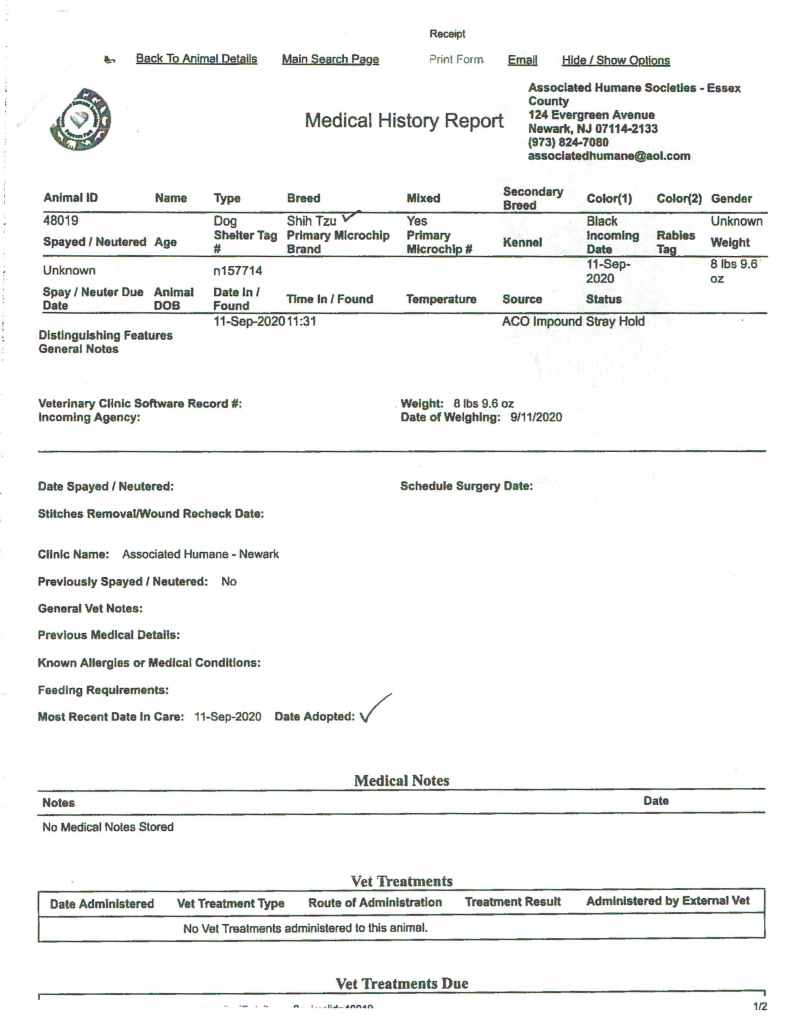
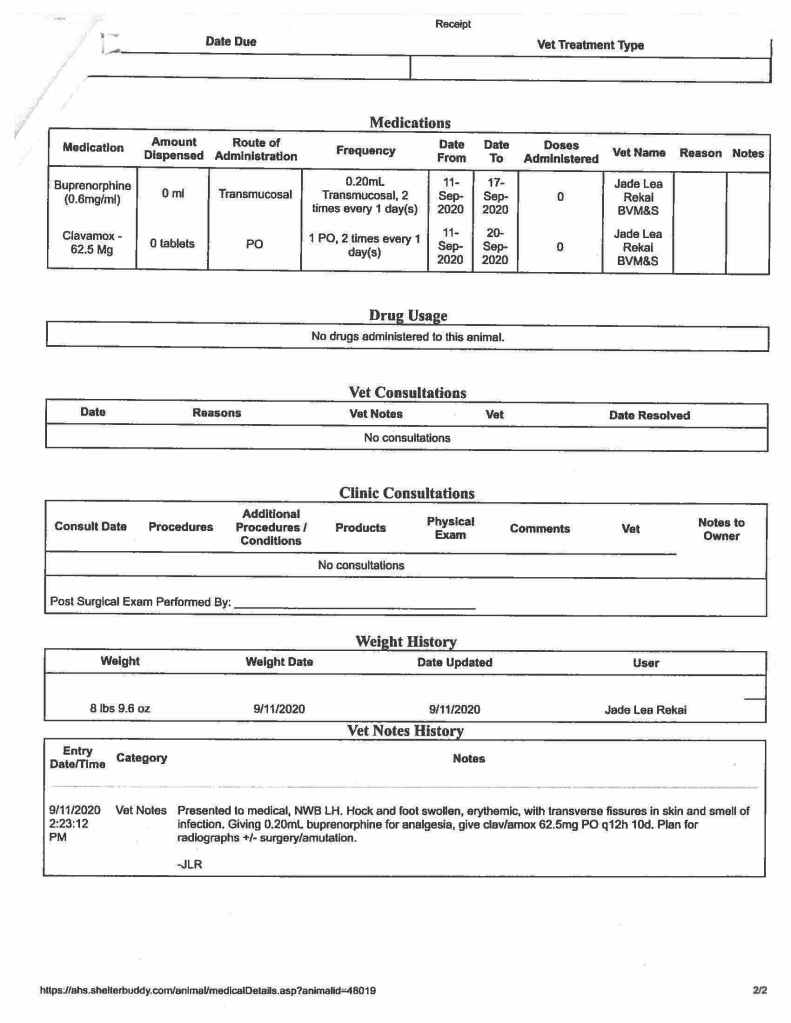
Subsequently, the New Jersey Department of Health’s Deputy State Public Health Veterinarian (i.e. Linde Frese’s boss) told Michael Wilson to investigate a case of a Shih-tzu dog alleged to have its coat matted with maggots and to not have received medical care for days. In fact, the complaint alleged the infection was bad enough that it could require a veterinarian to amputate the leg. This dog allegedly arrived at AHS-Newark on the very day the Newark Department of Health and Community Wellness last inspected AHS-Newark and gave it a “Satisfactory” grade. Interestingly, Michael Wilson forwarded this email to two of his inspectors stating he wanted them to jointly inspect AHS-Newark. In my opinion, this seems like he lacked confidence in his inspectors to individually do the job right.

The Newark Department of Health and Community Wellness inspected AHS-Newark the very next day and found everything hunky dory. Specifically, the inspectors saw the dog and the animal had his/her wound treated with pain medicine and an antibiotic. The shelter’s records indicated the dog came in on September 11, 2010, which was a day after the September 10, 2020 date the person making the complaint stated. While the inspector did review the shelter’s intake records for September 10, 2020, I don’t think the inspector can rely on such records given AHS-Newark’s repeated inability to keep accurate records. In other words, if the dog really came in on September 10, 2020 (i.e. if AHS-Newark did not enter the animal into its records until September 11, 2020) and did not receive treatment until the next day, AHS-Newark would have violated N.J.A.C. 8.23A-1.9(d) 1 that requires prompt veterinary care to relieve pain and suffering. Thus, the Newark Department of Health and Community Wellness once again relied on AHS-Newark’s assertions instead of thoroughly inspecting the shelter.

New Jersey Department of Health Fails to Do its Job

Twenty one years ago the New Jersey Commission of Investigation’s first report on the state and county SPCAs analyzed the animal shelter inspection system. You can read this report starting on page 126 of this link. In summary, the report found local health departments did not properly inspect animal shelters.

The rules and regulations governing the operation and conditions of shelters are contained in a document entitled Sanitary Operation of Kennels, Pet Shops, Shelters and Pounds, which was promulgated by the state DOH. Generally, it is acknowledged that the rules and regulations are adequate, but that they are not enforced vigorously. It is evident that the thoroughness of the inspection, the findings of deficiencies and the ultimate rating of the facility are dependent upon the discretion, thoroughness and skill of the inspector. As candidly admitted by one local inspector who had not conducted thorough and probing inspections, he simply had lacked the training and experience to perform anything more than a perfunctory visit. Based upon an examination of the inspection system, inspections and the effectiveness of the system vary greatly.

The New Jersey Commission of Investigation clearly described how the state health department did much better inspections than local health departments.

There were also differences in the types of inspections that were conducted by state officials versus state inspectors and by state versus local personnel. With rare exception, the inspections conducted by state DOH officials were more thorough and more likely to cite violations than those conducted by state DOH inspectors. Examples appear below in the inspections of the Cape May County and Hudson County SPCA shelters. Where SPCA shelters were problematic, the inspections conducted by the state DOH were more thorough and consistent than those conducted by the local authorities. As evidenced by the inspection findings for the Cape May County and Hudson County SPCA shelters, more thorough inspections were performed and significant violations cited when state officials visited the shelters.

Furthermore, the New Jersey Commission of Investigation explained how local health departments (e.g. the Newark Department of Health and Community Wellness) often did not want to identify problems due to the difficulty in finding an alternative shelter. In fact, they cited Jersey City’s Hudson County SPCA. Subsequent to the New Jersey Commission of Investigation’s report, Jersey City did find a facility for the newly formed Liberty Humane Society to operate and handle the city’s homeless animals.

The Commission was told that the dilemma perceived by local inspecting authorities in dealing with any shelter that is constantly in violation is that there is no realistic alternative facility if the shelter is shut down. Clearly, this was the situation with the licensing of the Hudson County SPCA shelter, despite the persistent and serious problems found there.

In the early 1990s, the state health department had more staff and was more focused on animal shelter inspections. As the New Jersey Commission of Investigation report explains, the state health department inspected every animal shelter once every two years. Based on the number of animal shelters in New Jersey today, that would amount to around 45 to 50 inspections each year. Additionally, the New Jersey Department of Health would spend time going over the issues with the local health departments.

The role of the state DOH in conducting shelter inspections has changed dramatically over the past decade. At the beginning of the 1990s, the department’s Infectious and Zoonotic Diseases Program had more staff and its focus was considerably more narrow than it is today. There were four field veterinary technicians who inspected shelters once every two years, in addition to a coordinator who occasionally conducted inspections. Typically, joint inspections with the local health official were conducted, and the DOH inspector spent time reviewing procedures and pertinent issues with the local authority.

Beginning in the mid-1990s, the New Jersey Department of Health conducted far fewer inspections. As a result of budget cuts, the department had fewer staff and were responsible for more things. The state health department stopped inspecting shelters proactively and only responded to certain complaints. In fact, just as the New Jersey Department of Health is currently doing with AHS-Newark and other shelters, it often just referred the problems to incompetent local health departments. Nonetheless, the state health department’s animal shelter inspection function, which had three people, conducted six shelter inspections in 1999. As a comparison, the New Jersey Department of Health’s animal shelter inspection team has two members currently, and hasn’t inspected a single shelter in almost two years. In fact, the New Jersey Department of Health has not inspected any shelter other than Hamilton Township Animal Shelter since October 21, 2017 (i.e. about three years). Thus, the New Jersey Department of Health is doing an even worse job now than it did twenty one years ago when the New Jersey Commission of Investigation wrote its scathing criticism of the agency.

Commencing in about 1994, as department budgets were cut throughout state government and positions were eliminated through attrition, the program’s staff was reduced drastically. Currently, the program is not only responsible for many more areas of the public health, but its staff consists merely of the State Public Health Veterinarian, the Senior Public Health Veterinarian and one field veterinary technician. The routine, biannual inspection has been replaced by a reactive inspection, which occurs only when substantive complaints are received. The DOH, which is besieged by numerous complaints daily, dismisses many complaints because it lacks jurisdiction over the matter alleged and routinely refers complainants to the local health office even when it has jurisdiction. In 1999, the DOH conducted approximately six shelter inspections and only three as of August 2000.

The New Jersey Commission of Investigation report also criticized the state health department for failing to fine shelters for violations. While the individual fines of $5-$50 per violation are small, they can add up if the infractions involve many animals and exist for many days. At a minimum, fines can send the message the shelter must improve. As in the past, the New Jersey Department of Health failed to fine AHS-Newark for its repeated violations or even pressure the Newark Department of Health and Community Wellness to close AHS-Newark down. Given the New Jersey Department of Health did fine the East Orange Animal Shelter $4,000 in 2015 (the shelter has significantly improved since then) and asked and got the Linden Health Department to close Linden Animal Control in 2014, the state health department can take positive action. However, the New Jersey Department of Health has simply chose to do nothing in recent years.

However, the DOH does possess the statutory authority to institute enforcement proceedings to assess fines against a shelter. According to DOH officials, this remedy is reserved for only the most egregious cases. The department’s clear preference has been to bring a facility into compliance through recommendations, technical assistance and frequent reinspections. Its reluctance to institute enforcement proceedings is reflected in the facts that it has imposed sanctions only twice in the past 15 years or more and that both cases were instituted in 2000, the first at the insistence of the Attorney General’s Office and the second on DOH’s initiative.

The New Jersey Commission of Investigation severely criticized the state and local health departments coddling approach to regressive shelters twenty one years ago. Specifically, the New Jersey Commission of Investigation stated the health departments, who were doing far more then than now, must issue large fines to regressive shelters and close those facilities if they choose to not fix their problems. Most notably, the New Jersey Commission of Investigation clearly said municipalities must take over these shelters or find other ones to use.

The approach of the state Department of Health to counsel and advise a shelter’s management on how to remedy the violations and improve the conditions is admirable. However, such an approach is effective only when the management is amenable to making the improvements. When it becomes clear that such an approach is unsuccessful, then the department must be aggressive in pursuing legal proceedings. The language threatening enforcement proceedings, which typically appears in letters from the department to a shelter’s management, must be more than mere words. The failure to follow through leads to a loss of credibility for the department and reinforces the cavalier attitude of the shelter’s management. The inspecting and licensing authorities on the local level must conduct themselves in similar fashion. In the event of mounting fines and continued lack of responsiveness by shelter management, the municipality must be prepared to assume control of the shelter or entrust its operation to a suitable alternative.

The New Jersey Commission of Investigation repeated its conclusions about the inspection system in a scathing report on AHS-Newark in 2003. You can read that report here. The report made the following conclusion:

The history of AHS’s shelter operation has been dominated by deplorable kennel conditions, inhumane treatment of animals by workers, mismanagement and nonexistent or inadequate medical care. The problems were neither singular nor occasional. The accounts and descriptions provided by members of the public and former and current staff members, including veterinarians, paint a bleak picture of shelter life. The reality for the animals belied AHS’s propaganda that its “sole purpose” has been “the care and welfare of animals” and that it has “a high adoption rate.”

As a result of the New Jersey Commission of Investigation’s reports on the SPCAs and AHS, the state formed the Office of Animal Welfare and a large group of stakeholders, which was formed by an Executive Order from Governor McGreevey, issued the Animal Welfare Task Force Report in 2004. The report recommended local health authorities conduct at least two annual inspections (not counting those relating to complaints) of shelters. Additionally, the Animal Welfare Task Force report said the state health department should inspect every animal shelter at least once a year.

Local health departments should inspect each animal facility a minimum of two times per year (inspections conducted in response to complaints should not count for this purpose). DHSS should supplement local oversight by inspecting each facility at least once each year

As a result of the report’s recommendations, the Office of Animal Welfare had a staff of five people to inspect animal shelters that was in addition to the New Jersey Department of Health’s inspection staff. After a couple of years, the Office of Animal Welfare only had two staff left and they were merged into the New Jersey Department of Health’s inspection team. Based on conversations with a knowledgeable person, the two remaining Office of Animal Welfare staff conducted significantly more inspections of shelters, pet stores, etc. each year than the state health department does today. Sadly, the New Jersey Department of Health did not replace these inspectors when they left a number of years later.

Despite the New Jersey Department of Health having less personnel, I found the state health department was somewhat responsive to complaints when I began NJ Animal Observer in 2014. The New Jersey Department of Health’s inspections over this time and the results are listed below.

Even with the limited actions the state health department took, the inspections often had some positive impact on shelters (i.e. closing regressive facilities down and/or getting rid of bad management). With the strong animal advocacy community in New Jersey and the power of social media, these terrible inspection reports became known to many people. In addition, print and/or television media also often ran stories on these inspections. Thus, even with the New Jersey Department of Health doing little more than inspecting animal shelters, the impact often was significant.

As the timeline of state health department inspections shows, the New Jersey Department of Health started inspecting far fewer shelters after the 2017 AHS-Newark inspections and stopped inspecting altogether after its January 2019 Hamilton Township Animal Shelter inspection. In the last two years, numerous people have asked the New Jersey Department of Health to inspect shelters after making serious allegations. Also, staffing cannot explain the state health department’s refusal to inspect as it has the same number of inspectors over the entire time period above (i.e. 2014 to 2020). Thus, there is no substantive reason why the New Jersey Department of Health stopped inspecting animal shelters.

Clearly, the New Jersey Department of Health’s refusal to inspect animal shelters has had dire results for the animals at AHS-Newark and other regressive shelters. As the information above shows, AHS-Newark’s problems not only remain, they may be getting worse. The inspection reports indicate animals piling up in the shelter and rampant disease outbreaks. As of the time I’m writing this blog, AHS-Newark stopped adopting out dogs and sending dogs to rescues due to canine parvovirus at the shelter. In fact, the public’s frustration has grown to the point where shelter reform bill S636 includes a provision requiring the state health department to inspect every animal shelter three times a year. Given the ongoing problems at one of the state’s largest animal shelters, Governor Murphy and New Jersey Department of Health Commissioner Persichilli must provide an explanation as to why the state health department has not performed its job, make the New Jersey Department of Health inspect animal shelters, particularly those with repeated major problems, and take the actions the New Jersey Commission of Investigation and Animal Welfare Task Force demanded they do in 1999, 2003 and 2004.

2014 New Jersey Animal Shelter Statistics Show Little Improvement

East Orange Animal Shelter Dog

Most New Jersey animal shelters voluntarily report detailed data to state authorities. Last September, I shared the 2014 summary statistics for New Jersey animal shelters on my Facebook page. Each year, the New Jersey Department of Health requests each licensed animal shelter in the state to submit animal shelter data for the previous year. Animal shelters voluntarily submit this data in the “Shelter/Pound Annual Report.” The New Jersey Department of Health takes these Shelter/Pound Annual Reports and compiles the number of dogs, cats and other animals impounded, redeemed, adopted and euthanized to prepare its Animal Intake and Disposition report. However, the Shelter/Pound Annual Reports include additional information on how animals were impounded (i.e. strays, owner surrenders, rescued from in-state facilities, rescued from out of state shelters, and cruelty/bite cases) and disposed of (i.e. returned to owner, adopted, sent to rescue/another shelter, and died/missing). Additionally, the Shelter/Pound Annual Reports include the number of animals in shelters at the beginning and end of the year as well as the maximum number of animals facilities can hold. Thus, the Shelter/Pound Annual Reports include very important data not found in the New Jersey Department of Health’s summary report.

I compiled the data from these reports and analyze the results in this blog. 2014 statistics for each New Jersey animal shelter are listed at this link.

Garbage Data Raises Serious Questions About New Jersey Animal Shelters’ Statistics

Several animal shelters, which reported statistics in prior years, failed to submit data in 2014. Specifically, Livingston Animal Shelter, Hunterdon Hills Animal Hospital, All Pets Veterinary Hospital and Warren Animal Hospital disclosed this data in 2013, but did not do so in 2014. These shelters failure to disclose data raises serious questions. For example, are they trying to hide embarrassing statistics from the public?

Most New Jersey animal shelters do not properly account for their animals. Simple math dictates the number of animals at a facility at the beginning of the year, plus all animals coming in during the year, less all animals leaving for the period, should equal the number of animals a shelter has at the end of the year. Stunningly, 67 out of 96 shelters reporting these dog statistics and 68 out of 95 facilities submitting this cat data failed to get this right. This raises serious questions about the accuracy of these shelters’ reported statistics. Even worse, 42 of the 67 shelters with flawed dog statistics and 43 of the 68 facilities with incorrect cat statistics should have had more animals at the end of the year then reported. While these errors could have been due to incorrect counts of the number of animals at facilities, the more likely answer is many outcomes, such as animals killed, dying, or gone missing, were not recorded. Given 63% of the errors were due to shelters having less rather than more animals on hand at the end of the year than they should have had lends credence to the theory that errors were mostly due to shelters failing to account for various outcomes. To put it another way, 2,699 cats and dogs should have had outcomes reported and did not. Thus, there is the potential that as many as 2,699 additional dogs and cats were killed, died or went missing from New Jersey animal shelters than were reported in the last year.

Shelters may have failed to classify animals adopted out and sent to rescue properly. Both Paterson Animal Control and Elizabeth Animal Shelter reported no animals were sent to rescues and all dogs and cats leaving their facilities alive were owner reclaims or adoptions. However, rescues I know who work closely with these two facilities told me both shelters rarely adopt animals directly to the public. This makes sense as neither shelter advertized animals for adoption (i.e. no adoption web site or social medial pages run by the two shelters) in 2014. One has to wonder how many other facilities failed to properly classify adoptions and rescues properly. This data is very important as it provides details on the burden rescues and other shelters are taking from these facilities.

We need better oversight of New Jersey animal shelters’ data reporting. Currently, these statistics are voluntarily reported and most shelters are not taking this seriously. For example, I noticed a large number of reports were submitted many months after the end of the year. This data should be easy to compile since facilities can utilize animal shelter software programs, some of which are free, to do this task. Furthermore, New Jersey animal shelter laws mandate facilities maintain much of the raw data found in the Shelter/Pound Annual Report. Unfortunately, New Jersey Department of Health inspections routinely find shelters do not properly keep records on animals. We need to make the Shelter/Pound Annual Report mandatory for animal shelters along with serious penalties for significant errors (especially if deliberate). In order for animal shelters to take data reporting seriously, we may also need to require audits of these reports. Thus, these results show we need stronger laws and the New Jersey Department of Health to play a greater role in ensuring reported animal shelter statistics are in fact accurate.

Despite the errors in these reports, the data provided still reveals important information.

More Animals Losing Their Lives in New Jersey Animal Shelters Than Disclosed in Summary Report

The more detailed data in the Shelter/Pound Annual Reports allows one to more critically examine the percentage of locally impounded animals dying in New Jersey’s animal shelters. The following table summarizes my analysis of the kill/death rate calculated from the New Jersey Department of Health’s summary report and the data reported in the Shelter/Pound Annual Reports.

2014 Summary Stats (1) (1) (2)
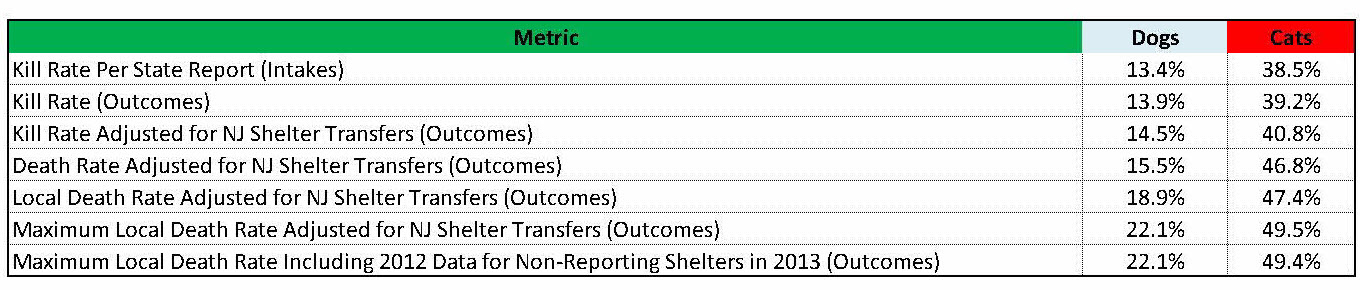
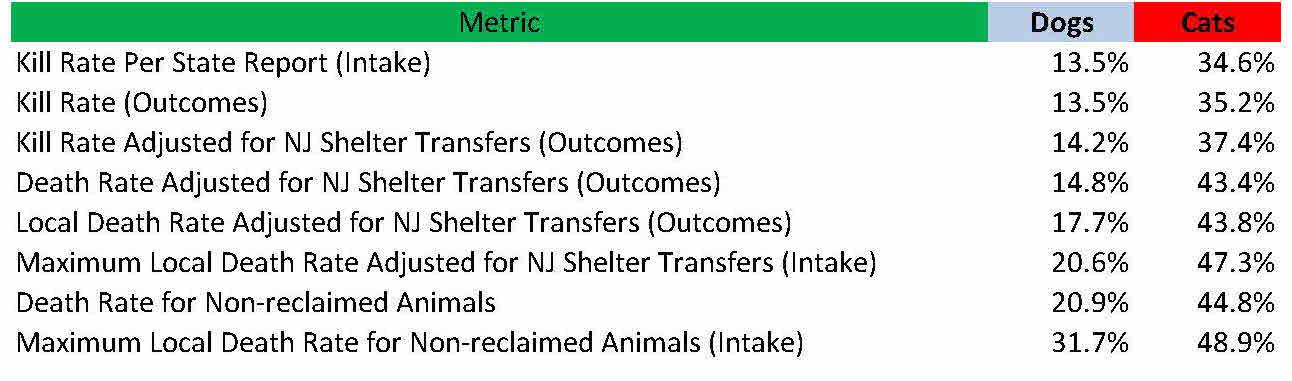
The Animal Intake and Disposition report prepared by the New Jersey Department of Health only allows one to calculate the number of animals killed as a percentage of total animals impounded or intake. I prefer calculating the kill rate as a percentage of outcomes rather than intake as this metric directly compares positive and negative outcomes. Using intake depresses the kill rate since shelters can simply hold animals for a long time to the point of overcrowding. Calculating kill rate based on outcomes rather than intake increases the cat kill rate from 34.6% to 35.2% and the dog kill rate remains the same.

To calculate the statewide kill rate, we must also back out transfers from one New Jersey animal shelter to another state facility to avoid counting animals still in the state’s shelter system or registering two outcomes for the same animal (i.e. one New Jersey animal shelter transfers a dog or cat to another state facility who then adopts out the animal). This adjustment increases the dog kill rate from 13.5% to 14.2% and the cat kill rate from 35.2% to 37.4%.

In addition, we should increase the kill rate for animals who died or went missing in shelters. I label this metric the death rate as these animals are likely dead or in a very bad situation. After making this adjustment, the dog death rate increases from 14.2% to 14.8% and the cat death rate rises from 37.4% to 43.4%.

Also, many shelters transport easy to adopt animals from out of state which artificially increases live release rates. To properly calculate the percentage of New Jersey animals losing their lives, we need to adjust for transports. Unfortunately, shelters don’t break out their save rates by local and out of state animals. However, most likely nearly all of the out of state animals (primarily puppies and easy to adopt dogs) make it out of shelters alive. Therefore, I back out the number of out of state transports to estimate the local death rate except for St. Hubert’s. Since St. Hubert’s subsequently transfers many of these animals to other shelters, I only subtract out the number of dogs St. Hubert’s rescues from out of state less the dogs it transfers to other shelters. This adjustment increases the New Jersey dog death rate from 14.8% to 17.7% and the state cat death rate from 43.4% to 43.8%.

Also, I estimate a maximum local death rate by including the number of unaccounted for animals described in the section above. Making this adjustment increases the maximum potential New Jersey dog death rate from 17.7% to 20.6% and the maximum potential state cat death rate from 43.8% to 47.3%.

Some animal shelters quickly return large percentages of their animals to owners. At these shelters, the populations served are typically well-off and animals are licensed and have microchips. To account for the animals facilities actually have to shelter, I calculated a death rate for non-reclaimed animals and a maximum potential death rate for non-reclaimed local animals. The non-reclaimed death rate and maximum potential death rate for dogs is 20.9% and 31.7%. Non-reclaimed cats had a 44.8% death rate and a 48.9% maximum potential death rate. Thus, the percentage of New Jersey animals losing their lives in our state’s animal shelters may be much higher than previously thought.

Overall, the statewide statistics showed little improvement from 2013. The dog death rate in 2014 only was three tenths of one percent lower than 2013. While the maximum potential dog death rate was 3.4 percentage points lower in 2014, we don’t know whether that is due to better record keeping or actually improved life saving. The cat death rate and maximum potential death rate decreased by 3.4% and 4.2%. The growing acceptance of TNR likely slightly decreased the percentage of cats losing their lives in New Jersey animal shelters this year. That being said, the improvements were very small and the percentage of dogs and cats losing their lives in the state’s animal shelters is still way too high.

Death Rates Extremely High at a Number of New Jersey Animal Shelters

Dogs and cats are likely to lose their lives or go missing at a number of New Jersey animal shelters. Shelters with the highest death rates for dogs and cats (excluding very low intake facilities) are listed in the following tables:

Dog Death rate 2014

Cat Death Rate 2014

Thus, both dogs and cats have a very good chance of leaving many New Jersey animal shelters dead rather than alive.

In terms of raw numbers, the following shelters had the most animals lose their lives or go missing:

Total Killed Died 2014 Dogs

Total Killed Died 2014 Cats

Many shelters fail to account for large numbers of their animals. As discussed above, a shelter’s number of animals at the end of the year should be calculated as follows:

Beginning number of animals + animals impounded – animals leaving the shelter

Unfortunately, a large number of shelters take in far more animals than they can explain where they went. Shelters having the highest numbers of unaccounted for dogs and cats are listed in the following tables:

Unacct dogs

Unacct cats 2014

Dog and cat death rates at many shelters may be even higher if these unaccounted for animals are counted as dead or missing. If we only consider animal shelters which reported transporting few or no animals in 2014, facilities with the highest dog and cat death rates considering the unaccounted for animals described above are as follows:

Max Pot Dr 2014 Dogs

Max Pot cats 2014

Thus, the plight of dogs and cats may be far worse in New Jersey animal shelters when we consider the unaccounted for animals.

Shelters Turn Their Backs on New Jersey’s Animals

New Jersey animal shelters rescue far more animals from out of state than other New Jersey animal shelters. Specifically, 5,090 dogs were transferred from out of state animal shelters compared to only 1,692 dogs taken in from other New Jersey animal shelters. The number of out of state dogs transported into New Jersey decreased in 2014, but that is due to problems at Jersey Animal Coalition and Helmetta Regional Animal Shelter during the year. These problems likely resulted in fewer transported dogs. However, Jersey Animal Coalition, which is now closed, did not report any statistics for 2014. Furthermore, Helmetta Regional Animal Shelter erroneously reported it transported no dogs during 2014 as the facility imported many dogs from the south before the shelter’s problems received media attention in the summer of 2014. Thus, the decrease in transports is likely due to a combination of  incorrect reporting and increased regulatory pressure on these two shelters that transported many dogs into New Jersey.

While perhaps some shelters, such as Animal Alliance in Lambertville, take animals from nearby New York or Pennsylvania animal control shelters, the overwhelming majority of these dogs most certainly came from down south. In fact, New Jersey animal shelters transported more dogs from out of state than dogs who were killed in, died in and went missing from New Jersey animal shelters. This number does not include additional dogs transported in from out of state by rescues operating without a physical facility. Shelters transporting the most dogs from out of state were as follows:

Dogs Transported 2014

Return to Owner Rates Better Than Average at Most Shelters

Return to owners (“RTO”) rates are one of the positive results from this analysis. Overall, the dog and cat RTO rates of 55% and 5% are approximately twice the national average. As I noted in my blog on reuniting lost pets with owners, return to owner rates are highly correlated with socioeconomic status. Wealthier people likely have more resources/knowledge to license and microchip their dogs. Similarly, people with greater incomes are more likely to afford reclaim fees or ransom payments to animal shelters. New Jersey’s RTO rates for dogs clearly fit this pattern with shelters serving wealthy towns returning most stray dogs to owners while many urban shelters are only returning about around a quarter of lost dogs to owners. Clearly, we need to help people in urban areas get microchips and ID tags on their dogs. Additionally, we need to create pet help desks at shelters in these cities to help people pay the reclaim fees, which are often mandated by the cities themselves, when necessary. The statewide cat reclaim rate, like figures from across the nation, is still very low and suggests shelters need to figure out better ways to get lost cats back to their families. New Jersey should allow shelters to transfer stray cats to rescues during the mandatory 7 day hold period since few are returned to owners at shelters. This would open up space to save more cats and reduce the chance of disease (i.e. cats spending less time in shelters are not as likely to get sick).

To get a better idea how organizations are doing with animals they actually have to shelter, I also examined what percentage of non-reclaimed dogs lose their lives at each facility. Shelters with the highest non-reclaimed dogs death rates are as follows:

non-reclaimed dog death rate

Shelters with the highest maximum non-reclaimed local dogs death rates are as follows (excluding facilities that reported transporting many dogs and taking very few animals in):

Max non-reclaimed dog death rate

Shelters Leave Animal Enclosures Empty While Dogs and Cats Die

New Jersey animal shelters fail to use their space to save animals. Based on the average number of animals at all of New Jersey’s animal shelters at the beginning and the end of 2014, only 53% of dog and 65% of cat capacity was used. Given December is a low intake month, I also increased these populations to an average intake month. This adjustment only raised the dog and cat capacity utilization to 62% and 85%. These estimates likely overestimate the average capacity utilized as many facilities kill animals once they reach a certain population level. Many animal shelters with low kill rates failed to rescue animals with their excess space. Additionally, other shelters used little of their available space and still killed a large percentage of their animals. Some examples after increasing the population (and therefore capacity utilization) based on the adjustment discussed above are as follows:

Space usage dogs 2014

Space usage Cats 2014

Thus, many New Jersey animal shelters are killing dogs and cats despite having ample space to house these animals.

New Jersey’s animal shelters continue to fail the state’s animals. The state’s animal shelters only impound 9.0 dogs and cats per 1,000 New Jersey residents. If we just count animals originating from New Jersey, the state’s animal shelters only impound 7.9 dogs and cats per 1,000 people. As a comparison, the average community in the country impounds anywhere from 14-30 animals per 1,000 residents based on estimates from Animal People Newspaper and the Humane Society of the United States. Despite New Jersey shelters impounding a fraction of the animals other no kill communities take in on a per capita basis, the state’s animal control facilities continue to kill and allow animals to die under their care. Even worse, many of these shelters can’t even properly keep track of how many animals leave their facilities dead or alive. Our state’s animals deserve far better treatment than this. Contact your local city council members and mayor and demand better from the animal shelter serving your community. We can do so much better and it is time our shelters operate this way.

South Orange Board of Health’s Illogical Quest to Eliminate Community Cats

Earlier this summer, the South Orange Board of Health made their case for opposing TNR in the Village. During the presentation, the Board of Health harped on diseases that are virtually never transmitted from feral cats to people, such as toxoplasmosis, rabies, cat scratch fever and ringworm. Ironically, the South Orange Board of Health claims they are cat lovers and favor “trap and adopt” when they know very well many community cats are essentially wild and cannot live in a home (i.e. trapped feral cats are killed). The South Orange Board of Health stated they would entertain other ideas, but took the extreme position that the risk of one person catching a disease is worth killing massive numbers of cats. Furthermore, the South Orange Board of Health asserted cats are decimating wildlife. Are the Board of Health claims about the risks feral cats pose to people and the environment correct?

Misleading Rabies Hype

The South Orange Board of Health’s assertion that feral cats are a significant rabies risk does not match the evidence. During the presentation, the South Orange Board of Health used two recent cases of raccoons in South Orange contracting rabies as a reason for their opposition to community cats and TNR. Furthermore, the Board of Health stated vaccinating feral cats multiple times over their lifetimes is difficult. While re-trapping feral cats is not easy, the rabies vaccine most likely, as with most vaccines, lasts for far longer than the stated 3 year protection period since that figure is based on studies only lasting for 3 years. A leading researcher in the field believes these vaccines provide protection for 7 years at a minimum and is conducting a study on this very topic. For example, this researcher found other common vaccines provide protection for 9 years. The fact that no person has contracted rabies from any cat, let alone a feral cat, in the United States in the last 40 years proves feral cats transmitting rabies to people is not a serious public health concern.

The Board of Health also mislead the public by stating 90% of domestic animal rabies cases involve cats. Cats making up 90% of domestic animal rabies cases sounds bad right? However, 90% of a small number is nothing to get alarmed about. Obviously, dogs will have fewer rabies cases since most are vaccinated and don’t roam. Thus, the only domestic animals that have any real chance of getting rabies are unvaccinated cats (which are vaccinated under a TNR program) making the Board of Health’s assertion misleading.

Virtually all rabid animals are wild animals. In 2014, the New Jersey Department of Health found only 6% of all rabid animals in New Jersey were cats (which were certainly not vaccinated). In fact, 10 times more raccoons contracted rabies than cats last year in our state. Additionally, outdoor cats have lived in close proximity to humans for centuries and it seems odd that cats all off a sudden became a major public health threat. Thus, the South Orange Board of Health’s obsession with cats makes little sense from a public health perspective.

Toxoplasmosis Hype Has No Basis in the Real World

The South Orange Board of Health asserted people contracting toxoplasmosis from feral cats is a major public health concern, but real world evidence contradicts this claim. During the presentation, the South Orange Board of Health stated cats going to the bathroom outside could cause people with compromised immune systems to catch the disease. However, a person would have to not only touch these feces, but also ingest it as well to catch toxoplasmosis from an outdoor cat. In addition, cats who have this disease are only contagious for a few weeks. No wonder studies showed most toxoplasmosis cases in people come from eating undercooked meat and pregnant women, which are among the most likely people this parasite would infect, are unlikely to catch toxoplasmosis from a cat. Thus, the South Orange Board of Health exaggerated a health risk from feral cats.

Ironically, the South Orange Board of Health hypes the risk of zoonotic diseases much like anti-wolf groups in the Rocky Mountain states. These groups advocate, and even celebrate, the killing of wolves. The U.S. Fish and Wildlife Service rightly responded that these diseases rarely are contracted by people and are not a significant risk. Sadly, the South Orange Board of Health sounds more like anti-conservation nuts than a respected government agency.

Cats Do Not Negatively Impact Prey Populations in Natural Areas

The South Orange Board of Health claimed community cats are an ecological disaster and are decimating songbird populations. In particular, one of the South Orange Board of Health members stated this personally hurt him because he likes seeing birds in the park. Additionally, the South Orange Board of Health took PETA’s position that it is better to kill feral cats than let them live outside since such cats are suffering. So what does the evidence state about cat impacts on bird populations and the health of feral cats?

Indoor/outdoor owned cats primarily live and hunt in disturbed ecosystems within human developments. In a study on the island of Corvo, where no competing predators or large scale TNR programs exist to limit cat movements, found owned cats virtually never roamed more than 800 meters from their home. A study taking place in Albany, New York where coyotes existed, and which also live in South Orange, showed cats on average only roamed through the yards of four homes and almost never entered a forest preserve adjacent to the area (only 2 of 31 hunts occurred more than 10 meters into the forest). Thus, owned cats that roam outside primarily hunt within human developed habitats where the ecology and the mix of wildlife species are already disturbed.

Feral cats also primarily live in human developed areas rather than native animal habitats when coyotes are present. A study conducted in the Chicago Metropolitan area found coyotes primarily inhabited natural areas while feral cats were almost entirely confined to residential locations. Furthermore, the study found feral cats were generally healthy and had survival rates at the upper end of the range of wild carnivores. Therefore, this study contradicted the South Orange Board of Health’s claims that feral cats are decimating native wildlife and are suffering living outside.

Another extensive study confirmed the fact that feral cats do not spend much time in native animal habitats when coyotes are present. The study, which was conducted in 2,117 locations in 6 states, found cats virtually never spent time in native animal habitats where coyotes existed. Below is the author’s summary of these findings:

“Given the fact that we know domestic cats kill a lot of native wildlife, if cats are getting in our natural areas, it’s a big conservation concern,” says Kays. “That’s not what we found. There were basically no cats in 30 of the 32 protected areas we surveyed, and the one consistent variable was the presence of coyotes. The pattern was obvious and striking.”

“Basically no cats” means that over the course of the study, 16 parks had zero cats, and in 14 of the protected areas, a single cat was detected. Cameras were set up in state and national parks in Maryland, Virginia, West Virginia, North Carolina, South Carolina and Tennessee, and in 177 sites in small forested patches and suburban areas around Raleigh, N.C.

Thus, feral cats in our area, which has coyotes, cannot significantly impact native animal populations since these cats virtually never go to the places where native wildlife populations primarily live in.

Flawed Cat Predation Impacts

The studies purporting to support cats decimating native wildlife lack the basic requirements of reputable predator-prey research. To negatively impact prey populations, predators must remove a significant percentage of those prey populations. However, most of these studies purportedly showing cats decimating native wildlife populations, particularly those in continental locations like South Orange, do not quantify how significant these predation numbers are relative to the sizes of the prey populations. The author of the cat study from Albany, New York cited above clearly describes this as follows:

While a number of researchers have extrapolated kill rates from a few cats into huge estimates of prey killed by cats over large areas (e.g. free-ranging cats kill as many as 217 million birds/year in Wisconsin (Coleman, Temple & Craven, 1997) and 220 million prey/year in the UK (Woods et al., 2003)), these are rarely contrasted with similar estimates of potential prey populations over the same scales. Unfortunately, biologists have rarely sampled both cat and prey populations in such a way that direct effects on prey populations can be shown (e.g. house cats reduce scrub breeding birds: Crooks & Soule, 1999; cat colonies reduce grassland birds: Hawkins, 1998).

The study’s author also explains how cat predation studies conducted on islands and other parts of the world, which are commonly cited as a reason to exterminate outdoor cats, are not applicable in the northeast:

First, harsh New York winters probably function to not only restrict IOHC movement for much of the year (George, 1974; Churcher & Lawton, 1987), but also they may limit the suitability of the area for true feral cats compared with warmer climates. Second, the native potential prey species in mixed coniferous/deciduous forests of northeastern North America may be less vulnerable than other areas because it includes few lizards or low-nesting birds. For example, the scrub nesting birds hunted by IOHC in suburban southern California (Crooks & Soule, 1999) might be expected to be more vulnerable than small mammal or canopy nesting bird populations simply because their low nesting habits are more easily exploited by scansorial cats (i.e. an evolutionary trap: Schlaepfer, Runge & Sherman, 2002). Finally, the nature preserve around these neighbourhoods includes enough forest to support populations of cat predators including coyotes (Canis latrans) and fishers (Martes pennanti: Kays, Bogan & Holevinski, 2001). The presence of these predators probably functions to limit feral cat numbers, as well as the movement of any IOHC into the forest preserve (Crooks & Soule, 1999).

Additionally, not all predation events have the same impacts on prey populations. Ecologists classify predation as either additive or compensatory. Additive predation, as the name suggests, means that killing a prey animal adds mortality and reduces the prey species’ population. On the other hand, if a predator kills a prey animal that is unlikely to survive long and/or breed, then the predation event is labeled compensatory and will not decrease the prey population. For example, if a cat kills a very young bird that fell from a tree or a very sick bird, then the cat is simply killing an animal that was going to die anyway. Given cats in TNR programs are fed, cats will have little incentive to work hard to kill healthy prey. Thus, the South Orange Board of Health’s review of the “evidence” failed to consider this critically important factor.

The South Orange Board of Health also ignored potential factors positively increasing songbird populations in developed areas. For example, bobcats are native to New Jersey and prey on birds, but this predatory species no longer lives in South Orange. Therefore, community cat predation on songbirds may partially compensate for native bobact predation no longer taking place. Additionally, people feed birds which may artificially increase populations of birds cats prey on.

The South Orange Board of Health also did not consider how people feeding birds negatively impacts native bird populations. A recent study in New Zealand found humans feeding birds increased non-native species numbers at the expense of native birds. In addition, another study found bird feeding resulted in many more birds catching serious diseases. A study conducted in Canada, reported bird collisions with house windows nearly doubled after bird feeding was started. Another study from Northern Ireland found winter feeding caused one bird species to lay its eggs too early in the spring when ample food was not yet available, and supplemental winter feeding could favor nonmigratory species over migratory species not receiving the extra food. Additionally the study stated bird feeding was disturbing the natural ecology of these species:

It seems highly likely that natural selection is being artificially perturbed, as feeding influences almost every aspect of bird ecology, including reproduction, behavior, demography, and distribution.

Thus, the South Orange Board of Health ignores the very real dangers of residents feeding birds, but instead focuses on community cats which have little to no impact on native birds in the area.

Eradicating feral cats also has other negative unintended consequences. On Macquarie Island, which is a United Nations Education, Scientific and Cultural Organization (“UNESCO”) World Heritage Site, feral cat eradication efforts led to an increase in rabbit and other rodent populations. The increased rabbit populations devastated the island’s vegetation and likely negatively impacted many native birds dependent on these natural habitats. In New Zealand, another study documented a feral cat eradication program causing the rat population to increase. The rat population subsequently reduced the breeding success of the Cook’s petrel, which is a native sea bird species. Thus, the South Orange Board of Health’s cat eradication goal may negatively impact native wildlife.

South Orange Board of Health’s Desire to Eliminate Cats May Increase Lyme Disease and Other Infections

Lyme disease is a potential crippling disease. The disease, which is most commonly spread by the deer tick, can cause chronic fatigue, pain and other nervous system disorders if not effectively treated early on. Unfortunately, signs of the disease are not always easily seen soon after a tick bite and the disease can virtually destroy the quality of a person’s life.

Lyme disease has reached epidemic levels in New Jersey. The Center of Disease Control reported New Jersey had around 4,600 new cases in 2009 alone. While the number of people in the state contracting Lyme disease dropped since then, people are now starting to becoming infected in urban areas. Thus, public health officials must consider the potential impact of all policies on this epidemic.

People are far more likely to contract Lyme disease in areas with large populations of small mammals. While most people believe deer are responsible for Lyme disease, a recent study suggests the white footed mouse, eastern chipmunk and two species of shrews are the culprits. Specifically, the deer tick catches Lyme disease from these small mammals rather than deer. Thus, large numbers of these small mammals result in more infected ticks that can transmit Lyme disease to people.

New research suggests Lyme disease is far more common in areas where few natural predators exist. Scientists at the Cary Institute of New York found wooded patches of 3 acres or less, which are common in suburban areas like South Orange, contain 3 times as many deer ticks as larger more pristine wooded areas. Furthermore, 80% of the deer ticks carry Lyme disease in these small wooded lots and these ticks are 7 times more likely to harbor the disease than ticks in larger wooded tracts. In addition, other emerging tick-borne diseases, such as Babesiosis, Anaplasmosis and Powassan encephalitis, may also be more common in these wooded areas.

The high incidence of Lyme disease infected ticks coincides with larger populations of small mammals commonly found near residential areas. In smaller wooded tracts, ecological diversity decreases as competing species find it difficult to find enough resources to survive. Furthermore, predators of these species are less common due to altered habitats and threats from people.

The South Orange Board of Health’s desire to eradicate outdoor cats may have the unintended consequence of increasing Lyme disease rates. Cats are essentially the only predator of small mammals in the very small wooded lots harboring Lyme disease close to where humans live. Despite the hype about cats decimating songbird populations, cats mostly prey on small mammals. For example, the study conducted in Albany, New York cited above found 86% of cat prey were small mammals, most of which were mice. While scientists would need to conduct extensive scientific studies to determine if differing cat population numbers impact Lyme disease rates in people, logic would suggest eliminating cats could only cause more humans to contract Lyme disease or have no effect. In addition, fewer cats could result in more instances of other diseases carried by rodents, such as Hantavirus, Bubonic plague and Salmonellosis. Thus, the South Orange Board of Health may exchange eliminating non-existent health risks (i.e. rabies, toxoplasmosis, etc.) for increasing the chance of residents contracting other serious chronic diseases.

Furthermore, the South Orange Board of Health ignores the emotional distress killing massive numbers of cats has on animal loving residents. Given excessive stress has a tremendous negative impact on all aspects of one’s physical health, one has to wonder if the South Orange Board of Health considered this factor.

TNR Will Alleviate the Very Issues Raised by the South Orange Board of Health

In reality, TNR will achieve the very goals the Board of Health seeks to achieve. While I do believe we very much need cats to maintain a healthy balance in our human altered ecosystems, a large scale and well-run TNR program will more effectively reduce cat populations and limit cat ecological impacts than trap and kill policies. In a recent computer modeling study taking into account cats both migrating in and out of colonies, the authors found, in contrast to the South Orange Board of Health’s claim that all feral cats must be spayed/neutered to reduce the feral cat population, TNR programs only need to sterilize 30% of the reproductively active feral cat population to decrease colony size over the long term. While catching and killing would only require removing 20% of the reproductively active feral cat population, such efforts are much more difficult as few in the community would help trap or donate money to catch and kill cats. Additionally, the study found focusing sterilization efforts on females, if say financial resources are limited, could decrease the population with a lower sterilization rate. Unsurprisingly, despite the South Orange Board of Health’s assertion that TNR does not reduce community cat populations, multiple studies found TNR programs reduced feral cat populations. As a result, large scale and well-run TNR programs certainly can decrease the size of feral cat populations.

TNR also limits cat predation, roaming and nuisance behaviors. Specifically, altering the animals, particularly males, reduces roaming and the loud noises associated with fights males have over females. In addition, regular feeding reduces the distance feral cats range in search of food and decreases their desire to hunt. As a comparison, catch and kill policies do not remove enough cats to reduce the feral cat population and those cats are more likely to roam further, hunt more, and make loud noises fighting over mates. In addition, well-run large scale TNR programs have active conflict resolution procedures, often times performed by volunteers, to reduce nuisance complaints. Thus, TNR is a no-brainer based on the very claims the South Orange Board of Health makes.

South Orange Board of Health Proposes More Polices to Kill Even More Cats at Taxpayer Expense

The South Orange Board of Health proposed the following polices that will result in impounding and killing more cats:

1) Mandatory licensing and microchipping for all cats

2) Increase enforcement of public pet limit and cat feeding ban laws

3) “Educate” people on the dangers of outdoor cats

In a bizarre statement, one Board of Health member stated the town’s Animal Control Officer would go door to door to force residents to get their cat licensed and presumably give people a choice – kill or license your cat. That sure sounds like a wonderful way to educate people about an issue – threaten to kill their cat and then tell them that their beloved family member is a filthy disease carrying animal that should never leave their home unless the cat is on a leash or in a maximum security prison like enclousure. In addition, to reach a significant number of homes, South Orange taxpayers will have to pay for more ACOs or accept slower response times from their existing ACO. Additionally, the South Orange Board of Health’s trap and kill policy will lead to increased animal control costs due to the impounding of more unadoptable cats. Thus, the South Orange Board of Health’s proposed policy will be ineffective and costly to South Orange’s taxpayers.

South Orange Residents and Animal Loving People from Elsewhere Must Make Their Voices Heard 

The South Orange Board of Health will hold a meeting on their anti-community cat policies on September 17 at 7:30 PM in the South Orange Performing Arts Center (1 SOPAC Way, South Orange, NJ 07079). All animal loving people should attend this meeting and make the case for TNR in an intelligent and fact based manner.

As a back-up strategy, people should lobby the South Orange Village Council to not reappoint Board of Health members opposing TNR and also provide pro-TNR replacement Board of Health members. Four of the seven members terms expire within the next year. Simply put, if the South Orange Board of Health insists on killing massive numbers of cats at taxpayer expense, these people must go.

References

Rabies Vaccination Duration Research:

http://healthypets.mercola.com/sites/healthypets/archive/2011/06/21/expert-proof-most-pets-are-vaccinated-way-too-often.aspx

Other Domestic Animal Vaccine Protection Period:

http://www.rabieschallengefund.org/education/age-and-long-term-protective-immunity-in-dogs-and-cats

Rabies Animal Cases in New Jersey:

Click to access rabcases2014.pdf

Feral Cat Disease Risks to Humans:

http://www.alleycat.org/FeralCatHealth

Owned Cat Roaming Study on the Island of Corvo:

Hervías, S., Oppel, S., Medina, F. M., Pipa, T., Díez, A., Ramos, J. A., Ruiz de Ybáñez, R. and Nogales, M. (2014), Assessing the impact of introduced cats on island biodiversity by combining dietary and movement analysis. Journal of Zoology, 292: 39–47. doi: 10.1111/jzo.12082

http://onlinelibrary.wiley.com/doi/10.1111/jzo.12082/abstract

Cat Predation and Roaming Study in Albany, New York:

Kays, R. W. and DeWan, A. A. (2004), Ecological impact of inside/outside house cats around a suburban nature preserve. Animal Conservation, 7: 273–283. doi: 10.1017/S1367943004001489

Click to access 15128.pdf

Cat Roaming Study in Metropolitan Chicago Area:

Gehrt SD, Wilson EC, Brown JL, Anchor C (2013) Population Ecology of Free-Roaming Cats and Interference Competition by Coyotes in Urban Parks. PLoS ONE 8(9): e75718. doi:10.1371/journal.pone.0075718

http://journals.plos.org/plosone/article?id=10.1371/journal.pone.0075718

Cat Roaming Study in 6 State Area:

Roland Kays, Robert Costello, Tavis Forrester, Megan C. Baker, Arielle W. Parsons,Elizabeth L. Kalies, George Hess, Joshua J. Millspaugh, William McShea Journal of Mammalogy Jun 2015, DOI: 10.1093

http://jmammal.oxfordjournals.org/content/early/2015/06/24/jmammal.gyv100.abstract

New Zealand Study Showing Bird Feeding Negatively Impacting Native Birds:

http://conservationmagazine.org/2015/05/beware-of-the-backyard-bird-feeder/

Canadian Study Documenting Increased Bird Collisions into Windows Due to Bird Feeding:

http://birdswindows.biology.ualberta.ca/bird-feeders-and-their-effect-on-bird-window-collisions/

Northern Ireland Study Documenting Negative Impacts to Birds from Bird Feeding:

http://scienceblogs.com/gregladen/2008/04/07/should-you-feed-the-birds/

Macquarie Island Feral Cat Eradication Study Detailing Negative Effects on Native Flora and Fauna:

Bergstrom, D. M., Lucieer, A., Kiefer, K., Wasley, J., Belbin, L., Pedersen, T. K. and Chown, S. L. (2009), Indirect effects of invasive species removal devastate World Heritage Island. Journal of Applied Ecology, 46: 73–81. doi: 10.1111/j.1365-2664.2008.01601.x

Click to access Bergstrom_2009.pdf

New Zealand Study Documenting Feral Cat Elimination Negatively Impacting a Native Bird Species:

Spatial heterogeneity of mesopredator release within an oceanic island system PNAS 2007 104 (52) 2086220865doi:10.1073/pnas.0707414105

Click to access 20862.full.pdf

Study Showing Small Mammal Prey of Cats is Primary Cause for Increase in Lyme Disease:

Deer, predators, and the emergence of Lyme disease PNAS 2012 109 (27) 10942-10947; doi:10.1073/pnas.1204536109

Click to access 10942.full.pdf

Research Reporting Increased Lyme Disease in Small Wooded Areas with Few Natural Predators:

http://www.nsf.gov/news/special_reports/ecoinf/lyme.jsp

Diseases Transmitted to People from Rodents:

http://www.cdc.gov/rodents/diseases/direct.html

Computer Modeling Study Reporting the Percentage of Sterlized Feral Cats Needed to Reduce the Population:

Simulating Free-Roaming Cat Population Management Options in Open Demographic Environments. PLoS ONE 10(3): e0119390. doi: 10.1371/journal.pone.0119390

http://journals.plos.org/plosone/article?id=10.1371/journal.pone.0113553

Cat Report Cards for New Jersey Animal Shelters

Cats are losing their lives at an alarming rate in New Jersey animal shelters. Approximately 23,000-24,000 cats or nearly half of the cats coming into New Jersey animal shelters in 2013 were killed, died or went missing. This blog explores the reasons why this tragedy is occurring and whether we can end the massacre. Additionally, I’ll try and answer the question whether shelters need to resort to neutering and releasing healthy friendly cats or not impounding these cats at all to avoid killing cats in shelters.

Model Assesses New Jersey Animal Shelters’ Life Saving Performance

In order to assess how good of a job New Jersey animal shelters are doing, I’ve developed an analysis I call the “Life Saving Model.” While shelter performance is dependent on many variables, such as finances, facility design, local laws, etc., the most critical factor impacting potential life saving is physical space. As a result, my analysis focuses on making the best use of space to save the maximum number of New Jersey cats.

The Life Saving Model measures the number of local animals a shelter should adopt out, rescue from other facilities, send to rescues or other shelters and euthanize to achieve no kill level save rates. The targeted outcomes take into account each facility’s physical capacity and the number of cats the organization receives from its community (i.e. strays, owner surrenders, cruelty cases). I assume a target euthanasia rate, take the number of cats actually returned to owners and then estimate how many community cats a shelter should adopt out. To the extent space runs out, I then calculate how many cats must be sent to rescue. If the shelter has excess space after properly serving its local community, the facility uses that room to rescue and adopt out cats from nearby areas. The targeted results calculated from this model are compared to the actual results from each shelter below.

The Life Saving Model requires a more complex analysis for cats than dogs in New Jersey. Generally speaking, New Jersey animal shelters receive few litters of young puppies who are vulnerable to disease. On the other hand, local shelters receive lots of young kittens, particularly during the April to October kitten season. These young kittens are highly vulnerable to disease and those without mothers require bottle feeding every 1-2 hours. Therefore, these kittens should not be held in a traditional shelter setting and instead need to go to foster homes or a kitten nursery at or outside of the shelter. During the months outside of kitten season (i.e. November – March), my model assumes shelters with enough physical space will be able to place young kittens into their volunteers’ foster homes and/or in a kitten nursery run by the animal shelter. In kitten season with many young animals coming in, I assume a certain percentage of the cat intake will need to go to rescues or other shelters. For shelters who rescue cats, I assume a small percentage of the cats are young kittens who are hopelessly suffering and will require humane euthanasia. Thus, my Life Saving Model is a bit more complicated than the analysis I did for dogs.

To read specific details and assumptions used in the model, please see the Appendix at the end of this blog.

Another complexity in this analysis are feral cats. In an ideal world, shelters would practice trap-neuter-return (TNR) or shelter-neuter-return (SNR) for feral cats only. In TNR, the public or a third party typically does the work and the shelter doesn’t take in feral cats. In the variant of SNR I support, the shelter would take in feral cats, neuter them and release them back to where they were found. Unfortunately, many municipalities prohibit these programs and shelters in these places generally catch and kill feral cats.

Ideally, I would perform two analyses as follows:

  1. Modeling a large scale and targeted TNR program by reducing cat intake at shelters needing to implement TNR or improve their existing TNR programs
  2. Estimating the number of truly feral cats taken in and counting these cats as killed

The first analysis assumes TNR could be implemented and would result in fewer New Jersey cats for shelters to place. In my next blog, I will estimate the impact of a high volume targeted spay/neuter program. Generally speaking, this analysis requires many animal control shelters to adopt out more cats, send fewer cats to rescue, and rescue more cats from other shelters due to the extra shelter space resulting from lower local cat intake. In other words, this analysis would require shelters to achieve higher performance targets.

The second analysis assumes local laws cannot be changed and shelters are stuck receiving unadoptable feral cats. Unfortunately, I do not have the data to calculate the percentage of truly feral cats received at each New Jersey animal shelter. Based on an analysis of Michigan animal shelter data, Nathan Winograd estimated at least 6% of cat intake at Michigan animal shelters are truly feral cats. Similarly, Wisconsin’s Clark County Humane Society 2014 cat statistics show feral cats who were trapped, vaccinated and returned to the community made up 7% of cat outcomes. Based on these numbers and the success of barn cat programs in Pflugerville, Texas and the Maryville, Tennessee area, barn cat programs should be able to save most feral cats in similar communities. On the other hand, California’s Orange County Animal Care reported approximately 24% of the cats it took in during 2012, which was before it practiced TNR, were feral and euthanized. However, I suspect at least some of these cats were fearful rather than truly feral and could have been socialized and eventually adopted out.

My model assumes shelters are doing the proper thing and practicing TNR and placing the reasonable number of feral cats received as barn cats. Obviously, many shelters do take in a good number of feral cats due to poor laws or misguided policies. As a result, the number of New Jersey cats killed may be higher than my model predicts for some shelters.

My model’s results using total cat intake rather than assuming a larger percentage of feral cats will not be too much different for the targeted adoption and euthanasia rate metrics. The Life Saving Model assumes euthanized cats stay at shelters for 8 days (i.e. euthanized immediately after the 7 day hold period). Many shelters will have a lot of extra space free up if more cats are feral and killed since the net impact will be moving local cats from adopted (assumed length of stay of 42 days) to killed (assumed length of stay of only 8 days). This creates extra space that my model assumes shelters use to rescue and adopt out cats from other places. For example, if I assume New Jersey animal shelters have a local cat kill rate of 30% as opposed to 8% due to more feral cats, total cat adoptions (New Jersey plus other states) will only be 2% lower and the kill rate would only rise from 7% to 16% for the New Jersey shelter system. A few space constrained shelters with high feral cat intake would have a significant increase in the targeted number of cats euthanized and a decrease in cats needing rescue due to cats moving from sent to rescue (assumed length of stay of 8 days) to euthanized (assumed length of stay of 8 days). However, on a statewide basis, shelters with excess capacity would partially offset this increase in the kill rate by rescuing and adopting out cats from shelters outside of New Jersey. Thus, the difference between my model’s assumed and actual feral cat intake will not have too much of an impact on the targeted cat adoption number and kill rate.

The following analysis assumes shelters receive a reasonable number of truly feral cats. As a result, shelters can adopt out these cats through a barn cat program. While I realize some shelters do receive greater numbers of truly feral cats, the purpose of this analysis is to examine whether New Jersey animal shelters can handle the number of cats received.

New Jersey Animal Shelters Contain Enough Space to Save Most of New Jersey’s Healthy and Treatable Cats and Many More from Other States

New Jersey’s animal shelter system has enough space to save most of the state’s healthy and treatable cats. The table below details the targeted numbers of cat outcomes the New Jersey animal shelter system should achieve. Out of the 49,163 New Jersey cats coming into the state’s animal shelters in 2013, 31,641 and 12,195 cats should have been adopted out and sent to other shelters/rescues by the facilities originally taking the cats in. However, other New Jersey animal shelters had enough capacity to rescue 37,736 cats or three times the number of cats needing rescue from space constrained facilities. Unfortunately, some of the cats needing rescue, such as very young kittens, should not go to a shelter and still must go to either a kitten nursery or foster homes. That being said, many adult cats are in fact killed in New Jersey animal shelters and many facilities with excess space could save these cats.

New Jersey animal shelters have enough excess space to save many cats from out of state as well. Specifically, New Jersey animal shelters had enough physical capacity to rescue and adopt out at least 25,541 cats from out of state shelters or New Jersey’s streets after achieving a greater than 90% live release rate for cats coming into the state’s animal shelters. In reality, the New Jersey shelter system could rescue more than 25,541 cats from out of state shelters or from New Jersey’s streets given the 25,541 figure assumes all cats needing rescue from space constrained New Jersey shelters are sent to other New Jersey shelters as opposed to rescue groups. As explained above, some of the cats needing rescue from New Jersey shelters with a shortage of space are young kittens which should not go into most animal shelters. To put this number into perspective, New Jersey animal shelters contain enough space to make both New York City and Philadelphia no kill cities for cats and increase those cities’ cat live release rates to 92% as follows (per 2014 data):

  • New York City – 2,366 additional cats need saving
  • Philadelphia – 6,171 additional cats need saving

Certainly, some New Jersey animal shelters do pull some cats from New York City and Philadelphia animal control shelters. Even if I assumed all of the out of state cats rescued by New Jersey animal shelters came from New York City and Philadelphia, that number is only 8% of the number that New Jersey shelters could rescue from New York City and Philadelphia animal control shelters. While some of these cats from New York City and Philadelphia animal control shelters are young kittens which should not go into a normal animal shelter, many other cats could go to New Jersey animal shelters and be adopted out. As a result, the additional number of cats New Jersey animal shelters could save from New York City and Philadelphia is not much lower than the figures above. Thus, New Jersey animal shelters could make New Jersey a no kill state for cats and help other states reach that goal as well.

These adoption goals are quite achievable when comparing the performance of well-run animal control shelters across the country. New Jersey animal shelters would only need to adopt out 7.6 cats per 1,000 people in the state (4.9 cats per 1,000 people if no cats rescued from out of state and all rescued cats were rescued by other New Jersey animal shelters and adopted out). As a comparison, recent per capita cat adoption numbers from several high performing no kill open admission shelters are as follows:

  • Charlottesville-Albemarle SPCA (Charlottesville, Virginia area) – 14.2 cats per 1,000 people
  • Nevada Humane Society (Reno, Nevada area) – 9.9 cats per 1,000 people
  • Williamson County Animal Shelter (Williamson County, Texas area): 9.5 cats per 1,000 people
  • Longmont Humane Society (Longmont, Colorado area) – 8.2 cats per 1,000 people

Thus, many communities are already adopting out significantly more cats than the number I target for New Jersey animal shelters.

Additionally, the adoption target, 7.6 cats per 1,000 people, I set out for New Jersey animal shelters is only slightly higher than the state of Colorado’s per capita cat adoption rate of 6.5 cats per 1,000 people. Given Colorado still has some regressive animal shelters and only a 79% live release rate for cats, Colorado’s per capita cat adoption rate can increase. Thus, the cat adoption targets I laid out for New Jersey animal shelters are quite achievable.

Summary

Cat Deaths Vary Widely at New Jersey Animal Shelters

The goal of any properly managed animal shelter is to save all of its healthy and treatable animals. In some cases, such as selective admission rescue oriented shelters, it is pretty easy to not kill animals. In addition, other animal shelters with easy to service animal control contracts (i.e. few animals impounded) can avoid unnecessary killing due to having lots of extra space. As a result, some shelters may have an easier time than others in preventing killing at their shelters.

The table below compares the targeted and actual number of cats euthanized/killed, and who died or went missing. In order to better compare the targeted and actual numbers, I only calculated the target number (8% euthanasia/death rate) based on the number of cat outcomes at each shelter. The Life Saving Model also targets a 5% euthanasia rate for additional cats rescued, but this would overstate the total targeted number of cats euthanized in this comparison. In other words, the targeted number of euthanized cats would be higher due to more cats being rescued as opposed to having a high kill rate. All cats missing are assumed “dead” based on the assumption they died or went to a very bad place. Shelters having less and more than the targeted amount of cat deaths are highlighted in green and red in the table below.

The overall results show too many cats are unnecessarily losing their lives at New Jersey animal shelters. Based on the assumptions above, 18,877 savable cats lost their lives or went missing at New Jersey animal shelters in 2013. If I only count shelters where actual deaths exceeded the targeted deaths, the number of savable cats who lost their lives rises to 19,078. Obviously, some of these cats are truly feral who require TNR or placement as barn cats, but surely many others could be adopted out. Thus, New Jersey’s shelter system is failing its cats.

Several animal shelters in South Jersey and elsewhere account for a large percentage of the savable cats unnecessarily losing their lives. Specifically, Atlantic County Animal Shelter, Burlington County Animal Shelter, Camden County Animal Shelter, Cumberland County Animal Shelter and Gloucester County Animal Shelter account for 9,707 of the or 51% of the 19,078 cats needlessly losing their lives. Associated Humane Societies three shelters had 2,059 cats unnecessarily lose their lives. Northern Ocean County Animal Facility and Southern Ocean Animal Facility had 1,594 cats lose their lives needlessly in 2013. Bergen County Animal Shelter, which happens to serve many towns in one of the country’s wealthiest counties, had 649 cats unnecessarily lose their lives in 2013. Collectively, these 11 shelters are 11% of the state’s shelters and account for 14,009 or 73% of the cats needlessly losing their lives.

Rescue oriented shelters generally had fewer cats lose their lives than targeted. While saving large numbers of cats is what we all want, some of these shelters may have achieved this result by taking in easier cats. Austin Pets Alive, which is a rescue oriented shelter in Texas, has developed some of the most innovative cat programs and only had a cat live release rate of 93% in 2013. This was due to Austin Pets Alive taking in many cats requiring significant treatment, such as neonatal kittens, from the city animal control shelter. As a result, some of the rescue oriented shelters with significantly fewer cats euthanized than targeted may have avoided taking in many of the more difficult cases.

Several animal control shelters euthanized fewer cats than the number targeted. Denville Animal Shelter, Ewing Animal Shelter, Byram Township Animal Shelter and Wayne Animal Shelter prove municipal animal shelters can avoid killing healthy and treatable cats. Furthermore, Perth Amboy Animal Shelter shows even a poorly funded shelter serving an area with a high poverty rate can avoid killing healthy and treatable cats. Mercerville Animal Hospital, which only reported data from 2012, also euthanized far fewer cats than targeted at its shelter. This shelter had an animal control contract for the first seven months of the year. While St. Huberts – Madison outperformed its targeted euthanasia number, St. Huberts – North Branch underperformed by a greater amount. Humane Society of Ocean County also euthanized far fewer cats than targeted. While Jersey Animal Coalition and John Bukowski Animal Shelter (Bloomfield) reported fewer than targeted cats losing their lives, I do not trust these organizations numbers due to the turmoil at these shelters during this time.

Euthana

Euthana (2)

Euthana (3)

Space Constrained Facilities Not Receiving Enough Support from Rescues and Other Animal Shelters

Some animal shelters will require more support from rescues and animal shelters with excess space than others. If a shelter has relatively high intake and very limited space, it will need more help than other shelters. While sending animals to rescues is a good thing, we do want shelters most needing rescue support to receive that help given rescues have limited resources. The table below compares the number of cats a shelter should transfer to other organizations per the model and the number of cats actually sent to other animal welfare groups. Shelters marked in green are receiving less than the expected rescue support while facilities marked in red are receiving too much rescue help.

Overall, New Jersey shelters are not receiving enough help from other animal welfare organizations. While the overall number of cats rescued was about 37% of the amount needed for the state as a whole, the actual number was 28% since many cats were rescued from facilities which did not require so much rescue assistance. Only 18 out of the 84 facilities received the required rescue support. In other words, only 21% of the animal shelters needing rescue support received the amount these facilities require.

We truly need to understand the reasons for this rescue shortfall. While poor data collection (i.e. shelters classifying rescues as adoptions) may explain part of this rescue deficit, the large size of this number points to other causes as well. For example, New Jersey shelters received 89% of their dog rescue needs, but only 37% of their cat rescue requirements. Certainly, some of these cats are feral and not candidates for most rescues. However, many other cats surely are home-able. Many high kill facilities may not reach out to rescues for cats, such as during kitten season, as much as they do for dogs. This data supports the need for the Companion Animal Protection Act (“CAPA”), which requires shelters to contact rescues and other facilities at least two business days before killing animals. On the other hand, shelters with excess capacity may not be doing their part to save cats from space constrained facilities.

Several shelters received too much rescue help. Rescues may want to help these organizations due to rescue friendly policies. Alternatively, these shelters may be relying too heavily on rescues to save their animals. Shelters receiving the most extra rescue help were as follows:

  • Toms River Animal Facility – 327 more cats transferred than necessary
  • Cape May County Animal Shelter – 201 more cats transferred than necessary
  • Passaic Animal Shelter – 106 more cats transferred than necessary
  • Paterson Animal Control – 88 more cats transferred than necessary (estimated due to the shelter’s incorrect reporting of rescues as adoptions)

While Cape May County Animal Shelter is known as a progressive shelter, the other facilities are not good in my opinion. Local activists have campaigned to remove Toms River Animal Facility’s Shelter Director, Jim Bowen. Passaic Animal Shelter has no volunteer program or even a social media page. Paterson Animal Control also has no volunteer program, no social media page or even a website with animals for adoption. Thus, many shelters receiving greater than expected rescue support seem to do little more than allow rescues to save the day.

On the other hand, many space constrained shelters received far less rescue help than needed. Facilities receiving the lowest amount of rescue support in relation to their needs were as follows:

  • Camden County Animal Shelter – 1,875 fewer cats transferred than necessary
  • Gloucester County Animal Shelter – 1,499 fewer cats transferred than necessary
  • Atlantic County Animal Shelter – 1,437 fewer cats transferred than necessary
  • Vorhees Animal Orphanage – 470 fewer cats transferred than necessary
  • Northern Ocean Animal Facility – 427 fewer cats transferred than necessary

The million dollar question is why do these shelters receive very little rescue help? As you will see below, Vorhees Animal Orphanage adopts out many cats and is doing a good job. On the other hand, Gloucester County Animal Shelter pursues an aggressive catch and kill policy for feral cats and allegedly killed kittens within 3 days of arriving at the shelter per this letter to a local newspaper. Northern Ocean Animal Facility failed to send even a single cat to a rescue which indicates either poor rescue outreach or an error in its reported numbers. As a result, shelters receiving too little rescue help may or may not be doing their part to get that assistance.

Rescue groups and shelters with extra space should pull cats from kill shelters with the highest rescue “target” numbers and deficits in the table below. One exception is Associated Humane Societies – Newark given Associated Humane Societies two other facilities have more than enough room to help the Newark location. If shelters not needing rescue support get that extra help, these shelters will not take the steps necessary to properly run their facilities. As a result of enabling poorly performing shelters and not pulling cats from truly space constrained facilities, rescuing cats from shelters with enough space leads to less lifesaving.

Shelters receiving less than needed rescue support should also examine their own policies and performance. Are the shelter’s operating processes allowing too many animals to get sick and therefore discouraging organizations to rescue their animals due to subsequent medical costs? Does the shelter actively reach out to rescues/other shelters and treat them with respect? Does the shelter make it convenient for other organizations to pull their animals?

Given killing animals for space is intolerable, the space-constrained shelters need to expand their effective cat capacity. These facilities could use extra space in their buildings to house cats on a short-term basis. These shelters can enter into arrangements with local veterinarians and local pet stores to house and adopt out some cats. Furthermore, shelters can create or expand foster programs to increase the number of cats cared for. Additionally, creating a pet owner surrender prevention program and an appointment system for owners willing to delay surrendering their cats could free up space in these shelters. Finally, space-constrained shelters with multiple animal control contracts should terminate some of these arrangements to bring their capacity for care in line with the number of cats they take in. As a result, space constrained shelters still need to take active steps to reduce killing rather than simply solely relying on rescue support.

stre

Rs (2)

stre (3)

Most New Jersey Animal Shelters Fail to Come Close to Reaching Their Cat Adoption Potential

We can assess each shelter’s contribution to making New Jersey and nearby areas no kill. While a shelter may be able to avoid killing healthy and treatable animals, it still may not live up to its potential for adopting out cats. On the other hand, a space constrained shelter may kill healthy and treatable cats, but still do a good job adopting animals out.

The table below compares the number of cats from New Jersey and nearby states each animal shelter should adopt out with the estimated number of cats actually adopted out.

High kill shelters with very limited space as well as rescue oriented organizations may look better than they actually are. For example, the model assumes the mix of cats facilities are adopting out are the same as the types of cats these groups take in. However, if these shelters only adopt out a very small number of cats due to limited physical capacity, the cats adopted out may be highly adoptable ones with much shorter lengths of stay compared to the majority of cats these facilities impound. Similarly, many rescue oriented shelters likely pull much easier to adopt cats than the bulk of cats needing to get rescued from local facilities. Thus, the results from shelters with very limited capacity and rescue oriented organizations may look better than they actually are.

Few organizations reached or exceeded their adoption targets. Specifically, only 6 out of 101 shelters met the cat adoption goals computed by the Life Saving Model. Thus, the overwhelming number of New Jersey animal shelters need to step up their adoption efforts.

Two rescue oriented shelters exceeded their adoption targets. Animal Welfare Association had the most impressive results by far. This facility adopted out nearly 3 times the number of cats targeted by the Life Saving Model. Based on the the types of cats currently available for adoption and the cat death rate of 11%, Animal Welfare Association does not seem to just take in highly sought after cats. Animal Welfare Association has reasonable normal adoption fees of $95 for kittens and $65 for adult cats, but runs reduced and no adoption fee promotions as well. Animal Welfare Association also waives fees for certain cats who may take longer to adopt out, such as cats who are older or have behavioral or health issues. Furthermore, the shelter’s “Best Friends” program allows people who adopt a cat to pay just $25 for a second cat who is 1 year or older. Additionally, Animal Welfare Association uses an open adoption process focused on properly matching animals and people rather than an overly judgmental procedure based on black and white rules. To aid its open adoptions process, Animal Welfare Association uses the ASPCA’s Feline-ality program. Animal Welfare Association’s adoption rate increased by 20% and its cat length of stay decreased by 23 days after the shelter implemented the Feline-ality program. Finally, Animal Welfare Association installed perches in their cat enclosures to provide cats more vertical space which keeps the cats happier and more adoptable. Animal Rescue Force also exceeded its adoption targets and a key part of its success is using three different adoption sites, two of which are not in a traditional setting. Thus, Animal Welfare Association and Animal Rescue Force used a variety of strategies to exceed their cat adoption targets.

Several animal control shelters also exceeded their adoption targets. Camden County Animal Shelter adopted out more animals than expected. This shelter’s normal cat adoption fees are reasonable and the organization also uses four different Petsmart locations and one Petco store to adopt out cats. However, the shelter can likely further increase its cat adoptions if it abandons its cumbersome adoption process and uses an open adoptions process like Animal Welfare Association’s Feline-ality program. Vorhees Animal Orphanage also exceeded its adoption goal. Vorhees Animal Orphanage’s operating hours include weekday evenings and weekends which allows working people to adopt. This shelter’s normal adoption fees are quite reasonable. For example, cats at the shelter for 6 months or longer are $30, senior cats are $50, adult cats are $65, kittens are $100 and both senior citizens and military personnel receive a 25% discount on adoption fees. Additionally, Vorhees Animal Orphanage adopts cats out at one Petco store and two PetValu locations. Mercerville Animal Hospital also exceeded its adoption target in 2012 (no statistics reported in 2013) and had an animal control contract for the first seven months of the year. A rescue group, Animals in Distress, runs the adoption program. The shelter has a reasonable $75 adoption fee, which includes testing for Feline leukemia and immunodeficiency virus (“FIV”). Additionally, the shelter adopts animals out during weekday evenings which is convenient for working people and the cats are kept in an environment which provides lots of stimulation. Harmony Animal Hospital also exceeded its adoption target and charges no adoption fee. Thus, several animal control shelters exceeded their cat adoption goals and therefore prove these adoption targets are achievable.

Rescues should focus on pulling animals from Camden County Animal Shelter and Vorhees Animal Orphanage. Both these shelters have high cat death rates and their need for rescues greatly exceeds the amount of animals actually pulled from these organizations. While some of these cats may be feral and therefore not adoptable, many other cats surely could be rescued from the two shelters. Given these shelters are adopting animals out at a good rate, rescues and other other shelters should help these facilities out by pulling more cats from Camden County Animal Shelter and Vorhees Animal Orphanage.

Some municipal animal control shelters may be doing a better job with cats than the numbers below indicate. In some cases, municipalities may frown on government run shelters using taxpayer funds to rescue cats from elsewhere. For example, Perth Amboy Animal Shelter had a significant adoption shortfall, but only used a small percentage of its cat capacity. In other words, it is quite likely this shelter adopted out its cats quite quickly, but failed to meet its adoption target due to not using enough of its space. This shelter saved 93% of its cats compared to the previous shelter management’s reported live release rate of just 42%. Similarly, this shelter adopted out more than 10 times as many cats in 2013 than the previous management did a few years before. My suggestion to shelters like Perth Amboy Animal Shelter is to find ways to use more of your facility’s capacity to expand your lifesaving work to other areas. For example, these shelters should consider taking in animals from other shelters for a fee or even contracting with other municipalities.

Many shelters with the ability to help other local shelters fail to do so. New Jersey animal shelters have the potential to rescue and adopt out more than 3.5 times as many cats as the number of cats unnecessarily dying in the state’s animal shelters. Approximately 20-50% (depending on how capacity used for the year is estimated) of the adoption shortfall is due to shelters not using their existing capacity to adopt out their own cats or rescue cats from space constrained nearby facilities. The other 50-80% of the adoption shortfall is due to shelters not adopting out animals as quickly as these organizations should. Thus, New Jersey animal shelters fail to even come close to their adoption potential.

Associated Humane Societies performance is particularly disappointing. Specifically, Associated Humane Societies has the physical capacity to significantly reduce the killing of healthy and treatable cats. Associated Humane Societies adoption shortfall of 6,555 cats is 34% of the 19,078 cats unnecessarily losing their lives in New Jersey animal shelters. Associated Humane Societies has the funding to reach these adoption targets as the organization took in over $8 million of revenue last year. This works out to nearly $500 of revenue per dog and cat I project the shelter should take in per my Life Saving Model. As a comparison, Nevada Humane Society, KC Pet Project, and Upper Peninsula Animal Welfare Society, which are no kill open admission shelters, took in only $254-$415 of revenue per dog and cat. Activists wanting to increase life saving in New Jersey should focus on changing Associated Humane Societies’ policies given the lifesaving potential of this organization.

Several other shelters had significant adoption shortfalls. Bergen County Animal Shelter’s adoption shortfall of 1,929 cats is quite disappointing. Bergen County is among the top 1% of the nation’s wealthiest counties and received $430 of funding per dog and cat I project the shelter should take in based on direct support from Bergen County. If the revenue from the local charity that helps the shelter is counted, the funding increases to $483 per dog and cat the shelter should take in. Helmetta Regional Animal Shelter’s and Montclair Township Animal Shelter’s adoption shortfalls of 2,084 and 1,323 cats are not surprising given the widely documented problems at these facilities during this time. Cumberland County SPCA’s adoption shortfall of 2,045 cats is consistent with its overly restrictive adoption process. Thus, many shelters with the ability to adopt out many cats are failing to do so.

cat adoption

cat adoption (2)

cata adoption 3 (3)

Shelters Fail to Use Excess Space to Save Cats

To further examine New Jersey animal shelters’ performance in saving homeless cats, I compared the targeted number of cats each shelter should pull from nearby shelters to the number actually rescued from local facilities. I assume all cats rescued from out of state came from nearby areas, such as Philadelphia and New York City. While some of the out of state rescued cats may have comes from far away areas, I believe this is a small number and does not significantly impact the results.

Virtually all New Jersey animal shelters are failing to rescue the number of cats they should. 98 of the 102 shelters should rescue some cats from other local shelters. In fact, 64 of the 98 shelters with targeted excess capacity failed to rescue even a single cat from other animal shelters. Of the 98 shelters with the space to rescue cats from nearby shelters, only Animal Welfare Association met or exceeded its cat rescue target. Thus, nearly all New Jersey animal shelters with targeted excess capacity are failing to do their share in ending the killing of healthy and treatable cats.

Rescues cats

Rescues cats (2)

Rescues cats (3)

TNR Is Essential, But Should Not Be An Excuse to Do Nothing

TNR must be instituted to end the killing of healthy and treatable cats. While many shelters may potentially come close to or reach a 90% live release rate, feral cats may still be killed. Simply put, New Jersey cannot become a no kill state without TNR becoming the law of the land. The Companion Animal Protection Act (“CAPA”) prevents shelters and municipalities from taking actions to hinder TNR, such as banning feral cat colony caretakers from feeding cats and lending traps out to the public for catching and killing feral cats. Even without an explicit law allowing TNR, the New Jersey Department of Health should encourage municipalities to implement TNR by changing its neutral stance on TNR to an endorsement of the practice. Furthermore, shelters, especially private facilities with animal control contracts, should refuse to take feral cats from places where TNR is prohibited and the shelter cannot place these feral cats as barn cats or send these animals to reputable sanctuaries per recommendations of many national animal welfare groups.

Shelters should not use anti-feral cat laws as an excuse for failing to institute innovative programs. Too many times shelters blame anti-feral cat ordinances for their outrageously high cat kill rates. However, my analysis proves cats are not dying in New Jersey’s shelter system due to too many cats coming into the state’s shelter system. While TNR certainly would reduce cat intake and make saving lives easier, our state’s shelter system has more than enough space to handle the number of cats that come in. Shelters need to implement key programs, such as foster care, high volume adoptions, and vaccination upon intake. Additionally, shelters need to stay open weeknights and weekends when working people can adopt. Similarly, shelters should use innovative marketing, customer friendly open adoption processes, multiple off-site adoption locations, and frequent discounted adoption promotions to quickly move cats into good homes. Thus, anti-TNR ordinances do not prevent shelters from implementing other life saving policies.

Shelters Do Not Need to Leave Friendly Cats on the Street

Shelters do not need to neuter and release friendly cats or refuse to take these cats in given enough capacity exists within the New Jersey shelter system. In 2013, a group of animal welfare leaders, which included the Humane Society of the United States (“HSUS”) and the ASPCA, prepared a white paper stating a shelter should not impound cats if those cats or other cats in the shelter would subsequently be killed. The evidence supporting this policy, such as cats being more likely to find homes on the street than in traditional shelters, is quite strong. However, my analysis shows the entire New Jersey shelter system does have enough space to handle friendly cats. While certain shelters are space constrained and could benefit from refusing to admit healthy and friendly cats, other shelters in the state have more than enough capacity to step in and find these cats homes. Thus, New Jersey shelters do not need to resort to refusing to take in friendly cats or neutering and releasing friendly cats to avoid killing cats provided these shelters work together and follow best practices.

Kitten Nurseries and Ringworm Wards Key to Saving Vulnerable Cats

Orphaned kittens are typically automatically killed in traditional animal shelters due to the time commitment required to care for these animals. Unweaned kittens require bottle feeding as frequently as every 1-2 hours. As a result, kittens not placed into foster care are typically killed in most animal shelters.

Kitten nurseries or bottle baby wards radically increase the save rate for orphaned kittens still requiring milk. While foster care and rescue programs can save unweaned kittens, kitten nurseries are more efficient and make the job easier. Austin Animal Services, which is the animal control shelter in Austin, Texas, killed 1,200 plus kittens a year before Austin Pets Alive created a bottle baby program. Volunteers work in two hour shifts to feed and care for the kittens. Additionally, nursing mothers are pulled from the city shelter and used to help nurse highly vulnerable young kittens who are orphaned. Kittens are put on antibiotics and treated for fleas and worms immediately to help prevent complications from transitioning from breast milk to formula. Austin Pets Alive has pulled as many as 2,000 kittens a year from the city shelter and saved nearly 90% of these kittens in recent years through this bottle baby program. Best Friends created a kitten nursery in South Salt Lake City, Utah and saved 1,372 kittens from Salt Lake City area shelters. Similarly, several Jacksonville, Florida animal welfare groups created a nursery program called “Kitten University” which was “on track” to saving 1,400 kittens last year. Thus, kitten nursery programs can save young and vulnerable kittens.

Ringworm ward programs easily save cats with this skin fungus. In traditional animal shelters, cats with ringworm are killed due to the risk that other animals and humans will catch this skin fungus. Austin Pets Alive created a specific “Ringworm Ward” program to treat and adopt out these cats. These cats are treated both topically and orally in an isolated area. After the cats are no longer contagious, the cats are sent to foster homes to complete their treatment and regrow their hair. Austin Pets Alive uses steeply discounted adoption fees of only $15 along with catchy slogans like “Adopt a Fun Guy (Fungi)”, “Lord of the Ringworm”, and “Hairy(less) Potter” to quickly place these cats and open up space for additional cats with ringworm. 100% of cats entering this program are saved. Thus, shelters can save cats with ringworm.

Regional kitten nurseries and ringworm wards are the practical solution to saving these vulnerable cats. Given the New Jersey shelter systems has significant excess capacity to care for cats, certain shelters should convert some of that excess space for use as kitten nurseries and ringworm wards. Creating regional centers to care for unweaned kittens and cats with ringworm would allow the programs to run at a large enough scale to work efficiently. Shelters, such as Associated Humane Societies -Popcorn Park, Monmouth SPCA, and St. Huberts – Madison appear to have the space and financial resources to implement these programs. Furthermore, the Animal Welfare Federation of New Jersey (“AWFNJ”) should take the steps needed to create kitten nurseries and ringworm wards in regional centers throughout the state. Surely, the AWFNJ has the connections to convince key decision makers to implement these programs and obtain any necessary funding. Thus, New Jersey shelter leaders must immediately take the steps needed to save the large numbers of treatable kittens and cats with ringworm in our state’s shelters.

Results Require New Jersey Animal Shelters to Take Action

The findings from this analysis mandate New Jersey animal shelters change their ways. While TNR remains a significant issue, most shelters are clearly not taking steps to save large numbers of healthy and treatable cats. Many shelters are not vaccinating upon intake, charging excessive adoption fees, making it too difficult to adopt, not being open when working people can go to shelters, leaving cat enclosures empty, and not using barn cat, foster care, kitten nursery and ringworm ward programs. Simply put, too many shelters are not doing what it takes to save lives. With nearly half of all cats entering New Jersey’s shelters dying or going missing, our state’s shelters are failing their cats.

New Jersey shelters have a cat crisis and it is time for the killing to stop. We have the information and even the blueprints from numerous communities which stopped killing and started saving their cats. It is time the excuses ended and action begins. The public is fed up with the killing and demands shelters save their animals. Our state’s animal welfare organizations need to get on board the lifesaving wagon or risk getting run over by it. Which will they choose?

Appendix Life Saving Model Assumptions

The Life Saving Model utilizes the following basic animal shelter population equations to calculate the targeted cat outcomes for each facility:

Daily capacity or population = Daily animal intake x average length of stay

Average length of stay = Daily capacity or population/daily intake

Each shelter’s community cat intake (i.e. owner surrenders, strays, cruelty cases), number of cats returned to owners, and maximum cat capacity were taken from its 2013 “Shelter/Pound Annual Report” submitted to the New Jersey Department of Health. 2012 “Shelter/Pound Annual Reports” were used for shelters failing to submit reports in 2013. East Orange Animal Shelter’s 2013 data was obtained from a local news article due to the shelter failing to submit any “Shelter/Pound Annual Reports.” Unfortunately, 2014 data will not be available until Fall 2015.

This data was then used as follows:

  • Community cat intake and cats returned to owners were initially estimated for each month by dividing the annual figures by 12. In order to take into account the extra space in low intake months and reduced space in high intake months, we multiply that number by each month’s percentage of the average month. For example, assume 240 cats were taken in during the year and the average month equals 20 cats (240/12). In July, the cat intake is 120% higher than the average month and we therefore multiply 20 cats by 1.2 to equal 24 cats. If 120 cats were returned to owners during the year, the estimated number of cats returned to owners in July would equal 12 cats (120/12 = 10; 10*1.2). The monthly intake percentages were based off 2013 cat intake data on the New York Animal Care & Control web site.
  • The estimated number of community cats returned to owners each month are then assumed to stay 5 days on average at shelters based on data from other shelters across the country.
  • The number of community cats euthanized (including animals who died or are missing) is set to equal 8% of intake. 8% is a reasonable standard euthanasia rate to use given other open admission animal shelters, such as Austin Animal Services, equal or exceed this target and New Jersey’s much lower per capita cat intake makes it easier to save lives. The average length of stay for euthanized cats is assumed to equal 8 days. I assume these cats have severe and untreatable health issues and are euthanized immediately after their required 7 day hold period.
  • The average length of stay used for adopted community cats was 42 days. This estimate was roughly halfway between the average cat length of stay figures for a number of no kill animal control shelters. For example, the average length of stay for cats in recent years was 14.6 days at Texas’s Williamson County Animal Shelter, less than 18 days at Nevada Humane Society, 21 days at Colorado’s Longmont Humane Society, 33 days (32 for cats and 34 for kittens) at New Hampshire SPCA, 35 days at Montana’s Flathead County Animal Shelter, 41 days at Colorado’s Ark Valley Humane Society, and 61 days for adopted cats only at New York’s Tompkins County SPCA. While the average length of stay of adopted cats at these shelters other than Tompkins County SPCA may have been slightly higher since this data is for all cats and not just those adopted, the difference is not likely significant given adoptions represent most of the outcomes at these shelters. Unfortunately, I was not able to break down the adoption length of stay figures by age or breed for New Jersey’s shelters like I did in my analysis on dogs due to a lack of detailed cat intake data at New Jersey animal shelters. Upon reviewing cats up for adoption at several New Jersey animal control shelters and a few of the high performing facilities above, I did not see any significant differences in types of cats taken in. In the future, I hope to refine this analysis further.
  • The average length of stay used for community cats adopted out from rescue oriented shelters was 30 days. Rescue oriented animal shelters typically carefully select animals taken into their shelters. Based on the San Francisco’s SPCA’s 21 day and Tony La Russa’s Animal Rescue Foundation’s 23 day average length of stay figures reported a number of years ago, I used a shorter length of stay for community cats adopted from New Jersey animal shelters without animal control contracts. I chose 30 days as a conservative estimate.
  • Cats transferred to rescue or other facilities are assumed to stay at shelters 8 days on average based on the assumption strays can’t be released until the 7 day hold period elapses.
  • Community cats not returned to owners or euthanized are initially assumed as adopted for each month outside of kitten season (i.e. November-March). However, if the calculated length of stay exceeds the shelter’s required length of stay, cats are moved from adoption (i.e. with a longer length of stay) to rescue (i.e. shorter length of stay) until the calculated length of stay each month approximately equals the required length of stay.
  • During kitten season (April-October), animal control shelters are assumed to send a certain percentage of cats to rescue even if they have excess space. Due to the large numbers of kittens coming into shelters during these months, I assume shelters will not be able to place all of them into foster homes or a kitten nursery at this time. As a result, I assume animal control shelters will send 10% of their annual community cat intake to rescues based on the shelters’ estimated relative cat intake each month. For example, if a shelter took 100 cats in during the year and August made up 50% of the total cat intake from April to November, 5 cats would go to rescue in August (i.e. 100*10% = 10 cats; 10*50% = 5 cats). I used 10% based off the rescue percentage of cat intake in 2014 at Kansas City’s KC Pet Project. KC Pet Project is a no kill open admission shelter with an inadequate facility and is a good comparison for some of our state’s run down shelters. Shelters requiring rescue support due to space constraints are assumed to send these additional cats to rescues during kittens season.
  • Shelters are not expected to use the excess space created by fosters taking kittens to rescue and adopt out additional cats. This is based on the assumption that the kittens will return to shelters once old enough to safely stay at the facilities.
  • Required length of stay = Shelter’s reported capacity/adjusted daily intake for the month. Adjusted daily intake for month = Adjusted monthly intake per first bullet above/the number of days in the month.
  • Shelters with excess capacity are assumed to use the extra space to rescue and adopt out cats from other New Jersey animal shelters. Given some of these cats will be young and highly vulnerable kittens, I assume 5% of these rescues will be euthanized for humane reasons. I used 5% based off Austin Pets Alive’s and Austin Humane Society’s weighted average cat euthanasia rate in 2013. These two shelters pull many cats from Austin Animal Services, which is the city’s animal control shelter, and their cat euthanasia rate is a reasonable proxy for the percentage of hopelessly suffering cats rescued from animal control shelters. To the extent all healthy and treatable New Jersey animal shelter cats are saved, I assume additional cats are pulled from nearby states. The average length of stay for rescued and adopted cats is the same as the cats taken in by animal control shelters (i.e. 42 days). Similarly, I used 8 days as the average length of stay for rescued and euthanized cats from other shelters.
  • Each month’s targeted outcomes are added to determine how many cats New Jersey animal shelters should adopt out, send to rescue and rescue from other nearby animal shelters.
  • The Life Saving Model assumes shelters can adopt out animals outside their service territory. New Jersey is the most densely populated state in the nation and shelters can easily adopt out cats to people outside their service area. For example, people from outside the service territory of New Jersey shelters adopt animals from these facilities and at off-site adoption locations. Based on this assumption, shelters with a lot of capacity relative to the population in their service area have higher targeted per capita adoption rates (i.e. based on the population in their service area). However, these shelters can easily adopt out animals to people outside the area they take animals from.

New Jersey Animal Shelters’ Report Cards for Dogs

report-card

In my last blog, I disclosed New Jersey’s depressing animal shelter statistics. This blog explains why so many dogs are losing their lives in the state’s animal shelters and whether these facilities can end the killing.

Successful organizations set measurable goals and regularly monitor their performance. Examples include financial budgets, customer and employee satisfaction surveys, and product reliability metrics. Unfortunately, many animal shelters for far too long have failed to set lifesaving goals and standards. Municipalities, donors and volunteers need to know where their resources will be best utilized. Time and money are scarce resources and people should allocate these assets to organizations who will best utilize them. As a result, animal shelters need to set goals and hold their leadership and staff accountable for achieving these objectives.

Model Assesses New Jersey Animal Shelters’ Life Saving Performance

In order to assess how good of a job New Jersey animal shelters are doing, I’ve developed an analysis I call the “Life Saving Model.” While shelter performance is dependent on many variables, such as finances, facility design, local laws, etc., the most critical factor impacting potential life saving is physical space. Without having enough physical space, a shelter might not have enough time to find loving homes for its animals. Shelters can overcome financial limitations through creative fundraising or recruiting more volunteers. Similarly, organizations can save their dogs despite having run down facilities if these groups enthusiastically implement policies to get animals into loving homes quickly. As a result, my analysis focuses on making the best use of space to save the maximum number of New Jersey dogs.

The Life Saving Model measures the number of local animals a shelter should adopt out, rescue from other facilities, send to rescues or other shelters, and euthanize. The targeted outcomes take into account each facility’s physical capacity and the number and types of dogs the organization receives from its community (i.e. strays, owner surrenders, cruelty/bite cases). I assume a target euthanasia rate, take the number of dogs actually returned to owners and then estimate how many community dogs a shelter should adopt out. To the extent space runs out, I then calculate how many dogs must be sent to rescue. If the shelter has excess space after properly serving its local community, the facility uses that room to rescue and adopt out dogs from nearby areas. The targeted results calculated from this model are compared to the actual or estimated actual results from each shelter below.

To read specific details and assumptions used in the model, please see the Appendix at the end of this blog.

New Jersey Animal Shelters Contain Enough Space to Save All of New Jersey’s Dogs and Many More from Other States

New Jersey’s animals shelter system has enough space to save all of the state’s healthy and treatable dogs. The table below details the targeted numbers of dog outcomes the New Jersey animal shelter system should achieve. Out of the 27,929 New Jersey dogs coming into the state’s animal shelters in 2013, 13,714 and 3,317 dogs should have been adopted out and sent to other shelters/rescues by the facilities originally taking the dogs in. However, other New Jersey animal shelters had more than enough capacity to rescue the 3,317 dogs from space constrained facilities. Thus, New Jersey animal shelters should be able to able to adopt out every single healthy and treatable dog taken in from the state and not require any support from rescue organizations without physical facilities.

New Jersey animal shelters have enough excess space to save many dogs from out of state as well. Specifically, New Jersey animal shelters had enough physical capacity to rescue and adopt out 12,352 dogs from out of state after achieving a 95% live release rate for New Jersey dogs. To put this number into perspective, New Jersey animal shelters could make both New York City and Philadelphia no kill cities for dogs and increase those cities’ dog live release rates to 95% as follows:

  • New York City – 1,771 additional dogs need saving
  • Philadelphia – 2,937 additional dogs need saving

Additionally, New Jersey animal shelters could save another 7,644 dogs from other locations outside of the state. Of course, some New Jersey animal shelters do pull some dogs from New York City and Philadelphia animal control shelters. However, most of these dogs are likely easy to adopt and therefore have short lengths of stay. As a result, the additional number of dogs New Jersey animal shelters could save from New York City, Philadelphia and elsewhere is probably not much lower than the figure above. Thus, New Jersey animal shelters could make New Jersey a no kill state for dogs as well as many other places.

These adoption goals are quite achievable when comparing the performance of well-run animal control shelters across the country. New Jersey animal shelters would only need to adopt out 3.30 dogs per 1,000 people in the state (1.91 dogs if no dogs rescued from out of state). As a comparison, recent per capita dog adoption numbers from several high performing no kill open admission shelters are as follows:

  • Nevada Humane Society (Reno, Nevada area) – 8.5 dogs per 1,000 people
  • Charlottesville-Albemarle SPCA (Charlottesville, Virginia area) – 9.0 dogs per 1,000 people
  • Longmont Humane Society (Longmont, Colorado area) – 9.1 dogs per 1,000 people

Thus, many communities are already adopting out nearly three times as many dogs as the goal set for New Jersey animal shelters.

Some naysayers may claim New Jersey would have a more difficult time due to the state’s shelters taking in many pit bulls. However, this is a myth. My model estimates New Jersey animal shelters would need to adopt out roughly 0.70 pit bulls per 1,000 people to save 95% of New Jersey’s dogs. Our shelters would only need to adopt out 1.81 pit bulls per 1,000 people if New Jersey shelters also rescued and adopted out the targeted number of pit bulls from other states. As a comparison, I estimate Longmont Humane Society adopts out 2.14 pit bulls per 1,000 people based on its per capita pit bull intake and the percentage dog adoptions are of total outcomes at the shelter. Furthermore, the pit bull adoption targets are even more reasonable given the model assumes there are roughly 2/3 less dogs to compete with in the adoption market in New Jersey than these other locations.

NJ Shelter Model 2013 (Local Targets 2)

Animal Deaths Vary Widely at New Jersey Animal Shelters

The goal of any properly managed animal shelter is to save all of its healthy and treatable animals. In some cases, such as selective admission rescue oriented shelters, it is pretty easy to not kill animals. In addition, other animal shelters with easy to service animal control contracts (i.e. few animals impounded, most strays quickly returned to owners) can avoid unnecessary killing due to having lots of extra space. As a result, some shelters may have an easier time than others in preventing killing at their shelters.

The table below compares the targeted number of community dogs (strays, owner surrenders, cruelty/bite cases) euthanized and the estimated actual local dogs euthanized/killed, and who died or went missing. Consistent with the Life Saving Model’s assumptions, the estimated actual dogs euthanized/killed/died/missing figure assumes these dogs came from the local community. All dogs missing are assumed “dead” based on the assumption they died or went to a very bad place. Shelters having less and more than the targeted amount of dog deaths are highlighted in green and red in the table below.

Surprisingly, several rescue oriented shelters’ death totals exceeded the targeted numbers. While this number may be higher if some rescued dogs are euthanized/killed (i.e. targeted number assumes no rescued dogs are), this may possibly point to overly strict temperament testing at these facilities. In the case of St. Huberts – Madison, which has a total dog death rate of 4% (i.e. percentage of all dogs taken in and not just community dogs), the total death rate may be artificially depressed by easy to adopt transported dogs. For Humane Society of Atlantic County, which has no animal control contracts, the total dog death rate of 24% is shockingly high for a rescue oriented shelter and raises serious questions about how life and death decisions are made by this organization. Other rescue oriented shelters, such as Ramapo-Bergen Animal Refuge and Common Sense for Animals, have significantly fewer deaths than targeted. The aforementioned shelters take a similar percentage of their dog intake from other shelters:

  • Ramapo-Bergen Animal Refuge – 67%
  • Common Sense for Animals – 63%
  • Humane Society of Atlantic County – 67%
  • St. Huberts – Madison – 69%

Thus, I find it difficult to believe St. Huberts – Madison’s and Humane Society of Atlantic County’s larger than expected number of dogs dying or gone missing is due to them rescuing a large percentage of their dogs from other shelters.

The largest number of dogs unnecessarily dying occurred at a relatively small number of shelters. Specifically, 12 out of 98 or 12% of the shelters accounted for 83% of the 3,603 unnecessary dog deaths. Shelters with the greatest number unnecessary dog deaths are as follows:

  • Associated Humane Societies – Newark (553)
  • Camden County Animal Shelter (386)
  • Cumberland County SPCA (346)
  • Gloucester County Animal Shelter (310)
  • Paterson Animal Control (276)
  • Trenton Animal Shelter (220)

Furthermore, if additional unaccounted for dogs discussed in my previous blog are counted in the death totals, the number of unnecessary dogs deaths rises from 3,603 to 4,731 statewide. Associated Humane Societies – Newark’s number of unnecessary deaths jumps from 553 to 805 dogs assuming these additional unaccounted for dogs died.

NJ Shelter Model 2013 for Blog (kill)

NJ Shelter Model 2013 for Blog (kill) (2)

NJ Shelter Model 2013 for Blog (kill) (3)

Space Constrained Facilities Not Receiving Enough Support from Rescues and Other Animal Shelters

Some animal shelters will require more support from rescues and animal shelters with excess space than others. If a shelter has relatively high intake, very limited space, and few stray dogs returned to owners, it will need more help than other shelters. The table below compares the number of dogs a shelter should transfer to other organizations per the model and the number of dogs actually sent to other animal welfare groups. Shelters marked in green are receiving less than the expected rescue support while facilities marked in red are receiving too much rescue help.

Overall, New Jersey shelters are not receiving enough help from other animal welfare organizations. While the overall number of dogs rescued was only about 11%-12% lower than needed, the actual number was higher since many dogs were rescued from facilities who did not need any rescue assistance. Only 16 out of the 102 facilities require any rescue support. In other words, 86 of the 102 animal shelters in the state should not need rescues or other shelters to pull any dogs. As a result, 1,756 dogs were not rescued from shelters who truly need that support and instead were pulled from shelters not requiring this help.

Shelters hogging up the most rescue resources were as follows:

  • Associated Humane Societies – Newark – 276 more dogs transferred than necessary
  • Burlington County Animal Shelter – 112 more dogs transferred than necessary
  • Humane Society of Atlantic County – 112 more dogs transferred than necessary
  • Cumberland County SPCA – 111 more dogs transferred than necessary

On the other hand, many space constrained shelters received far less rescue help than needed. Facilities who received the lowest amount of rescue support in relation to their needs were as follows:

  • Liberty Humane Society – 377 fewer dogs transferred than necessary
  • Trenton Animal Shelter – 252 fewer dogs transferred than necessary
  • Camden County Animal Shelter – 220 fewer dogs transferred than necessary
  • Elizabeth Animal Shelter – 209 fewer dogs transferred than necessary
  • Paterson Animal Control – 194 fewer dogs transferred than necessary

Unsurprisingly, these shelters had some of the highest dog death rates during the year.

Rescue groups and shelters with extra space should pull dogs from kill shelters with the highest rescue “target” numbers and deficits in the table below. If shelters not needing rescue support get that extra help, these shelters will not take the steps necessary to properly run their facilities. As a result of enabling poorly performing shelters and not pulling dogs from truly space constrained facilities, rescuing dogs from shelters with enough space leads to less lifesaving.

Shelters receiving less than needed rescue support should also examine their own policies and performance. Are the shelter’s operating processes allowing too many animals to get sick and therefore discouraging organizations to rescue their animals due to subsequent medical costs? Does the shelter actively reach out to rescues/other shelters and treat them with respect? Does the shelter make it convenient for other organizations to pull their animals?

Given killing animals for space is intolerable, the space-constrained shelters need to expand their effective dog capacity. These facilities could use extra space in their buildings to house dogs on a short-term basis. These shelters can enter into arrangements with local veterinarians to house and adopt out some dogs. Furthermore, shelters can create or expand foster programs to increase the number of dogs cared for. Additionally, creating a pet owner surrender prevention program and making serious efforts to return lost dogs to owners could free up space in these shelters. Finally, space-constrained shelters with multiple animal control contracts should terminate some of these arrangements to bring their capacity for care in line with the number of dogs they take in. As a result, space constrained shelters still need to take active steps to reduce killing rather than simply solely relying on rescue support.

NJ Shelter Model 2013 for Blog (killed)

NJ Shelter Model 2013 for Blog (killed) (2)

NJ Shelter Model 2013 for Blog (killed) (3)

Most New Jersey Animal Shelters Fail to Come Close to Reaching Their Local Dog Adoption Potential

We can assess each shelter’s contribution to making New Jersey and nearby areas no kill. While a shelter may be able to avoid killing healthy and treatable animals, it still may not live up to its potential for adopting out local dogs. On the other hand, a space constrained shelter may kill healthy and treatable dogs, but still do a good job adopting animals out.

The table below compares the number of dogs from New Jersey and nearby states each animal shelter should adopt out with the estimated number of local dogs actually adopted out.

Shelters with very limited space and high kill rates as well as rescue oriented organizations may look better than they actually are. For example, the model assumes the mix of dogs facilities are adopting out are the same as the types of dogs these groups take in. However, if these shelters only adopt out a very small number of dogs due to limited physical capacity, the dogs adopted out may be highly adoptable ones with much shorter lengths of stay compared to the majority of dogs these facilities impound. Similarly, many rescue oriented shelters likely pull much easier to adopt dogs than the bulk of dogs needing to get rescued from local facilities. Thus, the results from shelters with very limited capacity and rescue oriented organizations may look better than they actually are.

Few organizations reached or exceeded their adoption targets. Specifically, only 7 out of 102 shelters met the adoptions goals computed by the Life Saving Model. 2 of the 7 facilities reaching the adoption targets (Denville Township Animal Shelter and Warren Animal Hospital) had very few animals to place. Thus, the overwhelming number of New Jersey animal shelters need to step up their adoption efforts.

Several shelters exceeded their adoption targets. Old Bridge Animal Shelter had the most impressive results by far. This facility adopted out nearly 4 times the number of dogs targeted by the Life Saving Model and only euthanized 1% of all their dogs who had outcomes. Surprisingly, Livingston Animal Shelter adopted out the targeted number of dogs despite having a run down facility with limited adoption hours. The facility may have accomplished this by having a caring animal control officer who could place a relatively small number of dogs. Beacon Animal Rescue also exceeded its adoption target. While this organization is a rescue oriented group, the shelter appears to help more than easy to adopt dogs as pit bull type dogs currently make up about half of their dogs up for adoption. Perth Amboy Animal Shelter also deserves credit for nearly reaching its adoption target while only 3% of its dogs were euthanized. Only a few years before, 25% of Perth Amboy Animal Shelter’s dogs were killed by the prior shelter management.

Liberty Humane Society and Trenton Animal Shelter also exceeded their targeted number of local dog adoptions. These two facilities are space constrained shelters with high kill rates and the dogs they adopted out potentially may have been more adoptable than the bulk of their dogs. In the case of Liberty Humane Society, I’ve anecdotally observed them adopting out a large percentage of pit bulls and believe they are doing a good job on dog adoptions. Either way, both Liberty Humane Society and Trenton Animal Shelter are performing better than many other similar facilities and rescues/other shelters should support these organizations by pulling more dogs from Liberty Humane Society and Trenton Animal Shelter.

Many shelters with the ability to help other local shelters fail to do so. New Jersey animal shelters have the potential to rescue and adopt out nearly 5 times as many dogs as the number of dogs unnecessarily dying in the state’s animal shelters. Approximately 40% of the adoption shortfall is due to shelters not using their existing capacity to adopt out their own dogs or rescue dogs from space constrained nearby facilities. The other 60% of the adoption shortfall is due to shelters not adopting out animals as quickly as these organizations should. Thus, New Jersey animal shelters fail to even come close to their adoption potential.

Associated Humane Societies performance is particularly disappointing. Specifically, Associated Humane Societies has the physical capacity to end the killing of all healthy and treatable dogs in New Jersey. Associated Humane Societies adoption shortfall of 5,453 dogs significantly exceeds the 3,603 dogs unnecessarily losing their lives in New Jersey animal shelters. Even if all three Associated Humane Societies’ shelters used just 50% of their reported dog capacity, the organization could reduce the number of dogs unnecessarily dying in New Jersey animal shelters by nearly half per my model. Furthermore, Associated Humane Societies may put an additional strain on New Jersey’s animal welfare system by sending dogs to other facilities and rescues in the state when Associated Humane Societies has more than enough capacity to handle its dogs. Associated Humane Societies has the funding to reach these adoption targets as the organization took in nearly $9 million of revenue last year. This works out to over $450 of revenue per dog and cat I project the shelter should take in per my Life Saving Model. As a comparison, Nevada Humane Society, KC Pet Project, and Upper Peninsula Animal Welfare Society, which are no kill open admission shelters, took in only $225-$415 of revenue per dog and cat. Activists wanting to increase life saving in New Jersey should focus on changing Associated Humane Societies’ policies given the lifesaving potential of this organization.

Shelters transporting dogs from out of state also significantly failed to achieve their adoption targets for New Jersey dogs. In fact, shelters rescuing dogs from out of state facilities have a New Jersey dog adoption shortfall exceeding the number of New Jersey dogs unnecessarily dying in our state’s shelters. Not surprisingly many of these facilities’ total adoptions including transported dogs exceeded the local dog adoption targets as most transported dogs are easier to adopt. These transporting shelters’ local adoption performance is even worse considering most of these organizations likely take in much more adoptable local dogs than my model targets. In addition, the revenues these transporting shelters bring in from adoption fees and dramatic fundraising stories likely divert funding from New Jersey animal control shelters. Thus, it is quite clear most transporting shelters are not doing their part in helping New Jersey’s homeless dogs.

NJ Shelter Model 2013 for Blog (Loc adop)

NJ Shelter Model 2013 for Blog (Loc adop) (2)

NJ Shelter Model 2013 for Blog (Loc adop) (3)

Shelters Fail to Use Excess Space to Save Local Dogs

To further examine New Jersey animal shelters’ performance in saving the state’s homeless dogs, I compared the targeted number of dogs each shelter should pull from nearby shelters and compared it to the number actually rescued from local facilities. I assume all reported out of state rescued dogs came from southern or other far away states. While some of the out of state rescued dogs may have comes from nearby areas, I believe this is a small number and does not significantly impact the results.

Virtually all New Jersey animal shelters are failing to rescue the number of local dogs they should. 89 of the 102 shelters should rescue some dogs from other local shelters. In fact, 55 of the 89 shelters with targeted excess capacity failed to rescue even a single dog from a New Jersey animal shelter. Of the 89 shelters with the space to rescue dogs from nearby shelters, only Beacon Animal Rescue met or exceeded its local dog rescue target. While Animal Alliance and Ramapo-Bergen Animal Refuge appear to come close to their targeted local rescues, this is most likely due to these organizations pulling relatively few pit bulls. 80% of the targeted rescues are pit bulls while Animal Alliance and Ramapo-Bergen Animal Refuge only appear to have pit bulls representing around 20% of their dogs currently up for adoption. Thus, nearly all New Jersey animal shelters with targeted excess capacity are failing to do their share in ending the killing of local healthy and treatable dogs.

Shelters can overcome challenges in rescuing dogs from outside their service area. In some cases, municipalities may frown on government run shelters using taxpayer funds to rescue dogs from elsewhere. However, shelter directors at these facilities can encourage individuals to form a non-profit or raise money on their own to pay for these rescued dogs. Additionally, shelters with limited capacity or even some of the well-off private shelters could contribute funding for each dog rescued. For example, Maddie’s Fund paid an approximate $160 subsidy to rescues pulling dogs from New York Animal Care & Control. Similarly, private shelters with excess space, but limited financial resources, could expand their fundraising efforts to save more local dogs. Thus, perceived obstacles to rescuing local dogs can and should be overcome.

NJ Shelter Model 2013 for Blog (Rescued)

NJ Shelter Model 2013 for Blog (Rescued) (2)

NJ Shelter Model 2013 for Blog (Rescued) (3)

New Jersey Animal Shelters Need to Form Life-Saving Coalitions

The improper allocation of space within the state’s animal shelter system requires organizations to form coalitions. While putting a competent and compassionate director in every shelter would likely be even more effective, that will likely take time to do. No kill coalitions between animal control facilities and selective admission shelters have been used in places, such as Portland, Oregon, Reno, Nevada, Jacksonville, Florida and Austin, Texas to radically increase life saving. Maddie’s Fund, which has supported using coalitions for over a decade, has many resources for organizations seeking to collaborate with each other. Thus, New Jersey animal shelters need to formally work together, develop quantifiable and measurable goals (such as the targeted outcomes in this blog), and hold each organization accountable for meeting these goals.

Sobering Results Require Shelter Leaders to Critically Examine Themselves

New Jersey animal shelters’ dismal performance is even worse considering I used conservative assumptions. Organizations were not expected to return additional lost dogs to owners despite room for significant improvement. The targeted adoption lengths of stay ranged from 34-40 days for dogs taken in from the local community and 44 days for dogs rescued from other local shelters. However, some no kill open admission shelters adopt dogs out much more quickly. For example, I estimate dogs only take about 15 days to get adopted at Williamson County Animal Shelter in Texas based on their operating data and total average length of stay. Similarly, some no kill open admission shelters, such as Greenhill Humane Society and KC Pet Project, adopt out their pit bulls in much less time than the benchmark shelters used in this analysis. 50 days was used in my model, but Greenhill Humane Society’s and KC Pet Project’s (estimated) corresponding figures are around 40 days and 19 days. Additionally, creating successful pet retention and targeted spay/neuter programs could reduce local intake and allow shelters to rescue more dogs from elsewhere. Thus, New Jersey animal shelters could save significantly more animals than the targeted numbers I computed.

Shelters should examine the reasons why their adoption numbers fall far short of these benchmarks. In some cases, shelters, such as Woodbridge Animal Shelter, need to expand the hours they are open for adoptions. Many shelters should switch from an overly judgmental adoption process based on black and white rules to a conversational one focused on educating the adopter. Organizations will need to radically increase their off-site events and do same day adoptions. Similarly, many shelters must reduce adoption fees and run frequent promotions. Executive Directors should monitor the latest life-saving programs on Maddie’s Fund’s, ASPCA Pro’s, and the Best Friends National Conference’s web sites and put some of these policies into place. Shelter management teams will need to ensure their facilities are clean and customers are treated with respect (this can be measured by encouraging the public to complete surveys). Thus, poorly performing shelters need to stop making excuses and do what it takes to reach their adoption potential.

Shelters truly wishing to save lives should be ecstatic with the results from this analysis. The organizations have the potential to save far more lives than they ever thought were possible. Will the leaders of these facilities take the initiative to improve their performance as anyone with a job outside of animal sheltering would do? Thousands of lives depend on the answer to this question.

We should support shelters financially and with our precious free time who answer this question correctly. Ralph Marston said:

Don’t lower your expectations to meet your performance. Raise your performance to meet your expectations. Expect the best of yourself, and then do what is necessary to make it a reality.

We can turn New Jersey, New York City and Philadelphia into no kill communities. It is time we give our money and volunteer efforts to organizations who raise their performance to help us reach that goal. To do otherwise, would betray all the animals whose lives are on the line.

Appendix – Life Saving Model Assumptions

The Life Saving Model utilizes the following basic animal shelter population equations to calculate the targeted dog outcomes for each facility:

Daily capacity or population = Daily animal intake x average length of stay

Average length of stay = Daily capacity or population/daily intake

Each shelter’s community dog intake (i.e. owner surrenders, strays, cruelty bite cases), number of dogs returned to owners, and maximum dog capacity were taken from its 2013 “Shelter/Pound Annual Report” submitted to the Office of Animal Welfare. Unfortunately, 2014 data will not be available until Fall 2015.

This data was then used as follows:

  • Community dog intake and dogs returned to owners were initially estimated for each month by dividing the annual figures by 12. In order to take into account the extra space in low intake months and reduced space in high intake months, we multiply that number by each month’s percentage of the average month. For example, assume 240 dogs were taken in during the year and the average month equals 20 dogs (240/12). In July, the dog intake is 120% higher than the average month and we therefore multiply 20 dogs by 1.2 to equal 24 dogs. If 120 dogs were returned to owners during the year, the estimated number of dogs returned to owners in July would equal 12 dogs (120/12 = 10; 10*1.2). The monthly intake percentages were based off 2013 dog intake data on the New York Animal Care & Control web site.
  • The estimated number of community dogs returned to owners each month are then assumed to stay 5 days on average at shelters based on data from other shelters across the country. If anything, this estimate is conservative (i.e. average length of stay for dogs returned to owners may be less than 5 days and therefore frees up more shelter space for adoptions) based on some shelters returning the bulk of their dogs to owners within 3 days.
  • The number of community dogs euthanized (including animals who died or are missing) is set to equal 5% of intake. 5% is a reasonable standard euthanasia rate for shelters in New Jersey to meet given few vulnerable stray puppies (i.e. who could die or require euthanasia) arrive in the state’s animal shelters. The average length of stay for euthanized dogs is assumed to equal 14.5 days. Half of dogs are assumed euthanized for untreatable aggression towards people and 21 days is the time estimated to make that determination. The other half of dogs are assumed euthanized for severe and untreatable health issues and I estimate these dogs are euthanized after 8 days (subsequent to the end of the stray and owner surrender hold periods).
  • Adopted dogs are assumed to stay at shelters for varying lengths of time. Adoption length of stay was based on data from a study in the Journal of Applied Animal Welfare and the figures used are located in a prior blog on pit bull adoption. The data primarily comes from Tompkins County SPCA during a time it saved over 90% of its dogs. This was a fairly conservative data set to use as other no kill open admission shelters’ average length of stay are substantially shorter. Specifically, the following assumptions were made:
    1. 80% and 20% of each communities dogs (including pit bulls) were adults 1 year and older and under 1 year.
    2. Pit bulls were assumed to comprise 50%, 35% and 25% of community dog intake at poor, middle/upper middle class, and wealthy area animal control shelters. While some shelters may have pit bulls comprising more than 50% of their shelter dog population at a given time, this is due to pit bulls longer average length of stay. For example, a shelter with pit bulls making up 50% of their dog intake and pit bulls having an average length of stay three times longer than other dogs will have pit bulls constituting 75% of the dog population. Shelters without animal control contracts were assumed to only have pit bulls make up 10% of their community dogs (i.e. strays and owner surrenders) based on most of these shelters’ highly selective admission practices.
    3. Pit bull length of stay was taken directly from the Journal of Applied Animal Welfare study. The average lengths of stay for other breeds from this study were averaged and used for dogs other than pit bulls in the analysis
  • Dogs transferred to rescue or other facilities are assumed to stay at shelters 8 days on average based on the assumption strays can’t be released until the 7 day hold period elapses.
  • Community dogs not returned to owners or euthanized are initially assumed as adopted for each month. However, if the calculated length of stay exceeds the shelter’s required length of stay, dogs are moved from adoption (i.e. with a longer length of stay) to rescue (i.e. shorter length of stay) until the calculated length of stay each month approximately equals the required length of stay.
  • Required length of stay = Shelter’s reported capacity/adjusted daily intake for the month. Adjusted daily intake for month = Adjusted monthly intake per first bullet above/the number of days in the month.
  • Shelters with excess capacity are assumed to use the extra space to rescue and adopt out dogs from other New Jersey animal shelters. To the extent all healthy and treatable New Jersey animal shelter dogs are saved, I assume additional dogs are pulled from nearby states with similar types of dogs. I assume all rescued dogs will not be killed since the transferring and receiving shelters should evaluate these dogs’ behavior. Based on pit bull type dogs having longer lengths of stay at shelters, I assume 80% of dogs rescued from local animal shelters are pit bulls and 20% are non-pit bulls. 80% and 20% of pit bull and non-pit bull type dogs are considered 1 year and older and under 1 year. The average length of stay for rescued pit bulls and other dogs are the same as above.
  • Each month’s targeted outcomes are added to determine how many local dogs New Jersey animal shelters should adopt out, send to rescue, rescue from other nearby animal shelters and euthanize.

New Jersey Animal Shelter Statistics Are Far Worse Than Previously Thought

Photo of discarded dead animals from a 2009 Office of Animal Welfare inspection report of Associated Humane Societies – Newark. The Executive Director at the time is still in charge of this shelter today.


Most New Jersey animal shelters voluntarily report detailed data to state authorities. Last August, I shared New Jersey’s animal shelters summary statistics on my Facebook page. Each year, the New Jersey Department of Health’s Office of Animal Welfare requests each licensed animal shelter in the state to submit animal shelter data for the previous year. Animal shelters voluntarily submit this data in the “Shelter/Pound Annual Report.” The Office of Animal Welfare takes these Shelter/Pound Annual Reports and compiles the number of dogs, cats and other animals impounded, redeemed, adopted and euthanized to prepare its Animal Intake and Disposition report. However, the Shelter/Pound Annual Reports include additional information on how animals were impounded (i.e. strays, owner surrenders, rescued from in-state facilities, rescued from out of state shelters, and cruelty/bite cases) and disposed of (i.e. returned to owner, adopted, sent to rescue/another shelter, and died/missing). Additionally, the Shelter/Pound Annual Reports include the number of animals in shelters at the beginning and end of the year as well as the maximum number of animals facilities can hold. Thus, the Shelter/Pound Annual Reports include very important data not found in the Office of Animal Welfare’s summary report.

I compiled the data from these reports and analyze the results in this blog. 2013 statistics for each New Jersey animal shelter are listed at this link.

Garbage Data Raises Serious Questions About New Jersey Animal Shelters’ Statistics

Several animal shelters, which reported statistics in prior years, failed to submit data in 2013. Specifically, Summit Animal Clinic in Union City, Associated Humane Societies – Tinton Falls, Mercerville Animal Hospital and Angel Pets Animal Welfare in Woodbridge disclosed this data in 2012, but did not do so in 2013. Additionally, East Orange Animal Shelter has never submitted Shelter/Pound Annual Reports to the state, but did share limited data with The Record newspaper. These shelters failure to disclose data raises serious questions. For example, are they trying to hide embarrassing statistics from the public? I’ve included these shelters’ 2012 data, and in the case of East Orange, its limited 2013 data in my analysis. Also, I performed my analysis without these shelters as well. Unless indicated below, I’ve included these shelters’ data in the analysis under the assumption the statistics would be similar if submitted to the Office of Animal Welfare in 2013.

Most New Jersey animal shelters do not properly account for their animals. Simple math dictates the number of animals at a facility at the beginning of the year, plus all animals coming in during the year, less all animals leaving for the period, should equal the number of animals a shelter has at the end of the year. Stunningly, 69 out of 100 shelters reporting these dog statistics and 71 out of 98 facilities submitting this cat data failed to get this right. This raises serious questions about the accuracy of these shelters’ reported statistics. Even worse, 54 of the 69 shelters with flawed dog statistics and 46 of the 71 facilities with incorrect cat statistics should have had more animals at the end of the year then reported. While these errors could have been due to incorrect counts of the number of animals at facilities, the more likely answer is many outcomes, such as animals killed, dying, or gone missing, were not recorded. Given 71% of the errors were due to shelters having less rather than more animals on hand at the end of the year than they should have had lends credence to the theory that errors were mostly due to shelters failing to account for various outcomes. To put it another way, 3,231 cats and dogs should have had outcomes reported and did not. Thus, there is the potential that as many as 3,231 additional dogs and cats were killed, died or went missing from New Jersey animal shelters than were reported in the last year.

Shelters may have failed to classify animals adopted out and sent to rescue properly. Both Paterson Animal Control and Elizabeth Animal Shelter reported no animals were sent to rescues and all dogs and cats leaving their facilities alive were owner reclaims or adoptions. However, rescues I know who work closely with these two facilities told me both shelters rarely adopt animals directly to the public. This makes sense as neither shelter advertized animals for adoption (i.e. no adoption web site or social medial pages) in 2013. One has to wonder how many other facilities failed to properly classify adoptions and rescues properly. This data is very important as it provides details on the burden rescues and other shelters are taking from these facilities.

We need better oversight of New Jersey animal shelters’ data reporting. Currently, these statistics are voluntarily reported and most shelters are not taking this seriously. For example, I noticed a large number of reports were submitted many months after the end of the year. This data should be easy to compile since facilities can utilize animal shelter software programs, some of which are free, to do this task. Furthermore, New Jersey animal shelter laws mandate facilities maintain much of the raw data found in the Shelter/Pound Annual Report. Unfortunately, Office of Animal Welfare inspections routinely find shelters do not properly keep records on animals. We need to make the Shelter/Pound Annual Report mandatory for animal shelters along with serious penalties for significant errors (especially if deliberate). In order for animal shelters to take data reporting seriously, we may also need to require audits of these reports. Thus, these results show we need stronger laws and the Office of Animal Welfare to play a greater role in ensuring reported animal shelter statistics are in fact accurate.

Despite the errors in these reports, the data provided still reveals important information.

More Animals Losing Their Lives in New Jersey Animal Shelters Than Previously Believed

The more detailed data in the Shelter/Pound Annual Reports allows one to more critically examine the percentage of locally impounded animals dying in New Jersey’s animal shelters. The following table summarizes my analysis of the kill/death rate calculated from the Office of Animal Welfare’s summary report and the data reported in the Shelter/Pound Annual Reports.

Totals

The Animal Intake and Disposition report prepared by the Office of Animal Welfare only allows one to calculate the number of animals killed as a percentage of total animals impounded or intake. I prefer calculating the kill rate as a percentage of outcomes rather than intake as this metric directly compares positive and negative outcomes. Using intake depresses the kill rate since shelters can simply hold animals for a long time to the point of overcrowding. Calculating kill rate based on outcomes rather than intake increases the dog kill rate from 13.4% to 13.9% and the cat kill rate from 38.5% to 39.2%.

To calculate the statewide kill rate, we must also back out transfers from one New Jersey animal shelter to another state facility to avoid counting animals still in the state’s shelter system or registering two outcomes for the same animal (i.e. one New Jersey animal shelter transfers a dog or cat to another state facility who then adopts out the animal). This adjustment increases the dog kill rate from 13.9% to 14.5% and the cat kill rate from 39.2% to 40.8%.

In addition, we should increase the kill rate for animals dying or gone missing in shelters. I label this metric the death rate as these animals are likely dead or in a very bad situation. After making this adjustment, the dog death rate increases from 14.5% to 15.5% and the cat death rate rises from 40.8% to 46.8%.

Also, many shelters transport easy to adopt animals from out of state which artificially increases save rates. To properly calculate the percentage of New Jersey animals losing their lives, we need to adjust for transports. Unfortunately, shelters don’t break out their save rates by local and out of state animals. However, most likely nearly all of the out of state animals (primarily puppies and easy to adopt dogs) make it out of shelters alive. Therefore, I back out the number of out of state transports to estimate the local death rate. This adjustment increases the New Jersey dog death rate from 15.5% to 18.9% and the state cat death rate from 46.8% to 47.4%.

Also, I estimate a maximum local death rate by including the number of unaccounted for animals described in the section above. Making this adjustment increases the maximum potential New Jersey dog death rate from 18.9% to 22.1% and the maximum potential state cat death rate from 47.4% to 49.5%.

Finally, the maximum potential New Jersey cat death rate decreases slightly from 49.5% to 49.4% if I include the 2012 data from shelters who failed to report statistics in 2013 to the Office of Animal Welfare. Thus, the percentage of New Jersey animals losing their lives in our state’s animal shelters may be much higher than previously thought.

Death Rates Extremely High at a Number of New Jersey Animal Shelters

Dogs and cats are likely to lose their lives or go missing at a number of New Jersey animal shelters. Shelters with the highest death rates for dogs and cats are listed in the following tables:

NJ Shelter Rates Tables (6)

NJ Shelter Rates Tables (7)

Thus, both dogs and cats have a very good chance of leaving many New Jersey animal shelters dead rather than alive.

Many shelters fail to account for large numbers of their animals. As discussed above, a shelter’s number of animals at the end of the year should be calculated as follows:

Beginning number of animals + animals impounded – animals leaving the shelter

Unfortunately, a large number of shelters take in far more animals than they can explain where they went. Shelters having the highest numbers of unaccounted for dogs and cats are listed in the following tables:

NJ Shelter Rates Tables (8)

Unacct cats

Dog and cat death rates at many shelters may be even higher if these unaccounted for animals are counted as dead or missing. If we only consider animal shelters which don’t or rarely transport, facilities with the highest dog and cat death rates considering the unaccounted for animals described above are as follows:

NJ Shelter Rates Tables (2)

Max pot cats po

Thus, the plight of dogs and cats may be far worse in New Jersey animal shelters when we consider the unaccounted for animals.

Shelters Turn Their Backs on New Jersey’s Animals

New Jersey animal shelters rescue far more animals from out of state than other New Jersey animal shelters. Specifically, 5,676 dogs were transferred from out of state animal shelters compared to only 1,410 dogs taken in from other New Jersey animal shelters. While perhaps some shelters, such as Animal Alliance in Lambertville, take animals from nearby New York or Pennsylvania animal control shelters, the overwhelming majority of these dogs most certainly came from down south. In fact, New Jersey animal shelters transported more dogs from out of state than dogs who were killed in, died in or went missing from New Jersey animal shelters. This number does not include additional dogs transported in from out of state by rescues operating without a physical facility. Shelters transporting the most dogs from out of state were as follows:

NJ Shelter Rates Tables (5)

New Jersey animal shelters transported 642 cats from out of state while nearly 50% of cats in the state’s animal shelters were killed, died or went missing. Animal Welfare Association (280 cats received from out of state) and Mount Pleasant Animal Shelter (211 cats received from out of state) rescued more cats from out of state facilities than New Jersey animal shelters. In the case of Mount Pleasant Animal Shelter, the organization’s Executive Director told me these cats were rescued from New York Animal Care and Control. One can only hope the out of state cats rescued by other New Jersey animal shelters came from nearby New York and Pennsylvania facilities rather than from shelters far away down south.

Return to Owner Rates Better Than Average at Most Shelters

Return to owners (“RTO”) rates are one of the positive results from this analysis. Overall, the dog and cat RTO rates of 52% and 4% are approximately twice the national average. As I noted in my blog on reuniting lost pets with owners, return to owner rates are highly correlated with socioeconomic status. Wealthier people likely have more resources/knowledge to license and microchip their dogs. Similarly, people with greater incomes are more likely to afford reclaim fees or ransom payments to animal shelters. New Jersey’s RTO rates for dogs clearly fit this pattern with shelters serving wealthy towns returning most stray dogs to owners while urban shelters are only returning about one fifth of lost dogs to owners. Clearly, we need to help people in urban areas get microchips and ID tags on their dogs. Additionally, we need to create pet help desks at shelters in these cities to help people pay the reclaim fees, which are often mandated by the cities themselves, when necessary. The statewide cat reclaim rate, like figures from across the nation, is still very low and suggests shelters need to figure out better ways to get lost cats back to their families. New Jersey should allow shelters to transfer stray cats to rescues during the mandatory 7 day hold period since few are returned to owners at shelters. This would open up space to save more cats and reduce the chance of disease (i.e. cats spending less time in shelters are not as likely to get sick).

Shelters Leave Animal Enclosures Empty While Dogs and Cats Die

New Jersey animal shelters fail to use their space to save animals. Based on the average number of animals at all of New Jersey’s animal shelters at the beginning and the end of 2013, only 61% of dog and 66% of cat capacity was used. Given December is a low intake month, I also increased these populations to an average intake month. This adjustment only raised the dog and cat capacity utilization to 62% and 87%. These estimates likely overestimate the average capacity utilized as many facilities kill animals once they reach a certain population level. Many animal shelters with low kill rates failed to rescue animals with their excess space. Additionally, other shelters used little of their available space and still killed a large percentage of their animals. Some examples after increasing the population (and therefore capacity utilization) based on the adjustment discussed above are as follows:

NJ Shelter Rates Tables (11)

NJ Shelter Rates Tables (13)

Thus, many New Jersey animal shelters are killing dogs and cats despite having ample space to house these animals.

New Jersey’s animal shelters continue to fail the state’s animals. The state’s animal control facilities only impound 8.7 animals per 1,000 New Jersey residents. As a comparison, the average community in the country impounds anywhere from 14-30 animals per 1,000 residents based on estimates from Animal People Newspaper and the Humane Society of the United States. Despite New Jersey shelters impounding a fraction of the animals other no kill communities take in on a per capita basis, the state’s animal control facilities continue to kill and allow animals to die under their care. Even worse, many of these shelters can’t even properly keep track of how many animals leave their facilities dead or alive. Our state’s animals deserve far better treatment than this. Contact your local city council members and mayor and demand better from the animal shelter serving your community. We can do this so let’s get to work!

New Jersey’s Lawless Animal Shelters Need Policing

Recently, terrible conditions at New Jersey animal shelters became well-publicized. The NJ SPCA took over Hunterdon Humane Animal Shelter in January after Hunterdon Humane Animal Shelter’s Board President was charged with animal cruelty for failing to provide proper care to a number of cats at the facility. In March, Jersey Animal Coalition failed a joint state Office of Animal Welfare and South Orange inspection resulting in the shelter’s planned closing in November. The Office of Animal Welfare inspected the East Orange Animal Shelter in June and found horrific problems. During June, Elizabeth Animal Shelter illegally killed an owner’s two dogs before the 7 day state mandated hold period elapsed. In July and August, the Office of Animal Welfare inspected Linden Animal Control and requested Linden’s Health Officer shut the facility down. The Office of Animal Welfare also documented significant problems at Helmetta Regional Animal Shelter in July and the problems continue to exist today. Local animal activists in Montclair documented Montclair Township Animal Shelter violating New Jersey animals shelter laws, such as failing to maintain adequate temperatures in the facility, using toxic solutions of chemicals causing burns and possibly lung injuries to shelter animals, and failing to provide prompt veterinary care. As a a result of these events, animal activists in New Jersey are becoming aware of the crisis in our state’s animal shelters.

New Jersey Animal Shelter Laws Are Pretty Good

New Jersey’s animal shelter laws are pretty good relative to other states. Our stray/hold period of seven days is longer than most states. New Jersey also prevents its shelters from killing owner surrendered pets immediately by requiring these animals be held 7 days or sent to rescue. Furthermore, state animal shelter laws require facilities to have a supervising veterinarian who approves a disease control program that addresses “both the animals’ physical and psychological well-being.” N.J.A.C. 8.23A-1.9 also mandates “animals displaying signs of stress shall be provided with relief pursuant to the disease control and health care program.” New Jersey shelters must also keep their facilities clean and use solutions and products that will not harm the animals. Finally, specific rules exist to help ensure euthanasia is done as humanely as possible.

Local Boards of Health Fail Miserably at Enforcing New Jersey Animal Shelter Laws

New Jersey animal shelter laws are largely enforced by local boards of health rather than the New Jersey Department of Health’s Office of Animal Welfare. Under N.J.A.C. 8.23A-1.2 (b), animal shelters must pass an annual inspection by the local health authority. The New Jersey Department of Health’s Office of Animal Welfare, which is tasked with ensuring sanitary and humane conditions exist at New Jersey’s animal shelters, also has the right under state law to inspect these facilities. In practice, the Office of Animal Welfare rarely inspects animal shelters. Ultimately, local municipalities through a recommendation by the local health authority or the state Office of Animal Welfare can revoke an animal shelter’s license.

The shocking conditions exposed this year at northern New Jersey animal shelters prove local health authorities cannot adequately enforce the state’s animal shelter laws. Prior to the NJ SPCA arresting Hunterdon Humane Animal Shelter’s Board President in January 2014, the Office of Animal Welfare issued a scathing inspection report on October 23, 2013. The inspection report noted Hunterdon Humane Animal Shelter housed sick and healthy cats together, kept cats with feces all over their feet and legs, failed to provide sick kittens covered in feces prompt vet care, allowed cats and kittens to have eye discharge so severe they couldn’t open their eyes, illegally killed animals before the 7 day hold period elapsed, and routinely used heart sticking to kill animals. Jersey Animal Coalition, which performed poorly in state Office of Animal Welfare inspections from 2005 – 2007, passed subsequent South Orange inspections and then miserably failed an Office of Animal Welfare inspection in March 2014. The inspection report noted sick/injured animals and animals under severe psychological stress were not treated, massive amounts of feces within and outside the facility, sick and healthy animals were housed together, no disease control program approved by a veterinarian, and animals not provided adequate amounts of water. The Office of Animal Welfare inspected East Orange Animal Shelter in June and reported animals inundated with a toxic feces and chemical filled soup, a fly infestation so severe that animals with open wounds and skin lesions were in danger of having maggots grow inside them, cats not provided with enough water and water they did have was contaminated with cat litter, and improper isolation of sick animals. Montclair’s Board of Health was “unable to locate” legally required inspections from 2010 and 2012, and took a grand total of an hour and 45 minutes and 60 minutes to conduct inspections in 2011 and 2013, respectively. Montclair’s Animal Welfare Advisory Committee documented numerous problems going on for years, such as dogs exposed to the elements, animals left isolated for extended times, and water not being properly supplied to dogs and cats. In October, Clifton Animal Control allegedly forced an owner to surrender their dog and then illegally killed the family pet before the required 7 day hold period elapsed. Thus, we clearly see local boards of health cannot properly ensure New Jersey’s animal shelters are kept sanitary and run in a humane manner.

Reports of serious violations of state animal shelter laws at various central central New Jersey facilities show the problem exists throughout the state. Elizabeth Animal Shelter, which presumably passed the Elizabeth Board of Health’s annual inspections, apparently routinely illegally killed owner surrendered animals. Based on reports at the time, the Elizabeth Animal Shelter told a person surrendering two dogs, which he did not own, to bring the dogs in on their weekly kill day and the shelter executed the animals that very same day. Linden’s Board of Health failed to even perform legally required annual inspections of Linden Animal Control from 2007-2012. When the state Office of Animal Welfare inspected the facility on two occasions, the Office of Animal Welfare requested Linden close the facility immediately due to the horrific conditions. Helmetta Regional Animal Shelter inspections conducted by the Middlesex County Board of Health and Office of Animal Welfare turned up serious problems for years, but the very same local regulator continues to say everything is good. At the same time, activists documented terrible conditions and blatant violations of New Jersey animal shelter and federal controlled substance laws. As a result, local boards of health fail to do the necessary job of ensuring animal shelter laws are properly enforced.

The failure of local boards of health to properly enforce animal shelter laws is not surprising. In reality these entities are ill-equipped to inspect animal shelters. Local boards of health are used to inspecting places, such as restaurants, which are far different than animal shelters. In reality, animal shelters are more akin to hospitals than restaurants and other businesses local boards of health usually inspect. The New Jersey Department of of Health and several other public and private entities inspect health care facilities for compliance with state and federal laws at least annually. As a result, the New Jersey Department of Health’s Office of Animal Welfare should regulate the state’s animal shelters in a similar manner as the New Jersey Department of Health regulates hospitals and other health care facilities.

Local health departments are not independent from many of the shelters these agencies regulate. While local Health Officers must be licensed by the New Jersey Department of Health, these Health Officers and their personnel are employees of local governments. As such, these local health departments will typically not want to rock the boat. After all, would you want to tell the elected official, who is your boss, that his or her animal shelter failed to comply with New Jersey laws? Clearly, the costs to fix, which would either increase property taxes or reduce spending on other popular programs, and negative press hurt the reelection prospects of these local politicians. When you consider the state Office of Animal Welfare rarely performs independent inspections, local Health Officers have a strong incentive to not enforce New Jersey’s animal shelter laws. Thus, the system to regulate New Jersey’s animal shelters is set up to fail.

NJ SPCA Cannot Effectively Regulate Animal Shelters

The NJ SPCA, which are New Jersey’s animal police, has limited authority and will to clean up the state’s animal shelters. This private group, which holds police powers relating to animal cruelty law enforcement, typically handles animal shelters with kid gloves. For example, several people told me the NJ SPCA was notified of Jersey Animal Coalition’s problems years ago, but never acted until after the state Office of Animal Welfare and South Orange Board of Health asked the NJ SPCA to investigate Jersey Animal Coalition for animal neglect/cruelty last March. After seven months, the NJ SPCA has yet to conclude its investigation, but stated last May they would first work with the shelter to clean up its issues before bringing animal cruelty charges. Apparently, this cleanup never happened since Jersey Animal Coalition is closing and the NJ SPCA does not look like it will charge anyone. Similarly, the NJ SPCA’s Monmouth County guy, Buddy Amato, gave Helmetta Regional Animal shelter a glowing report in August despite numerous inspections, photos, and complaints proving otherwise. Subsequently, the NJ SPCA came to the shelter again and found major issues, but gave management 30-60 days to fix their problems. In 2012, Buddy Amato defended several Monmouth County towns who illegally killed feral cats before the state mandated 7 day hold period elapsed. Even when the NJ SPCA did take action against Hunterdon Humane Animal Shelter, the courts put the former Board President charged with animal cruelty back in charge. As a result, the NJ SPCA’s and the courts coddling of cruel animal shelter directors encourages all animals shelter directors to act in their own, rather than the animals, interest.

New Jersey Department of Health’s Office of Animal Welfare Needs to Directly Enforce State Animal Shelter Laws

The Office of Animal Welfare needs to dramatically increase the number of its animal shelter inspections. From January 1, 2013 through August 6, 2014, the Office of Animal Welfare only inspected six different animal shelters out of one hundred plus facilities in the state housing dogs or cats. The Office of Animal Welfare only has one inspector, Linda Frese, to police over one hundred animal shelters plus countless pet shops statewide. Luckily, Linda Frese performs thorough inspections and does terrific work. However, Ms. Frese needs lots of help to ensure all shelters are inspected properly. Given the crisis at our state’s animal shelters, the Office of Animal Welfare needs to hire enough inspectors to ensure every animal shelter in the state is inspected on a quarterly basis. Additionally, the Office of Animal Welfare should conduct these inspections without notifying local health departments to ensure these are truly surprise inspections.

New Jersey must pass new legislation providing the Office of Animal Welfare full power to close down terrible animal shelters. Under current law, the Office of Animal Welfare can only recommend that a municipality revoke an animal shelter’s license. As a result, local politicians currently can allow terrible animals shelters to continue neglecting their animals. Thus, the independent state Office of Animal Welfare must hold this authority to ensure New Jersey animal shelters are run properly.

Companion Animal Protection Act Needs to Become State Law

New Jersey shelter laws and the Office of Animal Welfare encourage shelter killing. Animal shelters in the Garden State may kill animals for any reason after seven days. For far too many shelters it is simply easier and cheaper to kill animals after one week. After all, if you have fewer animals in your facility you don’t have to clean, feed, and provide veterinary care to those animals. In fact, the Office of Animal Welfare actually encourages shelters to kill and advises municipalities to contract with kill rather than no kill shelters. As a result, New Jersey must pass legislation to force shelters to stop killing and start saving their animals.

The Companion Animal Protection Act (“CAPA”) needs to become law to ensure shelters save rather than take lives. CAPA requires shelters to follow many parts of the no kill equation, which is a series of programs proven to reduce or actually end the killing of savable animals. Specifically, CAPA requires animal shelters/municipalities do the following:

  1. Implement TNR and prohibit anti-feral cat policies
  2. Develop detailed animal care protocols for all animals, which includes nursing mothers, unweaned kittens and puppies, and animals which are old, sick, injured or needing therapeutic exercise
  3. Clean animal enclosures at least two times per day to maintain proper hygiene and be welcoming to prospective adopters
  4. Not kill any animal a rescue is willing to take
  5. Prohibit banning of rescues unless the rescue is currently charged with or convicted of animal cruelty/neglect
  6. Contact all rescues at least two business days before an animal is killed
  7. Match lost pet reports with animals in shelter and post stray animals on the internet immediately to help find lost pets owners
  8. Promote animals for adoption using local media and the internet
  9. Adopt animals out seven days a week for at least six hours each day, which includes evenings and weekends when potential adopters are likely to visit
  10. Not have discriminatory adoption policies based on breed/age/species/appearance (i.e. can’t prohibit pit bull, elderly pet, etc. adoptions)
  11. Offer low cost spay/neuter services, substantive volunteer opportunities to the public, and pet owner surrender prevention services
  12. Not kill any animals when empty cages exist, enclosures can be shared with other animals, or foster homes are available
  13. Shelter Executive Director must certify they have no other alternative when killing/euthanizing an animal
  14. Publicly display animal shelter intake and disposition statistics (i.e. numbers of animals taken in, adopted, returned to owner, killed, etc) for the prior year
  15. Provide the local government and the public access to the intake and disposition statistics each month
  16. Pet licensing revenues must be used to fund low cost spay/neuter and medical care for shelter animals rather than go to other government uses

Passing CAPA will require a huge fight as many New Jersey’s animal shelters along with the Humane Society of the United States (“HSUS”) and ASPCA will lobby against these common sense reforms. HSUS and the ASPCA fought similar reform efforts in many other states, such as New York, Minnesota, and California. However, this is a fight we must take on. CAPA, quarterly shelter inspections by the Office of Animal Welfare, and giving the Office of Animal Welfare the power to shut shelters down will spur massive improvements in the state’s animal shelters. Non-compliant municipalities and private animal shelters will face stiff penalties and therefore will dramatically change their ways.

As the past year showed us, we no longer can wait for municipalities and animals shelters to police themselves. Now is the time for a new sheriff to ride into town to bring law and order to our animal shelters. We can make this happen by demanding our state senators and local assemblymen/assemblywomen pass these laws to improve our shelter system. State Senator, Linda Greenstein, seems quite amenable to reforming our state’s shelter system and is someone we should work with.  Animal lovers are a huge voting block and New Jersey politicians better take us seriously. Enough is enough and if the politicians won’t help, we will show them the door. We can do this so let’s get to work!