Animal Control Shelter Adopts Out Every Single One of Its Pit Bulls

Majority Project

Recently, I heard the claim pit bulls are dying in New Jersey animal shelters due to “overpopulation” and the “average family” not wanting them. These reactions followed my previous blog setting adoption and euthanasia goals for New Jersey animal shelters. While I personally like some of the people making these assertions and agree with them on other issues, I believe this is a dangerous myth that has deadly consequences for pit bulls everywhere. Many shelters have already achieved no kill for their pit bulls despite taking in large numbers of these dogs. In this blog, I’ll explore the notion that the average family (presumably white and middle class) doesn’t want pit bulls so we shouldn’t even bother trying to save them.

Colorado Animal Control Shelter Proactively Works to Save Its Pit Bull Type Dogs

Ark Valley Humane Society serves Chaffee County, Colorado. Chaffee County’s population is 91% white and its poverty rate is below the national average.  Families make up a similar percentage of households as your typical New Jersey suburb. Thus, Chaffee County, Colorado is similar to many New Jersey communities.

Ark Valley Humane Society radically increased its pit bull live release rate in one year. In 2012, 40% of the shelter’s pit bulls were killed. Instead of complaining about “pit bull overpopulation” and “the average family not wanting pit bulls”, Ark Valley Humane Society set a strategic goal to turn their pit bull performance around. The shelter’s strategy focused on a longer term objective of reducing pit bull intake via offering free spay/neuter for pit bulls and a shorter term goal to quickly adopt out pit bulls into loving homes. Ark Valley Humane Society engaged the public, instituted multi-dog playgroups, and trained pit bulls to obey basic commands and become good canine citizens. As a result of these efforts, Ark Valley Humane Society adopted out all 27 pit bulls they took in during 2013.

Ark Valley Humane Society’s description of their efforts is as follows:

We are especially proud of our 2013 Pit-Bull Initiative. Pit-bulls and bully breeds have suffered a negative public perception. Faced with increasing numbers of pit-bulls, AVHS decided to take action to improve this breed’s ability to find forever homes. AVHS began offering free spay/neuter for owned pit-bulls and the pit-bull mixes living in Chaffee County. We have increased emphasis on public education, instituted multi-dog play groups for behavior modification, and formed shelter dog training classes for basic commands and good citizenship. Our efforts have resulted in the adoption of all 27 pit-bull intakes for 2013. No pit-bulls were lost due to ill health or unmanageable aggression issues.

While 27 pit bulls does not sound like a lot of dogs, this is large number for this community. Chaffee County is a sparsely populated area and only has 17,809 residents. The surrounding counties also have a low population density making it unlikely many people from elsewhere would visit this shelter to adopt dogs. This equates to a pit bull intake and adoption rate of 1.52 pit bulls per 1,000 people. As a comparison, I estimate New Jersey animal shelters collectively only take in approximately 1.15 pit bulls per 1,000 people and would only need to adopt out 0.70 pit bulls per 1,000 people to achieve no kill for our state’s pit bulls. Additionally, Ark Valley Humane Society took in 35% more pit bulls during the year they saved all of these dogs compared to the prior year when the shelter killed 40% of its pit bulls. Thus, Ark Valley Humane Society adopted out all if its pit bulls despite taking in significantly more pit bulls per capita than New Jersey animal shelters do as a whole.

Ark Valley Humane Society likely quickly adopted out its pit bulls. While the shelter did not disclose the time it took pit bulls to get adopted, we can come up with a reasonable estimate. Pit bulls made up 6% of all dogs taken in and the shelter’s average length of stay for dogs was 11.8 days. Typically, pit bulls stay 2-4 times longer than other dogs at high performing no kill animal control shelters. Using these numbers and some simple algebra, we can estimate pit bulls took 22.3 days, 31.6 days, and 40 days to get adopted assuming the pit bull average length of stay was 2 times, 3 times, and 4 times longer than other dogs. Even if pit bulls stayed at the shelter 5 times longer than other breeds, pit bulls would only take 47.6 days to get adopted. Furthermore, the fact that all pit bulls impounded in 2013 were adopted out during the year also supports the notion pit bulls left the shelter quickly. As a result, claims that pit bulls take “forever’ to get adopted are simply untrue.

Local Shelters Need to Stop Making Excuses and Work on Saving Our State’s Pit Bulls

Many other shelters are saving their pit bulls. For example, Longmont Humane Society, which serves a similar demographic in a more suburban area of Colorado, saves 96% of its pit bulls and takes in roughly 3 times as many pit bulls per capita than the average New Jersey animal shelter. Kansas City, Missouri’s animal control shelter, KC Pet Project, takes in nearly 3 times as many pit bulls per capita than the typical New Jersey animal shelter and has a pit bull save rate close to 90%. Thus, many shelters across the nation are saving their pit bulls.

Several New Jersey shelters are doing a good job adopting out their pit bulls. Perth Amboy Animal Shelter, which serves an area with a high poverty rate, is likely saving over 90% of their pit bulls based on their overall dog live release rate of 97% and pit bulls probably comprising a substantial percentage of the dogs taken in. For example, if this shelter saved 99% of non-pit bulls, pit bulls would only need to make up 22% or more of the dog intake for the pit bull live release rate to equal or exceed 90%. Not surprisingly, I estimate Perth Amboy Animal Shelter adopted out roughly 40% more pit bulls per capita in 2013 based on the assumptions from my prior blog than the average New Jersey animal shelter needs to do to achieve no kill for pit bulls. Similarly, I estimate Trenton Animal Shelter is adopting approximately 30% more pit bulls per capita than the average New Jersey animal shelter should despite severe space constraints (i.e. which limits adoption potential). Thus, there is no reason other New Jersey animal shelters cannot adopt out more pit bulls.

People truly want pit bull type dogs. Based on recent data, pit bulls are among the three most popular breeds in New Jersey. Given people keep obtaining these dogs, which is often not from shelters, demand clearly exists for pit bulls. Additionally, all sorts of families and people adopt pit bull type dogs. Furthermore, even if the myth that suburban families won’t adopt pit bull type dogs were true, shelters can still adopt out these dogs off-site in nearby urban areas. Thus, New Jersey residents want pit bull like dogs and local shelters need to meet that demand.

Adopting out many sterilized pit bulls to the public will decrease pit bull breeding. Many pit bulls are surrendered to shelters due to owners lacking resources to fix solvable problems. If we can help these people, fewer pit bulls will come into shelters, and people will be more likely to get sterilized pit bulls from shelters in the future. Significantly increasing the number of sterilized pit bulls in the state will decrease the number of pit bulls coming into shelters. Thus, we can save the pit bulls currently in shelters and reduce the number of pit bulls arriving at shelters in the future.

Local animal shelters need to abandon the excuses and help save our pit bulls. Animal Farm Foundation has tons of resources for shelters to use and offers internships to shelter personnel to improve their pit bull adoption rates. Shelters can also contact Executive Directors from successful shelters and seek their advice. Additionally, shelters can bring in Amy Sadler to properly implement multi-dog playgroups. Similarly, organizations can engage no kill consultants, such as Humane Network and No Kill Learning, to provide detailed advice as well. Thus, shelters need to take proactive steps to improve their pit bull adoption rates.

It is time we stopped making excuses and do what is possible. Like Ark Valley Humane Society showed, where these is a will there is way. It is time all shelters do the same.

New Jersey Animal Shelters’ Report Cards for Dogs

report-card

In my last blog, I disclosed New Jersey’s depressing animal shelter statistics. This blog explains why so many dogs are losing their lives in the state’s animal shelters and whether these facilities can end the killing.

Successful organizations set measurable goals and regularly monitor their performance. Examples include financial budgets, customer and employee satisfaction surveys, and product reliability metrics. Unfortunately, many animal shelters for far too long have failed to set lifesaving goals and standards. Municipalities, donors and volunteers need to know where their resources will be best utilized. Time and money are scarce resources and people should allocate these assets to organizations who will best utilize them. As a result, animal shelters need to set goals and hold their leadership and staff accountable for achieving these objectives.

Model Assesses New Jersey Animal Shelters’ Life Saving Performance

In order to assess how good of a job New Jersey animal shelters are doing, I’ve developed an analysis I call the “Life Saving Model.” While shelter performance is dependent on many variables, such as finances, facility design, local laws, etc., the most critical factor impacting potential life saving is physical space. Without having enough physical space, a shelter might not have enough time to find loving homes for its animals. Shelters can overcome financial limitations through creative fundraising or recruiting more volunteers. Similarly, organizations can save their dogs despite having run down facilities if these groups enthusiastically implement policies to get animals into loving homes quickly. As a result, my analysis focuses on making the best use of space to save the maximum number of New Jersey dogs.

The Life Saving Model measures the number of local animals a shelter should adopt out, rescue from other facilities, send to rescues or other shelters, and euthanize. The targeted outcomes take into account each facility’s physical capacity and the number and types of dogs the organization receives from its community (i.e. strays, owner surrenders, cruelty/bite cases). I assume a target euthanasia rate, take the number of dogs actually returned to owners and then estimate how many community dogs a shelter should adopt out. To the extent space runs out, I then calculate how many dogs must be sent to rescue. If the shelter has excess space after properly serving its local community, the facility uses that room to rescue and adopt out dogs from nearby areas. The targeted results calculated from this model are compared to the actual or estimated actual results from each shelter below.

To read specific details and assumptions used in the model, please see the Appendix at the end of this blog.

New Jersey Animal Shelters Contain Enough Space to Save All of New Jersey’s Dogs and Many More from Other States

New Jersey’s animals shelter system has enough space to save all of the state’s healthy and treatable dogs. The table below details the targeted numbers of dog outcomes the New Jersey animal shelter system should achieve. Out of the 27,929 New Jersey dogs coming into the state’s animal shelters in 2013, 13,714 and 3,317 dogs should have been adopted out and sent to other shelters/rescues by the facilities originally taking the dogs in. However, other New Jersey animal shelters had more than enough capacity to rescue the 3,317 dogs from space constrained facilities. Thus, New Jersey animal shelters should be able to able to adopt out every single healthy and treatable dog taken in from the state and not require any support from rescue organizations without physical facilities.

New Jersey animal shelters have enough excess space to save many dogs from out of state as well. Specifically, New Jersey animal shelters had enough physical capacity to rescue and adopt out 12,352 dogs from out of state after achieving a 95% live release rate for New Jersey dogs. To put this number into perspective, New Jersey animal shelters could make both New York City and Philadelphia no kill cities for dogs and increase those cities’ dog live release rates to 95% as follows:

  • New York City – 1,771 additional dogs need saving
  • Philadelphia – 2,937 additional dogs need saving

Additionally, New Jersey animal shelters could save another 7,644 dogs from other locations outside of the state. Of course, some New Jersey animal shelters do pull some dogs from New York City and Philadelphia animal control shelters. However, most of these dogs are likely easy to adopt and therefore have short lengths of stay. As a result, the additional number of dogs New Jersey animal shelters could save from New York City, Philadelphia and elsewhere is probably not much lower than the figure above. Thus, New Jersey animal shelters could make New Jersey a no kill state for dogs as well as many other places.

These adoption goals are quite achievable when comparing the performance of well-run animal control shelters across the country. New Jersey animal shelters would only need to adopt out 3.30 dogs per 1,000 people in the state (1.91 dogs if no dogs rescued from out of state). As a comparison, recent per capita dog adoption numbers from several high performing no kill open admission shelters are as follows:

  • Nevada Humane Society (Reno, Nevada area) – 8.5 dogs per 1,000 people
  • Charlottesville-Albemarle SPCA (Charlottesville, Virginia area) – 9.0 dogs per 1,000 people
  • Longmont Humane Society (Longmont, Colorado area) – 9.1 dogs per 1,000 people

Thus, many communities are already adopting out nearly three times as many dogs as the goal set for New Jersey animal shelters.

Some naysayers may claim New Jersey would have a more difficult time due to the state’s shelters taking in many pit bulls. However, this is a myth. My model estimates New Jersey animal shelters would need to adopt out roughly 0.70 pit bulls per 1,000 people to save 95% of New Jersey’s dogs. Our shelters would only need to adopt out 1.81 pit bulls per 1,000 people if New Jersey shelters also rescued and adopted out the targeted number of pit bulls from other states. As a comparison, I estimate Longmont Humane Society adopts out 2.14 pit bulls per 1,000 people based on its per capita pit bull intake and the percentage dog adoptions are of total outcomes at the shelter. Furthermore, the pit bull adoption targets are even more reasonable given the model assumes there are roughly 2/3 less dogs to compete with in the adoption market in New Jersey than these other locations.

NJ Shelter Model 2013 (Local Targets 2)

Animal Deaths Vary Widely at New Jersey Animal Shelters

The goal of any properly managed animal shelter is to save all of its healthy and treatable animals. In some cases, such as selective admission rescue oriented shelters, it is pretty easy to not kill animals. In addition, other animal shelters with easy to service animal control contracts (i.e. few animals impounded, most strays quickly returned to owners) can avoid unnecessary killing due to having lots of extra space. As a result, some shelters may have an easier time than others in preventing killing at their shelters.

The table below compares the targeted number of community dogs (strays, owner surrenders, cruelty/bite cases) euthanized and the estimated actual local dogs euthanized/killed, and who died or went missing. Consistent with the Life Saving Model’s assumptions, the estimated actual dogs euthanized/killed/died/missing figure assumes these dogs came from the local community. All dogs missing are assumed “dead” based on the assumption they died or went to a very bad place. Shelters having less and more than the targeted amount of dog deaths are highlighted in green and red in the table below.

Surprisingly, several rescue oriented shelters’ death totals exceeded the targeted numbers. While this number may be higher if some rescued dogs are euthanized/killed (i.e. targeted number assumes no rescued dogs are), this may possibly point to overly strict temperament testing at these facilities. In the case of St. Huberts – Madison, which has a total dog death rate of 4% (i.e. percentage of all dogs taken in and not just community dogs), the total death rate may be artificially depressed by easy to adopt transported dogs. For Humane Society of Atlantic County, which has no animal control contracts, the total dog death rate of 24% is shockingly high for a rescue oriented shelter and raises serious questions about how life and death decisions are made by this organization. Other rescue oriented shelters, such as Ramapo-Bergen Animal Refuge and Common Sense for Animals, have significantly fewer deaths than targeted. The aforementioned shelters take a similar percentage of their dog intake from other shelters:

  • Ramapo-Bergen Animal Refuge – 67%
  • Common Sense for Animals – 63%
  • Humane Society of Atlantic County – 67%
  • St. Huberts – Madison – 69%

Thus, I find it difficult to believe St. Huberts – Madison’s and Humane Society of Atlantic County’s larger than expected number of dogs dying or gone missing is due to them rescuing a large percentage of their dogs from other shelters.

The largest number of dogs unnecessarily dying occurred at a relatively small number of shelters. Specifically, 12 out of 98 or 12% of the shelters accounted for 83% of the 3,603 unnecessary dog deaths. Shelters with the greatest number unnecessary dog deaths are as follows:

  • Associated Humane Societies – Newark (553)
  • Camden County Animal Shelter (386)
  • Cumberland County SPCA (346)
  • Gloucester County Animal Shelter (310)
  • Paterson Animal Control (276)
  • Trenton Animal Shelter (220)

Furthermore, if additional unaccounted for dogs discussed in my previous blog are counted in the death totals, the number of unnecessary dogs deaths rises from 3,603 to 4,731 statewide. Associated Humane Societies – Newark’s number of unnecessary deaths jumps from 553 to 805 dogs assuming these additional unaccounted for dogs died.

NJ Shelter Model 2013 for Blog (kill)

NJ Shelter Model 2013 for Blog (kill) (2)

NJ Shelter Model 2013 for Blog (kill) (3)

Space Constrained Facilities Not Receiving Enough Support from Rescues and Other Animal Shelters

Some animal shelters will require more support from rescues and animal shelters with excess space than others. If a shelter has relatively high intake, very limited space, and few stray dogs returned to owners, it will need more help than other shelters. The table below compares the number of dogs a shelter should transfer to other organizations per the model and the number of dogs actually sent to other animal welfare groups. Shelters marked in green are receiving less than the expected rescue support while facilities marked in red are receiving too much rescue help.

Overall, New Jersey shelters are not receiving enough help from other animal welfare organizations. While the overall number of dogs rescued was only about 11%-12% lower than needed, the actual number was higher since many dogs were rescued from facilities who did not need any rescue assistance. Only 16 out of the 102 facilities require any rescue support. In other words, 86 of the 102 animal shelters in the state should not need rescues or other shelters to pull any dogs. As a result, 1,756 dogs were not rescued from shelters who truly need that support and instead were pulled from shelters not requiring this help.

Shelters hogging up the most rescue resources were as follows:

  • Associated Humane Societies – Newark – 276 more dogs transferred than necessary
  • Burlington County Animal Shelter – 112 more dogs transferred than necessary
  • Humane Society of Atlantic County – 112 more dogs transferred than necessary
  • Cumberland County SPCA – 111 more dogs transferred than necessary

On the other hand, many space constrained shelters received far less rescue help than needed. Facilities who received the lowest amount of rescue support in relation to their needs were as follows:

  • Liberty Humane Society – 377 fewer dogs transferred than necessary
  • Trenton Animal Shelter – 252 fewer dogs transferred than necessary
  • Camden County Animal Shelter – 220 fewer dogs transferred than necessary
  • Elizabeth Animal Shelter – 209 fewer dogs transferred than necessary
  • Paterson Animal Control – 194 fewer dogs transferred than necessary

Unsurprisingly, these shelters had some of the highest dog death rates during the year.

Rescue groups and shelters with extra space should pull dogs from kill shelters with the highest rescue “target” numbers and deficits in the table below. If shelters not needing rescue support get that extra help, these shelters will not take the steps necessary to properly run their facilities. As a result of enabling poorly performing shelters and not pulling dogs from truly space constrained facilities, rescuing dogs from shelters with enough space leads to less lifesaving.

Shelters receiving less than needed rescue support should also examine their own policies and performance. Are the shelter’s operating processes allowing too many animals to get sick and therefore discouraging organizations to rescue their animals due to subsequent medical costs? Does the shelter actively reach out to rescues/other shelters and treat them with respect? Does the shelter make it convenient for other organizations to pull their animals?

Given killing animals for space is intolerable, the space-constrained shelters need to expand their effective dog capacity. These facilities could use extra space in their buildings to house dogs on a short-term basis. These shelters can enter into arrangements with local veterinarians to house and adopt out some dogs. Furthermore, shelters can create or expand foster programs to increase the number of dogs cared for. Additionally, creating a pet owner surrender prevention program and making serious efforts to return lost dogs to owners could free up space in these shelters. Finally, space-constrained shelters with multiple animal control contracts should terminate some of these arrangements to bring their capacity for care in line with the number of dogs they take in. As a result, space constrained shelters still need to take active steps to reduce killing rather than simply solely relying on rescue support.

NJ Shelter Model 2013 for Blog (killed)

NJ Shelter Model 2013 for Blog (killed) (2)

NJ Shelter Model 2013 for Blog (killed) (3)

Most New Jersey Animal Shelters Fail to Come Close to Reaching Their Local Dog Adoption Potential

We can assess each shelter’s contribution to making New Jersey and nearby areas no kill. While a shelter may be able to avoid killing healthy and treatable animals, it still may not live up to its potential for adopting out local dogs. On the other hand, a space constrained shelter may kill healthy and treatable dogs, but still do a good job adopting animals out.

The table below compares the number of dogs from New Jersey and nearby states each animal shelter should adopt out with the estimated number of local dogs actually adopted out.

Shelters with very limited space and high kill rates as well as rescue oriented organizations may look better than they actually are. For example, the model assumes the mix of dogs facilities are adopting out are the same as the types of dogs these groups take in. However, if these shelters only adopt out a very small number of dogs due to limited physical capacity, the dogs adopted out may be highly adoptable ones with much shorter lengths of stay compared to the majority of dogs these facilities impound. Similarly, many rescue oriented shelters likely pull much easier to adopt dogs than the bulk of dogs needing to get rescued from local facilities. Thus, the results from shelters with very limited capacity and rescue oriented organizations may look better than they actually are.

Few organizations reached or exceeded their adoption targets. Specifically, only 7 out of 102 shelters met the adoptions goals computed by the Life Saving Model. 2 of the 7 facilities reaching the adoption targets (Denville Township Animal Shelter and Warren Animal Hospital) had very few animals to place. Thus, the overwhelming number of New Jersey animal shelters need to step up their adoption efforts.

Several shelters exceeded their adoption targets. Old Bridge Animal Shelter had the most impressive results by far. This facility adopted out nearly 4 times the number of dogs targeted by the Life Saving Model and only euthanized 1% of all their dogs who had outcomes. Surprisingly, Livingston Animal Shelter adopted out the targeted number of dogs despite having a run down facility with limited adoption hours. The facility may have accomplished this by having a caring animal control officer who could place a relatively small number of dogs. Beacon Animal Rescue also exceeded its adoption target. While this organization is a rescue oriented group, the shelter appears to help more than easy to adopt dogs as pit bull type dogs currently make up about half of their dogs up for adoption. Perth Amboy Animal Shelter also deserves credit for nearly reaching its adoption target while only 3% of its dogs were euthanized. Only a few years before, 25% of Perth Amboy Animal Shelter’s dogs were killed by the prior shelter management.

Liberty Humane Society and Trenton Animal Shelter also exceeded their targeted number of local dog adoptions. These two facilities are space constrained shelters with high kill rates and the dogs they adopted out potentially may have been more adoptable than the bulk of their dogs. In the case of Liberty Humane Society, I’ve anecdotally observed them adopting out a large percentage of pit bulls and believe they are doing a good job on dog adoptions. Either way, both Liberty Humane Society and Trenton Animal Shelter are performing better than many other similar facilities and rescues/other shelters should support these organizations by pulling more dogs from Liberty Humane Society and Trenton Animal Shelter.

Many shelters with the ability to help other local shelters fail to do so. New Jersey animal shelters have the potential to rescue and adopt out nearly 5 times as many dogs as the number of dogs unnecessarily dying in the state’s animal shelters. Approximately 40% of the adoption shortfall is due to shelters not using their existing capacity to adopt out their own dogs or rescue dogs from space constrained nearby facilities. The other 60% of the adoption shortfall is due to shelters not adopting out animals as quickly as these organizations should. Thus, New Jersey animal shelters fail to even come close to their adoption potential.

Associated Humane Societies performance is particularly disappointing. Specifically, Associated Humane Societies has the physical capacity to end the killing of all healthy and treatable dogs in New Jersey. Associated Humane Societies adoption shortfall of 5,453 dogs significantly exceeds the 3,603 dogs unnecessarily losing their lives in New Jersey animal shelters. Even if all three Associated Humane Societies’ shelters used just 50% of their reported dog capacity, the organization could reduce the number of dogs unnecessarily dying in New Jersey animal shelters by nearly half per my model. Furthermore, Associated Humane Societies may put an additional strain on New Jersey’s animal welfare system by sending dogs to other facilities and rescues in the state when Associated Humane Societies has more than enough capacity to handle its dogs. Associated Humane Societies has the funding to reach these adoption targets as the organization took in nearly $9 million of revenue last year. This works out to over $450 of revenue per dog and cat I project the shelter should take in per my Life Saving Model. As a comparison, Nevada Humane Society, KC Pet Project, and Upper Peninsula Animal Welfare Society, which are no kill open admission shelters, took in only $225-$415 of revenue per dog and cat. Activists wanting to increase life saving in New Jersey should focus on changing Associated Humane Societies’ policies given the lifesaving potential of this organization.

Shelters transporting dogs from out of state also significantly failed to achieve their adoption targets for New Jersey dogs. In fact, shelters rescuing dogs from out of state facilities have a New Jersey dog adoption shortfall exceeding the number of New Jersey dogs unnecessarily dying in our state’s shelters. Not surprisingly many of these facilities’ total adoptions including transported dogs exceeded the local dog adoption targets as most transported dogs are easier to adopt. These transporting shelters’ local adoption performance is even worse considering most of these organizations likely take in much more adoptable local dogs than my model targets. In addition, the revenues these transporting shelters bring in from adoption fees and dramatic fundraising stories likely divert funding from New Jersey animal control shelters. Thus, it is quite clear most transporting shelters are not doing their part in helping New Jersey’s homeless dogs.

NJ Shelter Model 2013 for Blog (Loc adop)

NJ Shelter Model 2013 for Blog (Loc adop) (2)

NJ Shelter Model 2013 for Blog (Loc adop) (3)

Shelters Fail to Use Excess Space to Save Local Dogs

To further examine New Jersey animal shelters’ performance in saving the state’s homeless dogs, I compared the targeted number of dogs each shelter should pull from nearby shelters and compared it to the number actually rescued from local facilities. I assume all reported out of state rescued dogs came from southern or other far away states. While some of the out of state rescued dogs may have comes from nearby areas, I believe this is a small number and does not significantly impact the results.

Virtually all New Jersey animal shelters are failing to rescue the number of local dogs they should. 89 of the 102 shelters should rescue some dogs from other local shelters. In fact, 55 of the 89 shelters with targeted excess capacity failed to rescue even a single dog from a New Jersey animal shelter. Of the 89 shelters with the space to rescue dogs from nearby shelters, only Beacon Animal Rescue met or exceeded its local dog rescue target. While Animal Alliance and Ramapo-Bergen Animal Refuge appear to come close to their targeted local rescues, this is most likely due to these organizations pulling relatively few pit bulls. 80% of the targeted rescues are pit bulls while Animal Alliance and Ramapo-Bergen Animal Refuge only appear to have pit bulls representing around 20% of their dogs currently up for adoption. Thus, nearly all New Jersey animal shelters with targeted excess capacity are failing to do their share in ending the killing of local healthy and treatable dogs.

Shelters can overcome challenges in rescuing dogs from outside their service area. In some cases, municipalities may frown on government run shelters using taxpayer funds to rescue dogs from elsewhere. However, shelter directors at these facilities can encourage individuals to form a non-profit or raise money on their own to pay for these rescued dogs. Additionally, shelters with limited capacity or even some of the well-off private shelters could contribute funding for each dog rescued. For example, Maddie’s Fund paid an approximate $160 subsidy to rescues pulling dogs from New York Animal Care & Control. Similarly, private shelters with excess space, but limited financial resources, could expand their fundraising efforts to save more local dogs. Thus, perceived obstacles to rescuing local dogs can and should be overcome.

NJ Shelter Model 2013 for Blog (Rescued)

NJ Shelter Model 2013 for Blog (Rescued) (2)

NJ Shelter Model 2013 for Blog (Rescued) (3)

New Jersey Animal Shelters Need to Form Life-Saving Coalitions

The improper allocation of space within the state’s animal shelter system requires organizations to form coalitions. While putting a competent and compassionate director in every shelter would likely be even more effective, that will likely take time to do. No kill coalitions between animal control facilities and selective admission shelters have been used in places, such as Portland, Oregon, Reno, Nevada, Jacksonville, Florida and Austin, Texas to radically increase life saving. Maddie’s Fund, which has supported using coalitions for over a decade, has many resources for organizations seeking to collaborate with each other. Thus, New Jersey animal shelters need to formally work together, develop quantifiable and measurable goals (such as the targeted outcomes in this blog), and hold each organization accountable for meeting these goals.

Sobering Results Require Shelter Leaders to Critically Examine Themselves

New Jersey animal shelters’ dismal performance is even worse considering I used conservative assumptions. Organizations were not expected to return additional lost dogs to owners despite room for significant improvement. The targeted adoption lengths of stay ranged from 34-40 days for dogs taken in from the local community and 44 days for dogs rescued from other local shelters. However, some no kill open admission shelters adopt dogs out much more quickly. For example, I estimate dogs only take about 15 days to get adopted at Williamson County Animal Shelter in Texas based on their operating data and total average length of stay. Similarly, some no kill open admission shelters, such as Greenhill Humane Society and KC Pet Project, adopt out their pit bulls in much less time than the benchmark shelters used in this analysis. 50 days was used in my model, but Greenhill Humane Society’s and KC Pet Project’s (estimated) corresponding figures are around 40 days and 19 days. Additionally, creating successful pet retention and targeted spay/neuter programs could reduce local intake and allow shelters to rescue more dogs from elsewhere. Thus, New Jersey animal shelters could save significantly more animals than the targeted numbers I computed.

Shelters should examine the reasons why their adoption numbers fall far short of these benchmarks. In some cases, shelters, such as Woodbridge Animal Shelter, need to expand the hours they are open for adoptions. Many shelters should switch from an overly judgmental adoption process based on black and white rules to a conversational one focused on educating the adopter. Organizations will need to radically increase their off-site events and do same day adoptions. Similarly, many shelters must reduce adoption fees and run frequent promotions. Executive Directors should monitor the latest life-saving programs on Maddie’s Fund’s, ASPCA Pro’s, and the Best Friends National Conference’s web sites and put some of these policies into place. Shelter management teams will need to ensure their facilities are clean and customers are treated with respect (this can be measured by encouraging the public to complete surveys). Thus, poorly performing shelters need to stop making excuses and do what it takes to reach their adoption potential.

Shelters truly wishing to save lives should be ecstatic with the results from this analysis. The organizations have the potential to save far more lives than they ever thought were possible. Will the leaders of these facilities take the initiative to improve their performance as anyone with a job outside of animal sheltering would do? Thousands of lives depend on the answer to this question.

We should support shelters financially and with our precious free time who answer this question correctly. Ralph Marston said:

Don’t lower your expectations to meet your performance. Raise your performance to meet your expectations. Expect the best of yourself, and then do what is necessary to make it a reality.

We can turn New Jersey, New York City and Philadelphia into no kill communities. It is time we give our money and volunteer efforts to organizations who raise their performance to help us reach that goal. To do otherwise, would betray all the animals whose lives are on the line.

Appendix – Life Saving Model Assumptions

The Life Saving Model utilizes the following basic animal shelter population equations to calculate the targeted dog outcomes for each facility:

Daily capacity or population = Daily animal intake x average length of stay

Average length of stay = Daily capacity or population/daily intake

Each shelter’s community dog intake (i.e. owner surrenders, strays, cruelty bite cases), number of dogs returned to owners, and maximum dog capacity were taken from its 2013 “Shelter/Pound Annual Report” submitted to the Office of Animal Welfare. Unfortunately, 2014 data will not be available until Fall 2015.

This data was then used as follows:

  • Community dog intake and dogs returned to owners were initially estimated for each month by dividing the annual figures by 12. In order to take into account the extra space in low intake months and reduced space in high intake months, we multiply that number by each month’s percentage of the average month. For example, assume 240 dogs were taken in during the year and the average month equals 20 dogs (240/12). In July, the dog intake is 120% higher than the average month and we therefore multiply 20 dogs by 1.2 to equal 24 dogs. If 120 dogs were returned to owners during the year, the estimated number of dogs returned to owners in July would equal 12 dogs (120/12 = 10; 10*1.2). The monthly intake percentages were based off 2013 dog intake data on the New York Animal Care & Control web site.
  • The estimated number of community dogs returned to owners each month are then assumed to stay 5 days on average at shelters based on data from other shelters across the country. If anything, this estimate is conservative (i.e. average length of stay for dogs returned to owners may be less than 5 days and therefore frees up more shelter space for adoptions) based on some shelters returning the bulk of their dogs to owners within 3 days.
  • The number of community dogs euthanized (including animals who died or are missing) is set to equal 5% of intake. 5% is a reasonable standard euthanasia rate for shelters in New Jersey to meet given few vulnerable stray puppies (i.e. who could die or require euthanasia) arrive in the state’s animal shelters. The average length of stay for euthanized dogs is assumed to equal 14.5 days. Half of dogs are assumed euthanized for untreatable aggression towards people and 21 days is the time estimated to make that determination. The other half of dogs are assumed euthanized for severe and untreatable health issues and I estimate these dogs are euthanized after 8 days (subsequent to the end of the stray and owner surrender hold periods).
  • Adopted dogs are assumed to stay at shelters for varying lengths of time. Adoption length of stay was based on data from a study in the Journal of Applied Animal Welfare and the figures used are located in a prior blog on pit bull adoption. The data primarily comes from Tompkins County SPCA during a time it saved over 90% of its dogs. This was a fairly conservative data set to use as other no kill open admission shelters’ average length of stay are substantially shorter. Specifically, the following assumptions were made:
    1. 80% and 20% of each communities dogs (including pit bulls) were adults 1 year and older and under 1 year.
    2. Pit bulls were assumed to comprise 50%, 35% and 25% of community dog intake at poor, middle/upper middle class, and wealthy area animal control shelters. While some shelters may have pit bulls comprising more than 50% of their shelter dog population at a given time, this is due to pit bulls longer average length of stay. For example, a shelter with pit bulls making up 50% of their dog intake and pit bulls having an average length of stay three times longer than other dogs will have pit bulls constituting 75% of the dog population. Shelters without animal control contracts were assumed to only have pit bulls make up 10% of their community dogs (i.e. strays and owner surrenders) based on most of these shelters’ highly selective admission practices.
    3. Pit bull length of stay was taken directly from the Journal of Applied Animal Welfare study. The average lengths of stay for other breeds from this study were averaged and used for dogs other than pit bulls in the analysis
  • Dogs transferred to rescue or other facilities are assumed to stay at shelters 8 days on average based on the assumption strays can’t be released until the 7 day hold period elapses.
  • Community dogs not returned to owners or euthanized are initially assumed as adopted for each month. However, if the calculated length of stay exceeds the shelter’s required length of stay, dogs are moved from adoption (i.e. with a longer length of stay) to rescue (i.e. shorter length of stay) until the calculated length of stay each month approximately equals the required length of stay.
  • Required length of stay = Shelter’s reported capacity/adjusted daily intake for the month. Adjusted daily intake for month = Adjusted monthly intake per first bullet above/the number of days in the month.
  • Shelters with excess capacity are assumed to use the extra space to rescue and adopt out dogs from other New Jersey animal shelters. To the extent all healthy and treatable New Jersey animal shelter dogs are saved, I assume additional dogs are pulled from nearby states with similar types of dogs. I assume all rescued dogs will not be killed since the transferring and receiving shelters should evaluate these dogs’ behavior. Based on pit bull type dogs having longer lengths of stay at shelters, I assume 80% of dogs rescued from local animal shelters are pit bulls and 20% are non-pit bulls. 80% and 20% of pit bull and non-pit bull type dogs are considered 1 year and older and under 1 year. The average length of stay for rescued pit bulls and other dogs are the same as above.
  • Each month’s targeted outcomes are added to determine how many local dogs New Jersey animal shelters should adopt out, send to rescue, rescue from other nearby animal shelters and euthanize.

New Jersey Animal Shelter Statistics Are Far Worse Than Previously Thought

Photo of discarded dead animals from a 2009 Office of Animal Welfare inspection report of Associated Humane Societies – Newark. The Executive Director at the time is still in charge of this shelter today.


Most New Jersey animal shelters voluntarily report detailed data to state authorities. Last August, I shared New Jersey’s animal shelters summary statistics on my Facebook page. Each year, the New Jersey Department of Health’s Office of Animal Welfare requests each licensed animal shelter in the state to submit animal shelter data for the previous year. Animal shelters voluntarily submit this data in the “Shelter/Pound Annual Report.” The Office of Animal Welfare takes these Shelter/Pound Annual Reports and compiles the number of dogs, cats and other animals impounded, redeemed, adopted and euthanized to prepare its Animal Intake and Disposition report. However, the Shelter/Pound Annual Reports include additional information on how animals were impounded (i.e. strays, owner surrenders, rescued from in-state facilities, rescued from out of state shelters, and cruelty/bite cases) and disposed of (i.e. returned to owner, adopted, sent to rescue/another shelter, and died/missing). Additionally, the Shelter/Pound Annual Reports include the number of animals in shelters at the beginning and end of the year as well as the maximum number of animals facilities can hold. Thus, the Shelter/Pound Annual Reports include very important data not found in the Office of Animal Welfare’s summary report.

I compiled the data from these reports and analyze the results in this blog. 2013 statistics for each New Jersey animal shelter are listed at this link.

Garbage Data Raises Serious Questions About New Jersey Animal Shelters’ Statistics

Several animal shelters, which reported statistics in prior years, failed to submit data in 2013. Specifically, Summit Animal Clinic in Union City, Associated Humane Societies – Tinton Falls, Mercerville Animal Hospital and Angel Pets Animal Welfare in Woodbridge disclosed this data in 2012, but did not do so in 2013. Additionally, East Orange Animal Shelter has never submitted Shelter/Pound Annual Reports to the state, but did share limited data with The Record newspaper. These shelters failure to disclose data raises serious questions. For example, are they trying to hide embarrassing statistics from the public? I’ve included these shelters’ 2012 data, and in the case of East Orange, its limited 2013 data in my analysis. Also, I performed my analysis without these shelters as well. Unless indicated below, I’ve included these shelters’ data in the analysis under the assumption the statistics would be similar if submitted to the Office of Animal Welfare in 2013.

Most New Jersey animal shelters do not properly account for their animals. Simple math dictates the number of animals at a facility at the beginning of the year, plus all animals coming in during the year, less all animals leaving for the period, should equal the number of animals a shelter has at the end of the year. Stunningly, 69 out of 100 shelters reporting these dog statistics and 71 out of 98 facilities submitting this cat data failed to get this right. This raises serious questions about the accuracy of these shelters’ reported statistics. Even worse, 54 of the 69 shelters with flawed dog statistics and 46 of the 71 facilities with incorrect cat statistics should have had more animals at the end of the year then reported. While these errors could have been due to incorrect counts of the number of animals at facilities, the more likely answer is many outcomes, such as animals killed, dying, or gone missing, were not recorded. Given 71% of the errors were due to shelters having less rather than more animals on hand at the end of the year than they should have had lends credence to the theory that errors were mostly due to shelters failing to account for various outcomes. To put it another way, 3,231 cats and dogs should have had outcomes reported and did not. Thus, there is the potential that as many as 3,231 additional dogs and cats were killed, died or went missing from New Jersey animal shelters than were reported in the last year.

Shelters may have failed to classify animals adopted out and sent to rescue properly. Both Paterson Animal Control and Elizabeth Animal Shelter reported no animals were sent to rescues and all dogs and cats leaving their facilities alive were owner reclaims or adoptions. However, rescues I know who work closely with these two facilities told me both shelters rarely adopt animals directly to the public. This makes sense as neither shelter advertized animals for adoption (i.e. no adoption web site or social medial pages) in 2013. One has to wonder how many other facilities failed to properly classify adoptions and rescues properly. This data is very important as it provides details on the burden rescues and other shelters are taking from these facilities.

We need better oversight of New Jersey animal shelters’ data reporting. Currently, these statistics are voluntarily reported and most shelters are not taking this seriously. For example, I noticed a large number of reports were submitted many months after the end of the year. This data should be easy to compile since facilities can utilize animal shelter software programs, some of which are free, to do this task. Furthermore, New Jersey animal shelter laws mandate facilities maintain much of the raw data found in the Shelter/Pound Annual Report. Unfortunately, Office of Animal Welfare inspections routinely find shelters do not properly keep records on animals. We need to make the Shelter/Pound Annual Report mandatory for animal shelters along with serious penalties for significant errors (especially if deliberate). In order for animal shelters to take data reporting seriously, we may also need to require audits of these reports. Thus, these results show we need stronger laws and the Office of Animal Welfare to play a greater role in ensuring reported animal shelter statistics are in fact accurate.

Despite the errors in these reports, the data provided still reveals important information.

More Animals Losing Their Lives in New Jersey Animal Shelters Than Previously Believed

The more detailed data in the Shelter/Pound Annual Reports allows one to more critically examine the percentage of locally impounded animals dying in New Jersey’s animal shelters. The following table summarizes my analysis of the kill/death rate calculated from the Office of Animal Welfare’s summary report and the data reported in the Shelter/Pound Annual Reports.

Totals

The Animal Intake and Disposition report prepared by the Office of Animal Welfare only allows one to calculate the number of animals killed as a percentage of total animals impounded or intake. I prefer calculating the kill rate as a percentage of outcomes rather than intake as this metric directly compares positive and negative outcomes. Using intake depresses the kill rate since shelters can simply hold animals for a long time to the point of overcrowding. Calculating kill rate based on outcomes rather than intake increases the dog kill rate from 13.4% to 13.9% and the cat kill rate from 38.5% to 39.2%.

To calculate the statewide kill rate, we must also back out transfers from one New Jersey animal shelter to another state facility to avoid counting animals still in the state’s shelter system or registering two outcomes for the same animal (i.e. one New Jersey animal shelter transfers a dog or cat to another state facility who then adopts out the animal). This adjustment increases the dog kill rate from 13.9% to 14.5% and the cat kill rate from 39.2% to 40.8%.

In addition, we should increase the kill rate for animals dying or gone missing in shelters. I label this metric the death rate as these animals are likely dead or in a very bad situation. After making this adjustment, the dog death rate increases from 14.5% to 15.5% and the cat death rate rises from 40.8% to 46.8%.

Also, many shelters transport easy to adopt animals from out of state which artificially increases save rates. To properly calculate the percentage of New Jersey animals losing their lives, we need to adjust for transports. Unfortunately, shelters don’t break out their save rates by local and out of state animals. However, most likely nearly all of the out of state animals (primarily puppies and easy to adopt dogs) make it out of shelters alive. Therefore, I back out the number of out of state transports to estimate the local death rate. This adjustment increases the New Jersey dog death rate from 15.5% to 18.9% and the state cat death rate from 46.8% to 47.4%.

Also, I estimate a maximum local death rate by including the number of unaccounted for animals described in the section above. Making this adjustment increases the maximum potential New Jersey dog death rate from 18.9% to 22.1% and the maximum potential state cat death rate from 47.4% to 49.5%.

Finally, the maximum potential New Jersey cat death rate decreases slightly from 49.5% to 49.4% if I include the 2012 data from shelters who failed to report statistics in 2013 to the Office of Animal Welfare. Thus, the percentage of New Jersey animals losing their lives in our state’s animal shelters may be much higher than previously thought.

Death Rates Extremely High at a Number of New Jersey Animal Shelters

Dogs and cats are likely to lose their lives or go missing at a number of New Jersey animal shelters. Shelters with the highest death rates for dogs and cats are listed in the following tables:

NJ Shelter Rates Tables (6)

NJ Shelter Rates Tables (7)

Thus, both dogs and cats have a very good chance of leaving many New Jersey animal shelters dead rather than alive.

Many shelters fail to account for large numbers of their animals. As discussed above, a shelter’s number of animals at the end of the year should be calculated as follows:

Beginning number of animals + animals impounded – animals leaving the shelter

Unfortunately, a large number of shelters take in far more animals than they can explain where they went. Shelters having the highest numbers of unaccounted for dogs and cats are listed in the following tables:

NJ Shelter Rates Tables (8)

Unacct cats

Dog and cat death rates at many shelters may be even higher if these unaccounted for animals are counted as dead or missing. If we only consider animal shelters which don’t or rarely transport, facilities with the highest dog and cat death rates considering the unaccounted for animals described above are as follows:

NJ Shelter Rates Tables (2)

Max pot cats po

Thus, the plight of dogs and cats may be far worse in New Jersey animal shelters when we consider the unaccounted for animals.

Shelters Turn Their Backs on New Jersey’s Animals

New Jersey animal shelters rescue far more animals from out of state than other New Jersey animal shelters. Specifically, 5,676 dogs were transferred from out of state animal shelters compared to only 1,410 dogs taken in from other New Jersey animal shelters. While perhaps some shelters, such as Animal Alliance in Lambertville, take animals from nearby New York or Pennsylvania animal control shelters, the overwhelming majority of these dogs most certainly came from down south. In fact, New Jersey animal shelters transported more dogs from out of state than dogs who were killed in, died in or went missing from New Jersey animal shelters. This number does not include additional dogs transported in from out of state by rescues operating without a physical facility. Shelters transporting the most dogs from out of state were as follows:

NJ Shelter Rates Tables (5)

New Jersey animal shelters transported 642 cats from out of state while nearly 50% of cats in the state’s animal shelters were killed, died or went missing. Animal Welfare Association (280 cats received from out of state) and Mount Pleasant Animal Shelter (211 cats received from out of state) rescued more cats from out of state facilities than New Jersey animal shelters. In the case of Mount Pleasant Animal Shelter, the organization’s Executive Director told me these cats were rescued from New York Animal Care and Control. One can only hope the out of state cats rescued by other New Jersey animal shelters came from nearby New York and Pennsylvania facilities rather than from shelters far away down south.

Return to Owner Rates Better Than Average at Most Shelters

Return to owners (“RTO”) rates are one of the positive results from this analysis. Overall, the dog and cat RTO rates of 52% and 4% are approximately twice the national average. As I noted in my blog on reuniting lost pets with owners, return to owner rates are highly correlated with socioeconomic status. Wealthier people likely have more resources/knowledge to license and microchip their dogs. Similarly, people with greater incomes are more likely to afford reclaim fees or ransom payments to animal shelters. New Jersey’s RTO rates for dogs clearly fit this pattern with shelters serving wealthy towns returning most stray dogs to owners while urban shelters are only returning about one fifth of lost dogs to owners. Clearly, we need to help people in urban areas get microchips and ID tags on their dogs. Additionally, we need to create pet help desks at shelters in these cities to help people pay the reclaim fees, which are often mandated by the cities themselves, when necessary. The statewide cat reclaim rate, like figures from across the nation, is still very low and suggests shelters need to figure out better ways to get lost cats back to their families. New Jersey should allow shelters to transfer stray cats to rescues during the mandatory 7 day hold period since few are returned to owners at shelters. This would open up space to save more cats and reduce the chance of disease (i.e. cats spending less time in shelters are not as likely to get sick).

Shelters Leave Animal Enclosures Empty While Dogs and Cats Die

New Jersey animal shelters fail to use their space to save animals. Based on the average number of animals at all of New Jersey’s animal shelters at the beginning and the end of 2013, only 61% of dog and 66% of cat capacity was used. Given December is a low intake month, I also increased these populations to an average intake month. This adjustment only raised the dog and cat capacity utilization to 62% and 87%. These estimates likely overestimate the average capacity utilized as many facilities kill animals once they reach a certain population level. Many animal shelters with low kill rates failed to rescue animals with their excess space. Additionally, other shelters used little of their available space and still killed a large percentage of their animals. Some examples after increasing the population (and therefore capacity utilization) based on the adjustment discussed above are as follows:

NJ Shelter Rates Tables (11)

NJ Shelter Rates Tables (13)

Thus, many New Jersey animal shelters are killing dogs and cats despite having ample space to house these animals.

New Jersey’s animal shelters continue to fail the state’s animals. The state’s animal control facilities only impound 8.7 animals per 1,000 New Jersey residents. As a comparison, the average community in the country impounds anywhere from 14-30 animals per 1,000 residents based on estimates from Animal People Newspaper and the Humane Society of the United States. Despite New Jersey shelters impounding a fraction of the animals other no kill communities take in on a per capita basis, the state’s animal control facilities continue to kill and allow animals to die under their care. Even worse, many of these shelters can’t even properly keep track of how many animals leave their facilities dead or alive. Our state’s animals deserve far better treatment than this. Contact your local city council members and mayor and demand better from the animal shelter serving your community. We can do this so let’s get to work!

Merritt Clifton Uses Manipulative Math to Try and Discredit Nathan Winograd and No Kill

Renowned no kill and pit bull hater, Merritt Clifton, recently wrote an article downplaying Nathan Winograd’s no kill success. Clifton uses manipulative math and logic to argue Nathan Winograd’s no kill equation leads to less lifesaving than spay and pray and other archaic shelter policies.

Analysis Focuses on Shelter Animal Deaths Per 1,000 People Rather than Save Rates

Clifton bases his entire argument on shelter animal deaths per 1,000 people rather than shelter save rates. Per capita shelter kill rates certainly are an important statistic as they provide a perspective to the amount of killing in a community. However, per capita rates of shelter killing tell us nothing about how shelters are doing. Per capita shelter killing may decrease due to spay/neuter rates in the community at large, which may be due to socioeconomic status of the population or access to affordable spay/neuter resources outside of the shelter, or other external forces having nothing to do with shelter performance. Additionally, per capita kill rates tell us nothing about an animal’s prospects once it lands in a shelter. In other words, a shelter can kill a large percentage of the animals coming though its doors, but still have a low per capita kill rate. People want their shelters to save most of the animals coming into their facility. Animals having little chance of making it out alive of shelters rightfully disturbs many people. Thus, any comparative analysis of shelter performance must include save rates.

Clifton’s Own Preferred Metrics Show Nathan Winograd’s and No Kill’s Superior Performance

Clifton’s entire argument using total change in per capita kill rates ignores basic logic of any intelligent analysis. In a stunning example of lazy or deliberately deceptive logic, Clifton takes gross changes in per capita kill rates to assert Nathan Winograd wasn’t very successful. Unfortunately, the per capita kill rates were much different in these analyses and they require percentage change analysis. Specifically, per capita kill rates were so much higher in Clifton’s counterexamples to Nathan Winograd’s work at the San Francisco SPCA and Tompkins County SPCA that these kill rates had far more room to decline. However, we clearly can see Nathan Winograd outperformed Clifton’s counterexamples on an apples and apples comparison using percentages.

Clifton’s first misleading example compares Nathan Winograd’s performance at the San Fransisco SPCA with shelters nationally during the same period. As you can see, shelters nationally were killing far more animals than San Fransisco and therefore could decrease shelter killing in total more. However, we see on a percentage basis Nathan Winograd outperformed these shelters by nearly a 3-1 margin.

Merritt Clifton Nathan Winograd Analysis SF SPCA V1

Clifton’s second example is even more misleading. In this example, Clifton compares Nathan Winograd’s improvement in total per capita kill rate in San Fransisco with the period after he left. Clifton not only fails to use percentages, but uses a longer period to show Nathan Winograd’s results were not impressive. Once again, we clearly see the flaw in Clifton’s analysis when we compare the results on a percentage improvement per year basis. Specifically, Nathan Winograd’s save rate was 33% better per year. Additionally, Clifton fails to mention the per capita kill rate decrease at San Fransisco SPCA after Nathan Winograd left largely reflected lower intake, which has been a nationwide trend, and the save rate (percentage of animals impounded leaving alive) has not improved since Nathan Winograd left nearly a decade and a half ago. Clifton also failed to point out San Francisco’s save rate stagnated despite save rates nationwide dropping significantly during that same period.

Merritt Clifton Nathan Winograd Analysis SF SPCA V2

Clifton uses a similar misleading example comparing Nathan Winograd’s performance at Tompkins County SPCA with the period before he arrived. Once again, Clifton uses total rather than percentage improvement in per capita shelter killing rates and periods of differing length. After we adjust for these analytical errors, we see Nathan Winograd reduced per capita shelter killing at a rate over 6 times greater per year:

Merritt Clifton Nathan Winograd Analysis Tompkins

Finally, Clifton posts the most egregious of all comparisons. He compares the era of regressive kill shelter legend, Phillis Wright, with the era of Nathan Winograd’s No Kill Advocacy Center. In addition to the analytical errors above, Clifton also mistakenly assumes all shelters today are following the no kill equation. Even with this assumption stacked against no kill, the per capita kill rate decreased twice as much per year since the No Kill Advocacy Center’s arrival:

Merritt Clifton Nathan Winograd Analysis PW

Nathan Winograd and No Kill Had More Challenging Obstacles to Overcome

Nathan Winograd had to use new techniques to decrease shelter killing. In the previous periods, such as during Phyllis Wright’s era, spay/neuter rates were quite low. All shelters needed to do was point people where to get spay/neuter done and that alone would significantly decrease kill rates. For example, spay/neuter rates were quite low in the early 1970s, but currently dog and cat spay/neuter rates are up to 83% and 91% per nationally per the ASPCA. Additionally, shelters in Phyllis Wright’s era could easily adopt more animals out as massive numbers of highly adoptable animals were killed then. As a result, Nathan Winograd needed to enact innovative programs to further decrease killing. These policies required far more work, and hence met more resistance, from regressive and lazy shelter directors. Thus, Nathan Winograd decreased the rate of killing in a much more challenging environment.

Clifton makes another egregious error by claiming Tompkins County SPCA was doing great before Nathan Winograd arrived and achieving no kill was basically a piece of cake. Specifically, Clifton states the shelter had a below average per capita kill rate during that time. Based on Clifton’s per capita kill rate of 1.8 and Nathan Winograd’s 93% save rate at Tompkins County SPCA, that equates to an intake of 25.7 dogs and cats per 1,000 people. Tompkins County SPCA’s per capita intake during Nathan Winograd’s time was nearly twice the national per capita intake rate of 14 dogs and cats per 1000 people today per Clifton’s former newspaper. Assuming the per capita intake rate was the same during the year before Nathan Winograd arrived at Tompkins County SPCA, the Tompkins County kill rate would have been approximately 30%. Based on Austin Pets Alive’s data, most of the improvement from reducing the kill rate from 30% to 7% would have been due to saving more challenging animals, such as underage puppies and kittens, critically ill or injured animals and animals with behavioral problems. Thus, Nathan Winograd faced a far more difficult challenge if Tompkins County SPCA was doing as great as Clifton claims.

Finally, Clifton fails to mention the animals amazingly short average length of stay at Tompkins County SPCA under Nathan Winograd’s leadership. Nathan Winograd’s animals stayed on average 8 days at Tompkins County SPCA despite the facility being old and rundown when Nathan Winograd arrived. Clearly, getting nearly all of the animals safely out of your facility in 8 days on average would yield no kill results at almost any shelter.

Clifton Makes a 180 Degree Turn on Nathan Winograd

Merritt Clifton praised Nathan Winograd quite a bit not too long ago. In 2008, Clifton concluded his review of Nathan Winograd’s book, “Redemption, The Myth of Pet Overpopulation and the No Kill Revolution in America” by saying:

The loose ends barely matter. Winograd’s arguments would be only strengthened by using better data–and as it stands,  Redemption is probably the most provocative and best-informed overview of animal sheltering ever written.

Similarly, Clifton stated the following when Nathan Winograd ran Tompkins County SPCA:

Animal People, an independent publication, rated the Tompkins County Society for the Prevention of Cruelty to Animals as having the lowest number of animals euthanized per capita in the nation for the past two years. While the national average is 15 animals killed per 1,000 people, Ithaca had 1.9 in 2002 and 1.8 in 2003, said Merritt Clifton, editor of Animal People.

“It’s impressive to see an agency performing 10 times better than the national average,” Clifton said. “Knowing that the local SPCA is doing all it can to save the lives of the dogs or cats raises the level of the community’s satisfaction in the care for its animals.”

Clifton’s about face is quite telling. While we don’t know what is inside Mr. Clifton’s head, clearly Clifton has become anti-no kill. Most likely no kill is at odds with Mr. Clifton’s goal of eradicating pit bull type dogs. After all, numerous open admission shelters achieved no kill for pit bull type dogs alone. At the same time, Clifton has long been an animal welfare “journalist” and supporting outright killing of all pit bulls conflicts with that aspect of his career. Clifton’s play then would be the backdoor eradication through his vocal calls for pit bull sterilization using the bogus claims its for the protection of pit bulls. Thus, advocating only for spay and pray policies is how Clifton can reconcile his pit bull eradication position and his reputation as an animal welfare “journalist.”

Merritt Clifton’s donors for his new web site fit nicely into this ideology. Not surprisingly, Colleen Lynn, who runs the anti-pit bull dogbites.org website, donated to Clifton’s endeavor. The most telling donor is Ruth Steinberger, who advocates spay/neuter as the primary solution to shelter killing. However, Steinberger also believes shelters should NOT adopt out pit bulls using PETA like logic that all of them will be adopted by dog fighters:

“There is no other breed where people go to the shelter to victimize the animal,” said Steinberger.

As such, you just need to follow the money to see where Clifton’s positions come from. Luckily, Clifton no longer is the primary animal shelter commentator in the digital age. Additionally, Clifton’s sloppy and misleading analyses have further brought him to irrelevance. Thankfully, people finally see Clifton for what he truly is.

Linden Animal Control Fails Office of Animal Welfare Inspection

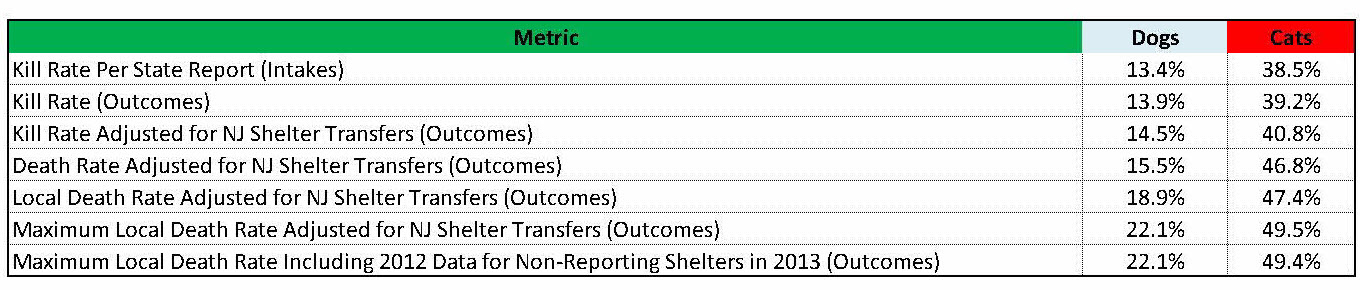
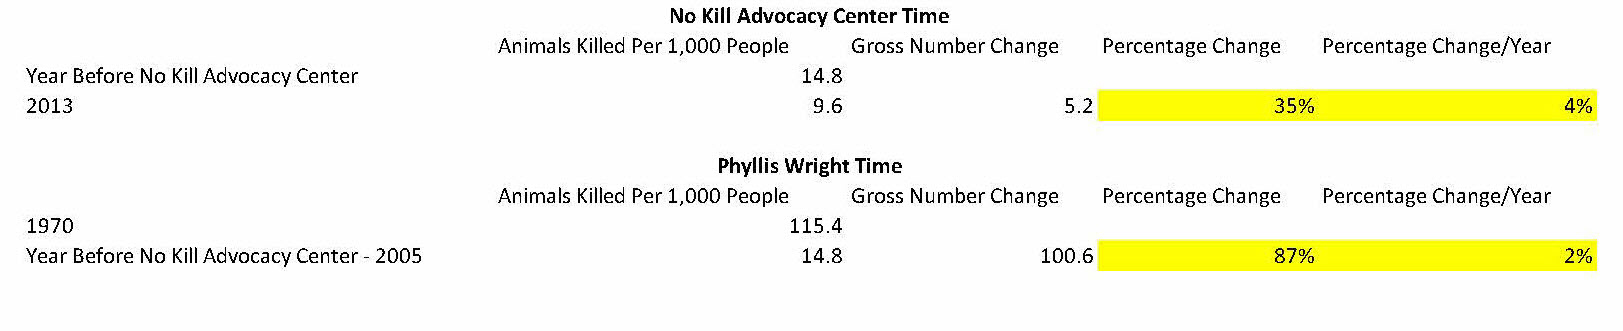
Linden Animal Control, which has had a terrible reputation for years, recently came under fire. At an April 15 City Council meeting, Robert Scutro and several other people passionately argued the shelter needed drastic changes (see 2 hour and 21 minute mark of the video). During the meeting, City Health Officer, Nancy Koblis, and City Council Member, Michele Yamakaitis, largely dismissed the concerns. Yamakaitis heads the Animal Control Committee which was formed to investigate and rectify Linden Animal Control’s issues. Elizabeth’s Health Department, at the request of Yamakaitis’s committee, found serious problems during a May 8 inspection. On July 23, New Jersey Department of Health’s Office of Animal Welfare, which typically conducts much more thorough inspections, visited the facility and failed Linden Animal Control. The city plans to shut the shelter down at the end of 2014, contract with another facility in 2015, and open a new shelter in 2016.

Linden issued a stunning press release after the Office of Animal Welfare inspection report. The city clearly attempted to downplay the shelter’s problems and make it seem as if they were on top of the issue. Basically, Yamakaitis stated the facility is run down, but animals aren’t being neglected. Mayor Richard Gerbounka blamed the issues on Union County not building a facility, but said all was good:

“Our facility certainly wasn’t the best in the area, but we attempted to maintain it with reasonable standards while Union County was proposing a county-wide facility. Many of these issues came with age, which would require larger scale remodeling with a large cost associated, and this remodeling would have been moot if Union County built a facility that would have not only been more modern, but larger.”

Yamakaitis made several general short-term recommendations, but all the recommendations are dependent on “materials, financing, and ability becoming available.” As a result, the recommendations are meaningless because they are not mandatory. Its like a 500 pound man saying “I’ll lose weight if somehow I end up eating healthier and exercising.” In other words, the recommendations are pointless.

Linden’s Animal Control Committee plans on building the new shelter with private funding. As you will see below, Linden Animal Control’s problems were primarily the result of the individuals in charge and we should not donate one cent to these same people.

Office of Animal Welfare Inspection Report Shows Problems Due to People Running the Shelter

The Office of Animal Welfare inspection report revealed little to no effort was made to clean the shelter. Despite only housing 7 dogs from animal control and a handful of cats, shelter staff did not pick up feces. Instead, they sprayed feces with a hose without removing dogs from adjacent kennels, resulting in chunks of feces and chemicals hitting animals. Even worse, spraying rather than scooping feces caused a toxic urine, feces, and chemical filled soup to pass by each animal. Given the trenches were not maintained, this feces, urine, and chemical brew just sat in front of all the animals to breathe in. As a result, Linden Animal Control’s staff allowed the animals to literally live in crap.

Linden Animal Control’s cleaning protocol used frighteningly toxic chemicals. In the report, one animal control officer admitted to using bleach at a concentration 32 times higher than required for safely cleaning with animals present in nearby kennels. In fact, the bleach concentration used with animals in the facility was 10 times higher than the level used to disinfect a facility with no animals present. Additionally, the inspector noted the high concentration of bleach was so corrosive it could have led to the deterioration of the building’s structure. Thus, Linden Animal Control exposed animals to hazardous levels of chemicals and may have contributed to the dangerous conditions of the building itself.

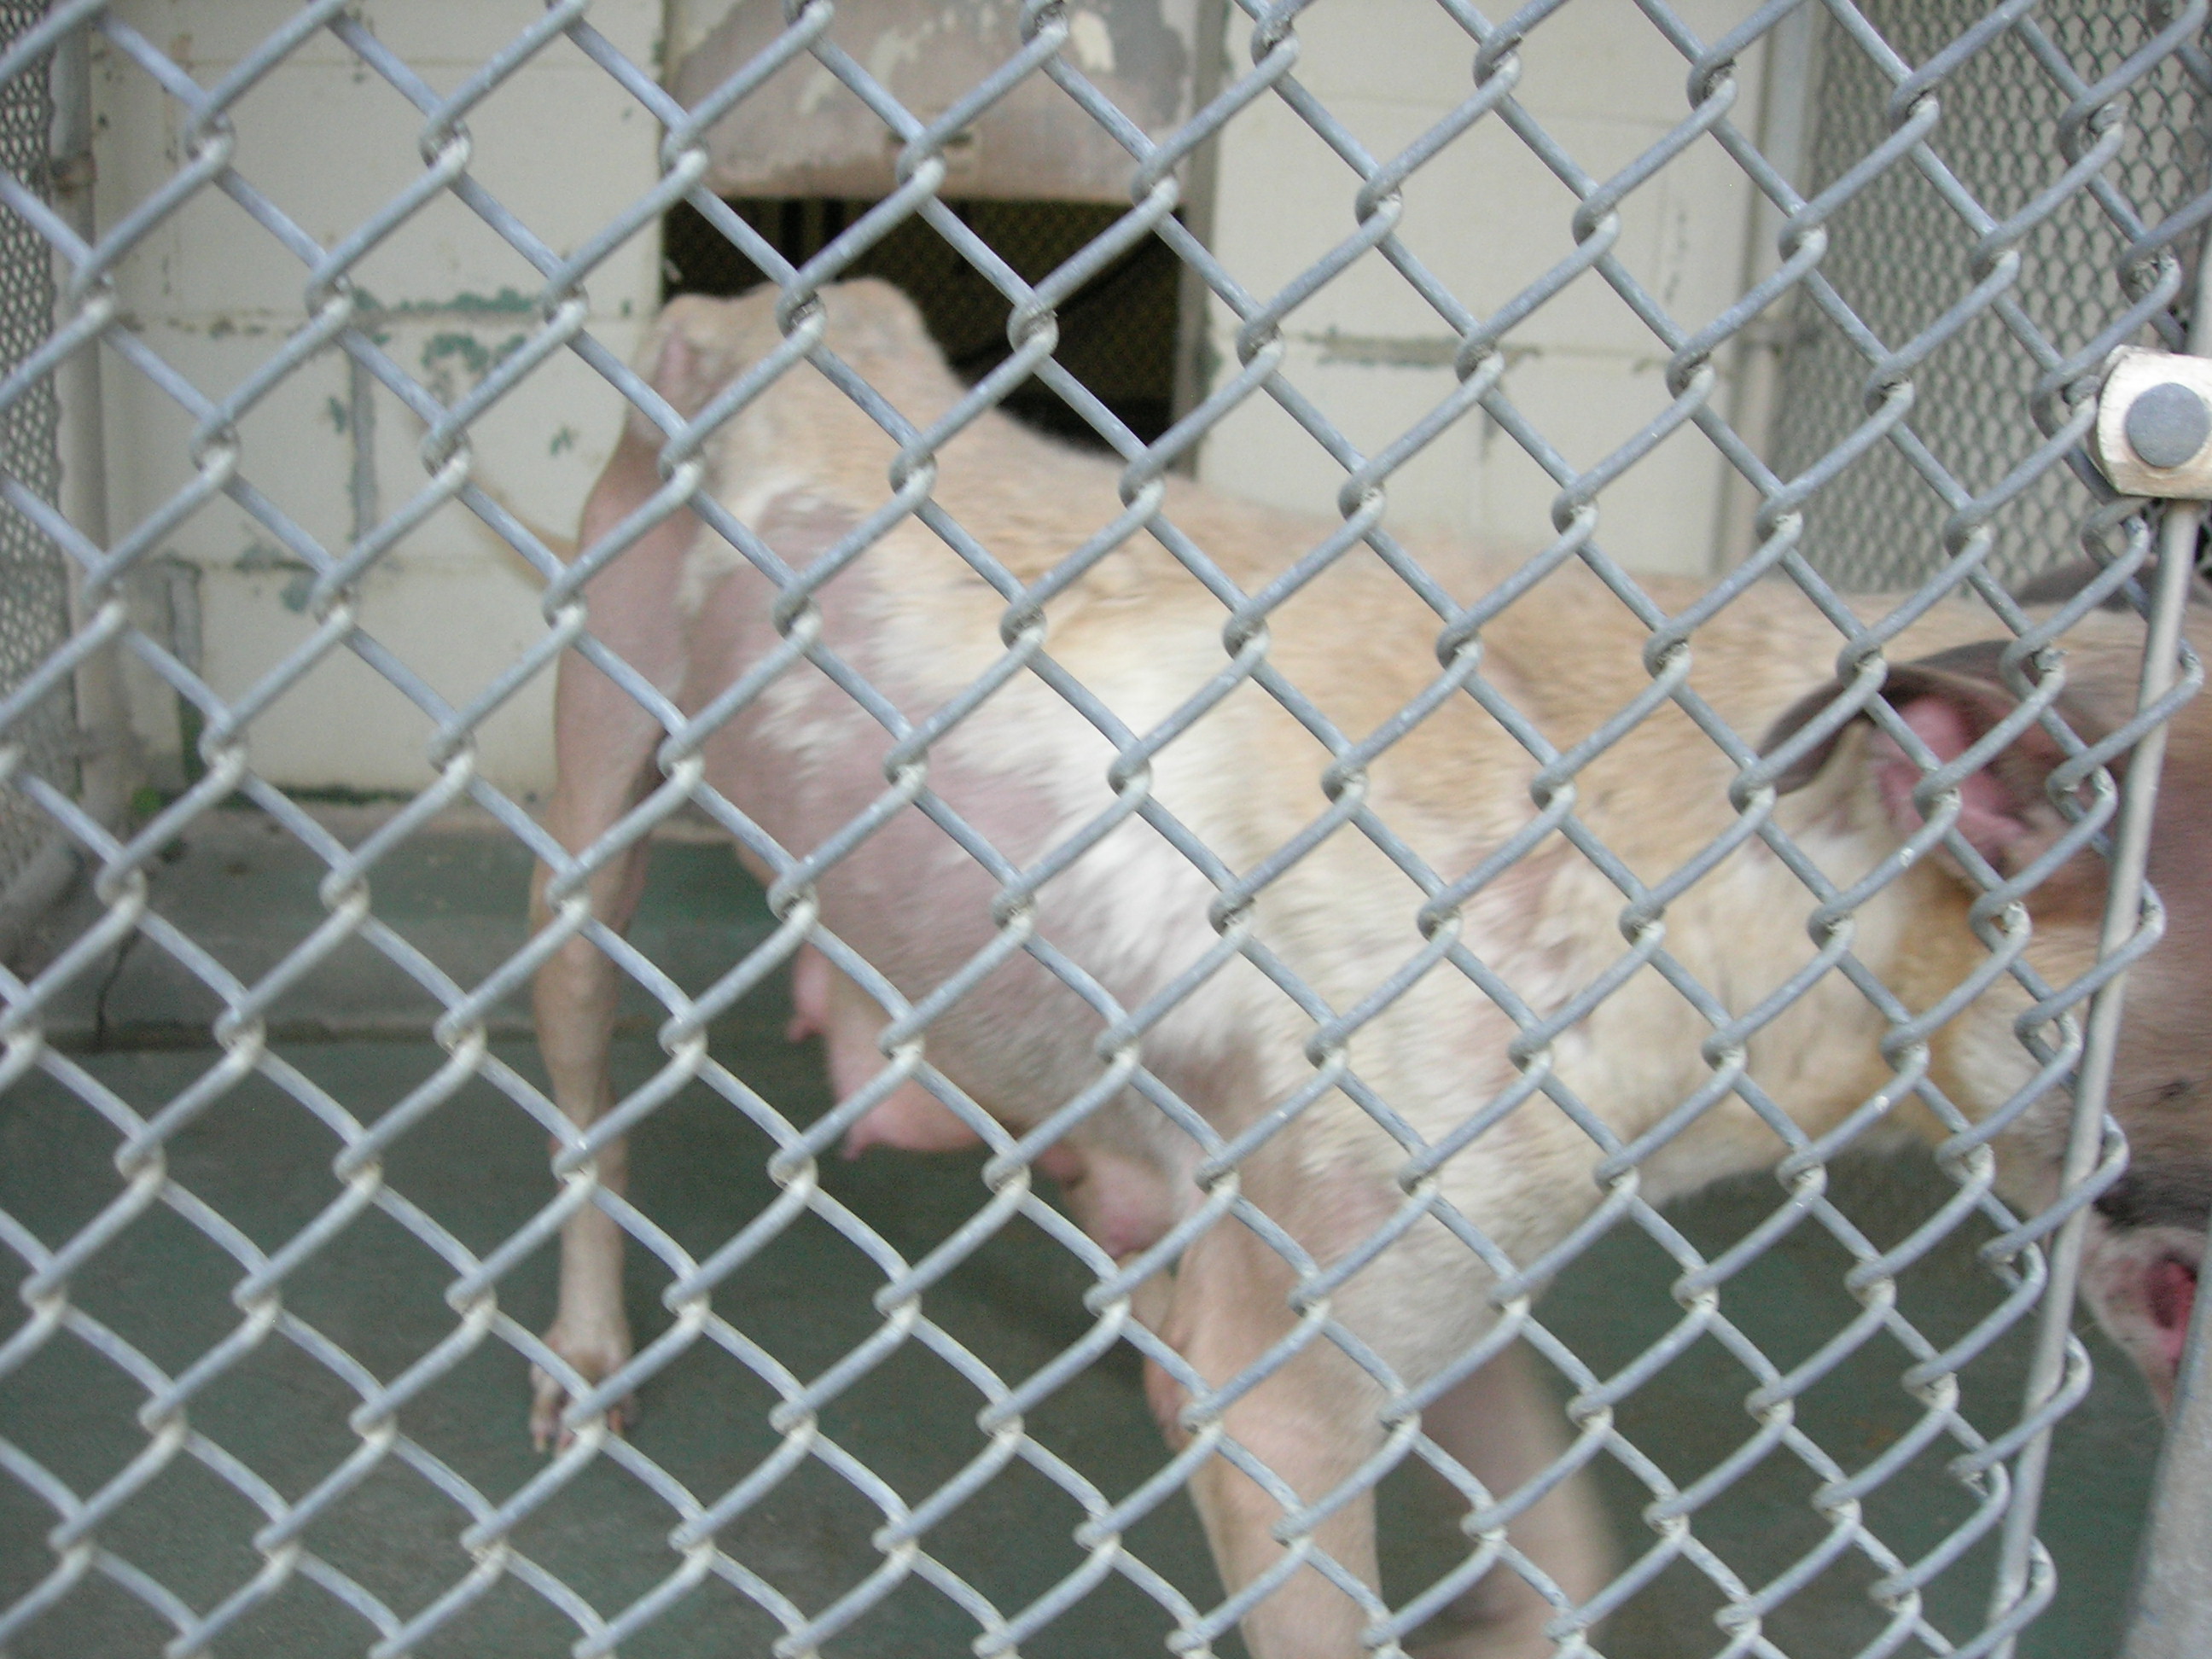
Linden Animal Control did little to contain or treat diseases at the shelter. The facility had no legally required isolation area for sick animals. Additionally no legally required disease control program was put in place by the alleged supervising veterinarian, Dr. Shukla of Rahway Animal Hospital. Also, nothing was being done to alleviate stress or provide for the psychological well-being of animals. In fact, Linden Animal Control had no records or documentation showing many animals received any medical treatment to “alleviate pain and suffering” as required by law. One dog who was lucky enough to see the veterinarian apparently did not receive its required medicine for various worms and Giardia as significant amounts of the medicine were missing during the inspection. The inspector also noted “this dog was not provided with any means of stress relief, such as separation or barriers to prevent the direct view of other dogs, soft bedding, and a clean, dry environment, free from the strong odor of urine and the scent of other bodily secretions that had permeated the porous concrete in the dog enclosures.” As a result, Linden Animal Control’s management did little to help the animals under its care.

2533 Exterior dog enclosures need repair; dog transferred to AHS

Linden Animal Control also failed to perform legally required procedures to reunite lost pets with their families. Records indicated animals were not properly scanned for microchips. Additionally, records proved numerous animals were not held the legally required 7 days. Holes in the ceiling allowed 10 cats to escape over 16 weeks from the Linden prison, which prevented their owners from finding the cats at the shelter. Also, the shelter was left open during the day when the ACOs were out allowing anyone to take any animal they wish.

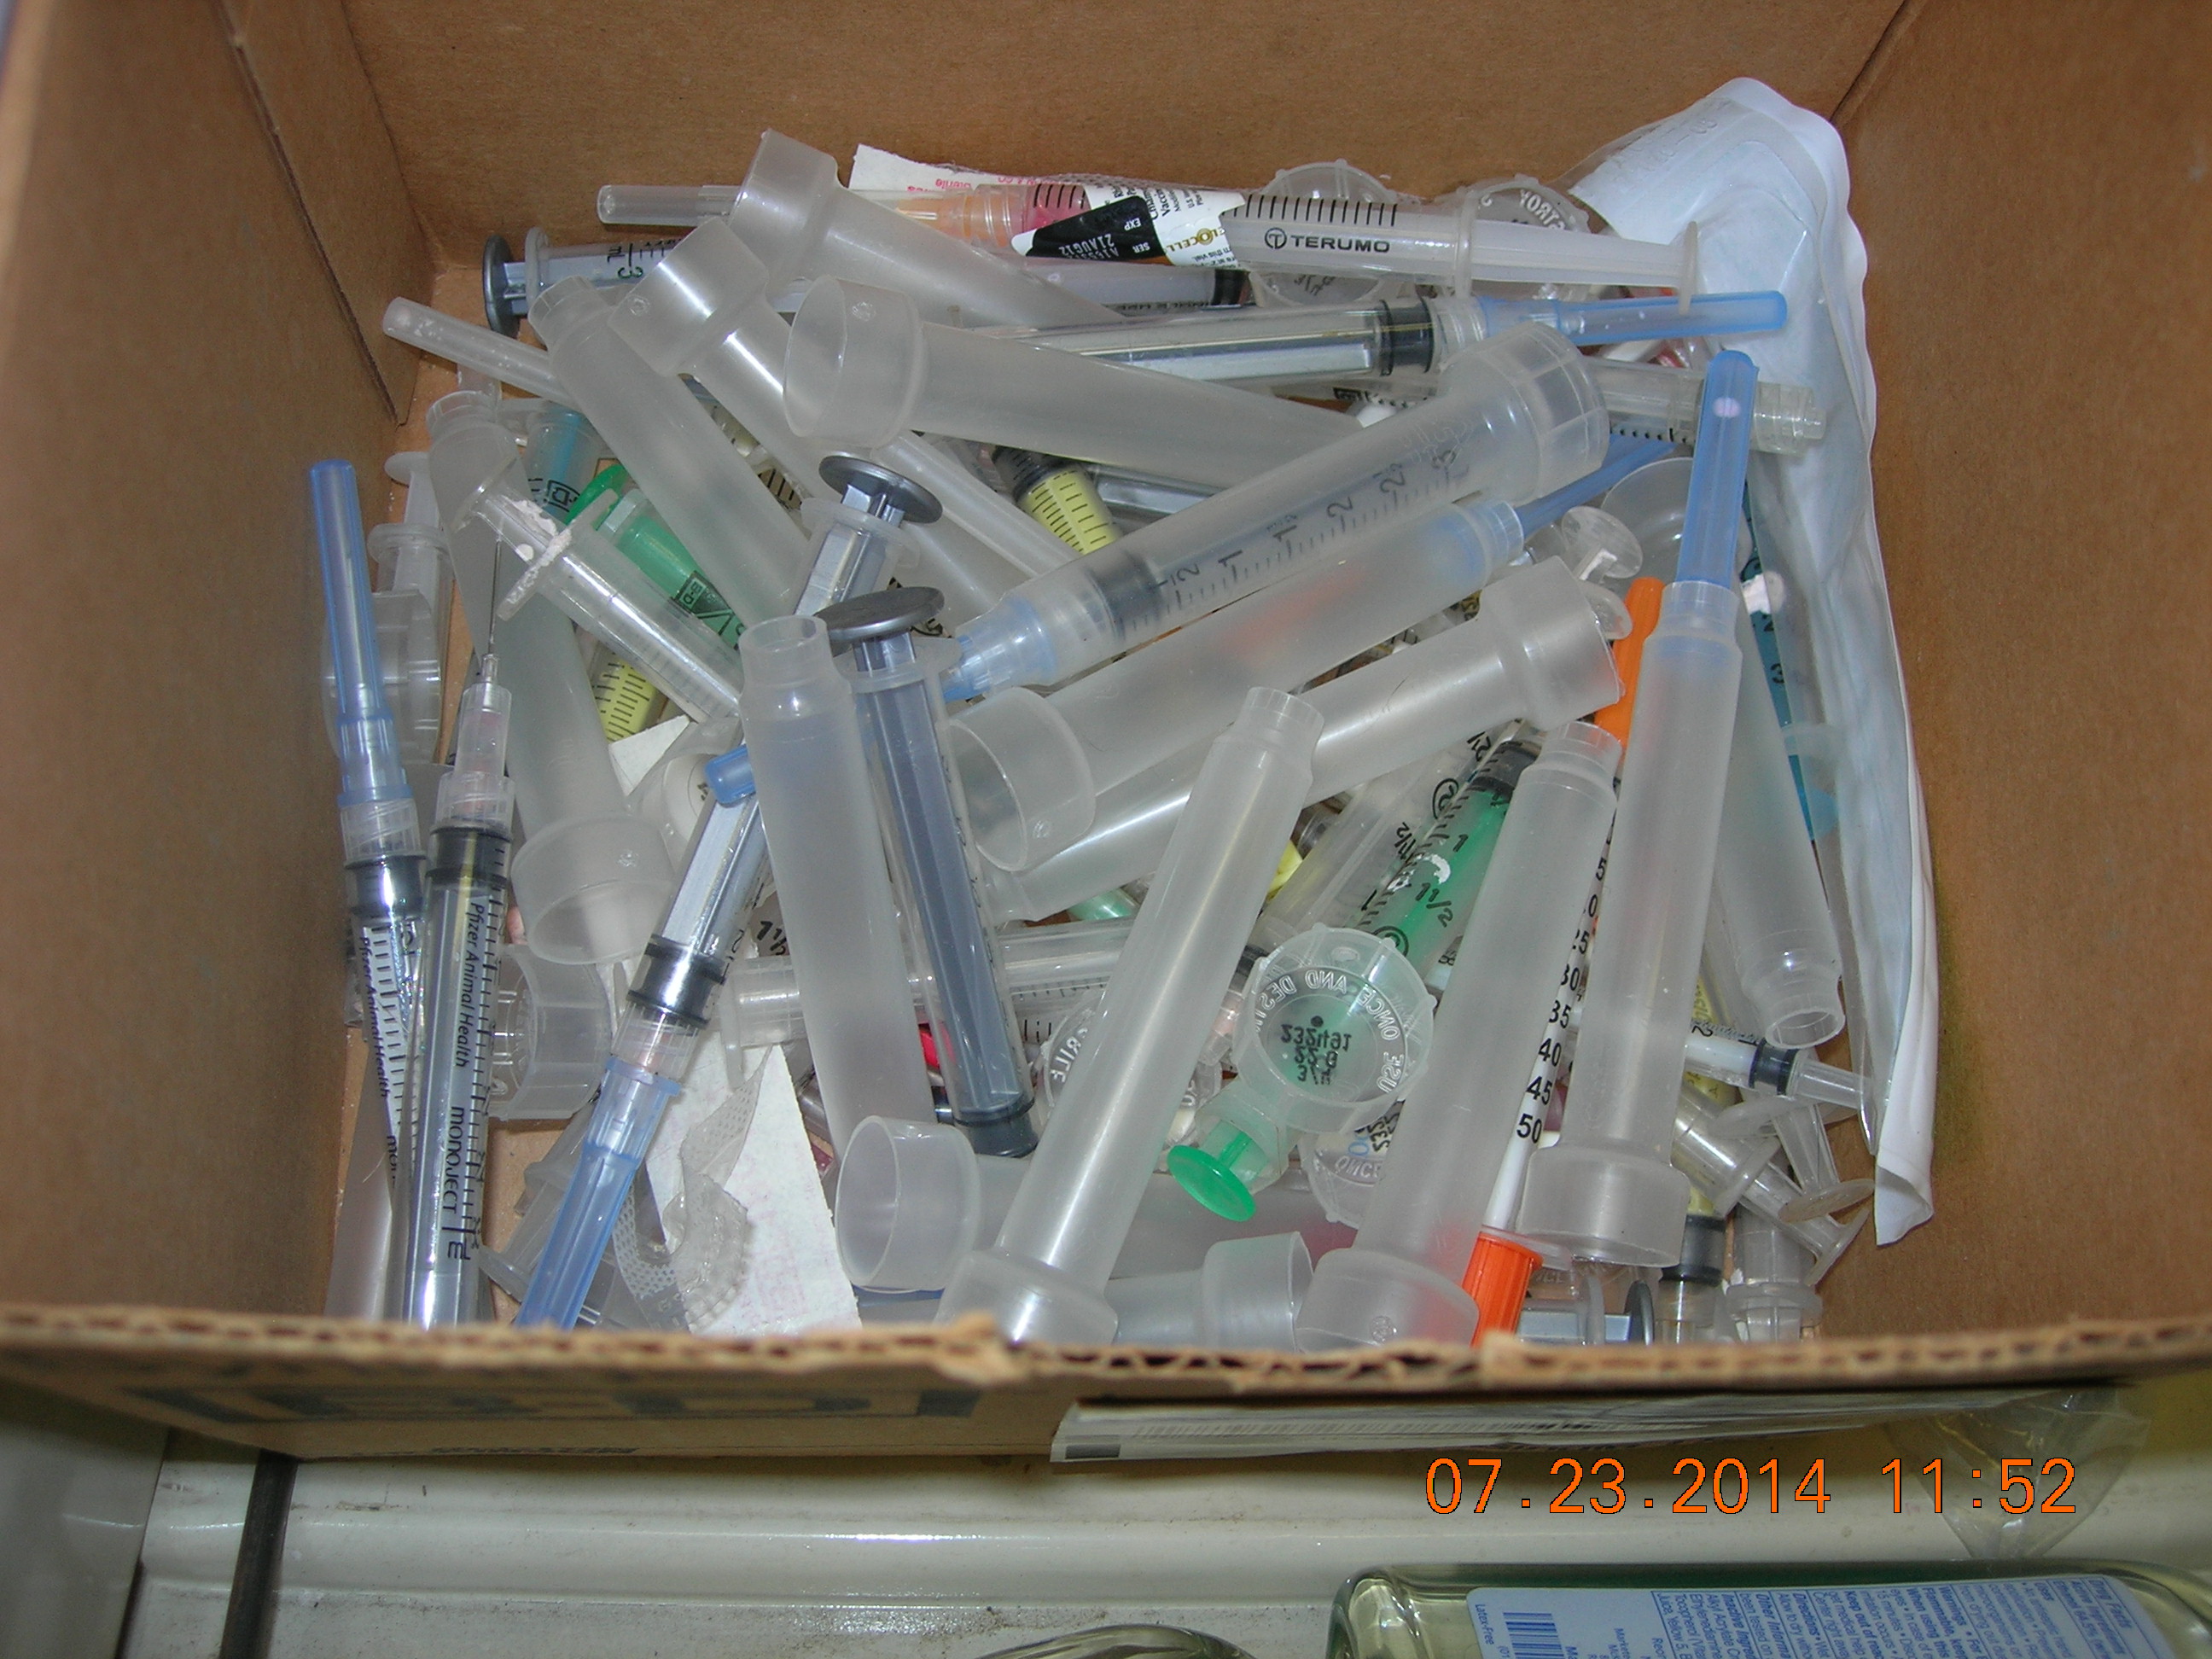
Linden Animal Control failed to document it humanely killed its animals. The shelter has no euthanasia room so animals can see, smell, and hear other animals being killed. No legally required euthanasia instructions, weighing animals for proper drug dosage, or method of killing were documented. Additionally, no one kept records of how these drugs were used as required by law. While City Council member Yamakaitis claimed animals are now being killed at Rahway Animal Hospital, the inspection showed Ketamine, which is widely abused drug, was dispensed and numerous used syringes were found.

2502 Ketamine

2504 Used Syringes in Drawer

Of course Yamakaitis also said “extremely injured or sick animals” are still killed at Linden Animal Control. I guess Linden has lots of “extremely injured or sick animals.” Good thing those pesky animals are suffering so much as Yamaitikis’s dream team can give them the wonderful gift of a cruel death in front of all their cell mates.

Linden Animal Control devoted a significant portion of the shelter’s space for their own and their friend’s dogs. The shelter, which took in 226 dogs in 2012, only has 11 kennels. On average, Linden Animal Control would only have 18 days before it ran out of kennel space. Despite this shortage of space, employees used one kennel to house their personal dog and another enclosure to hold a Linden Department of Transportation employee’s dog. Making matters worse, Linden Animal Control only impounds strays (i.e. does not accept owner surrenders) and is licensed as a pound and not a boarding facility. The staff also used another kennel to hold a scale for euthanasia which they are supposedly not doing. As a result, the shelter lost nearly 30% of its already small amount of kennel space due to employees selfish decisions.

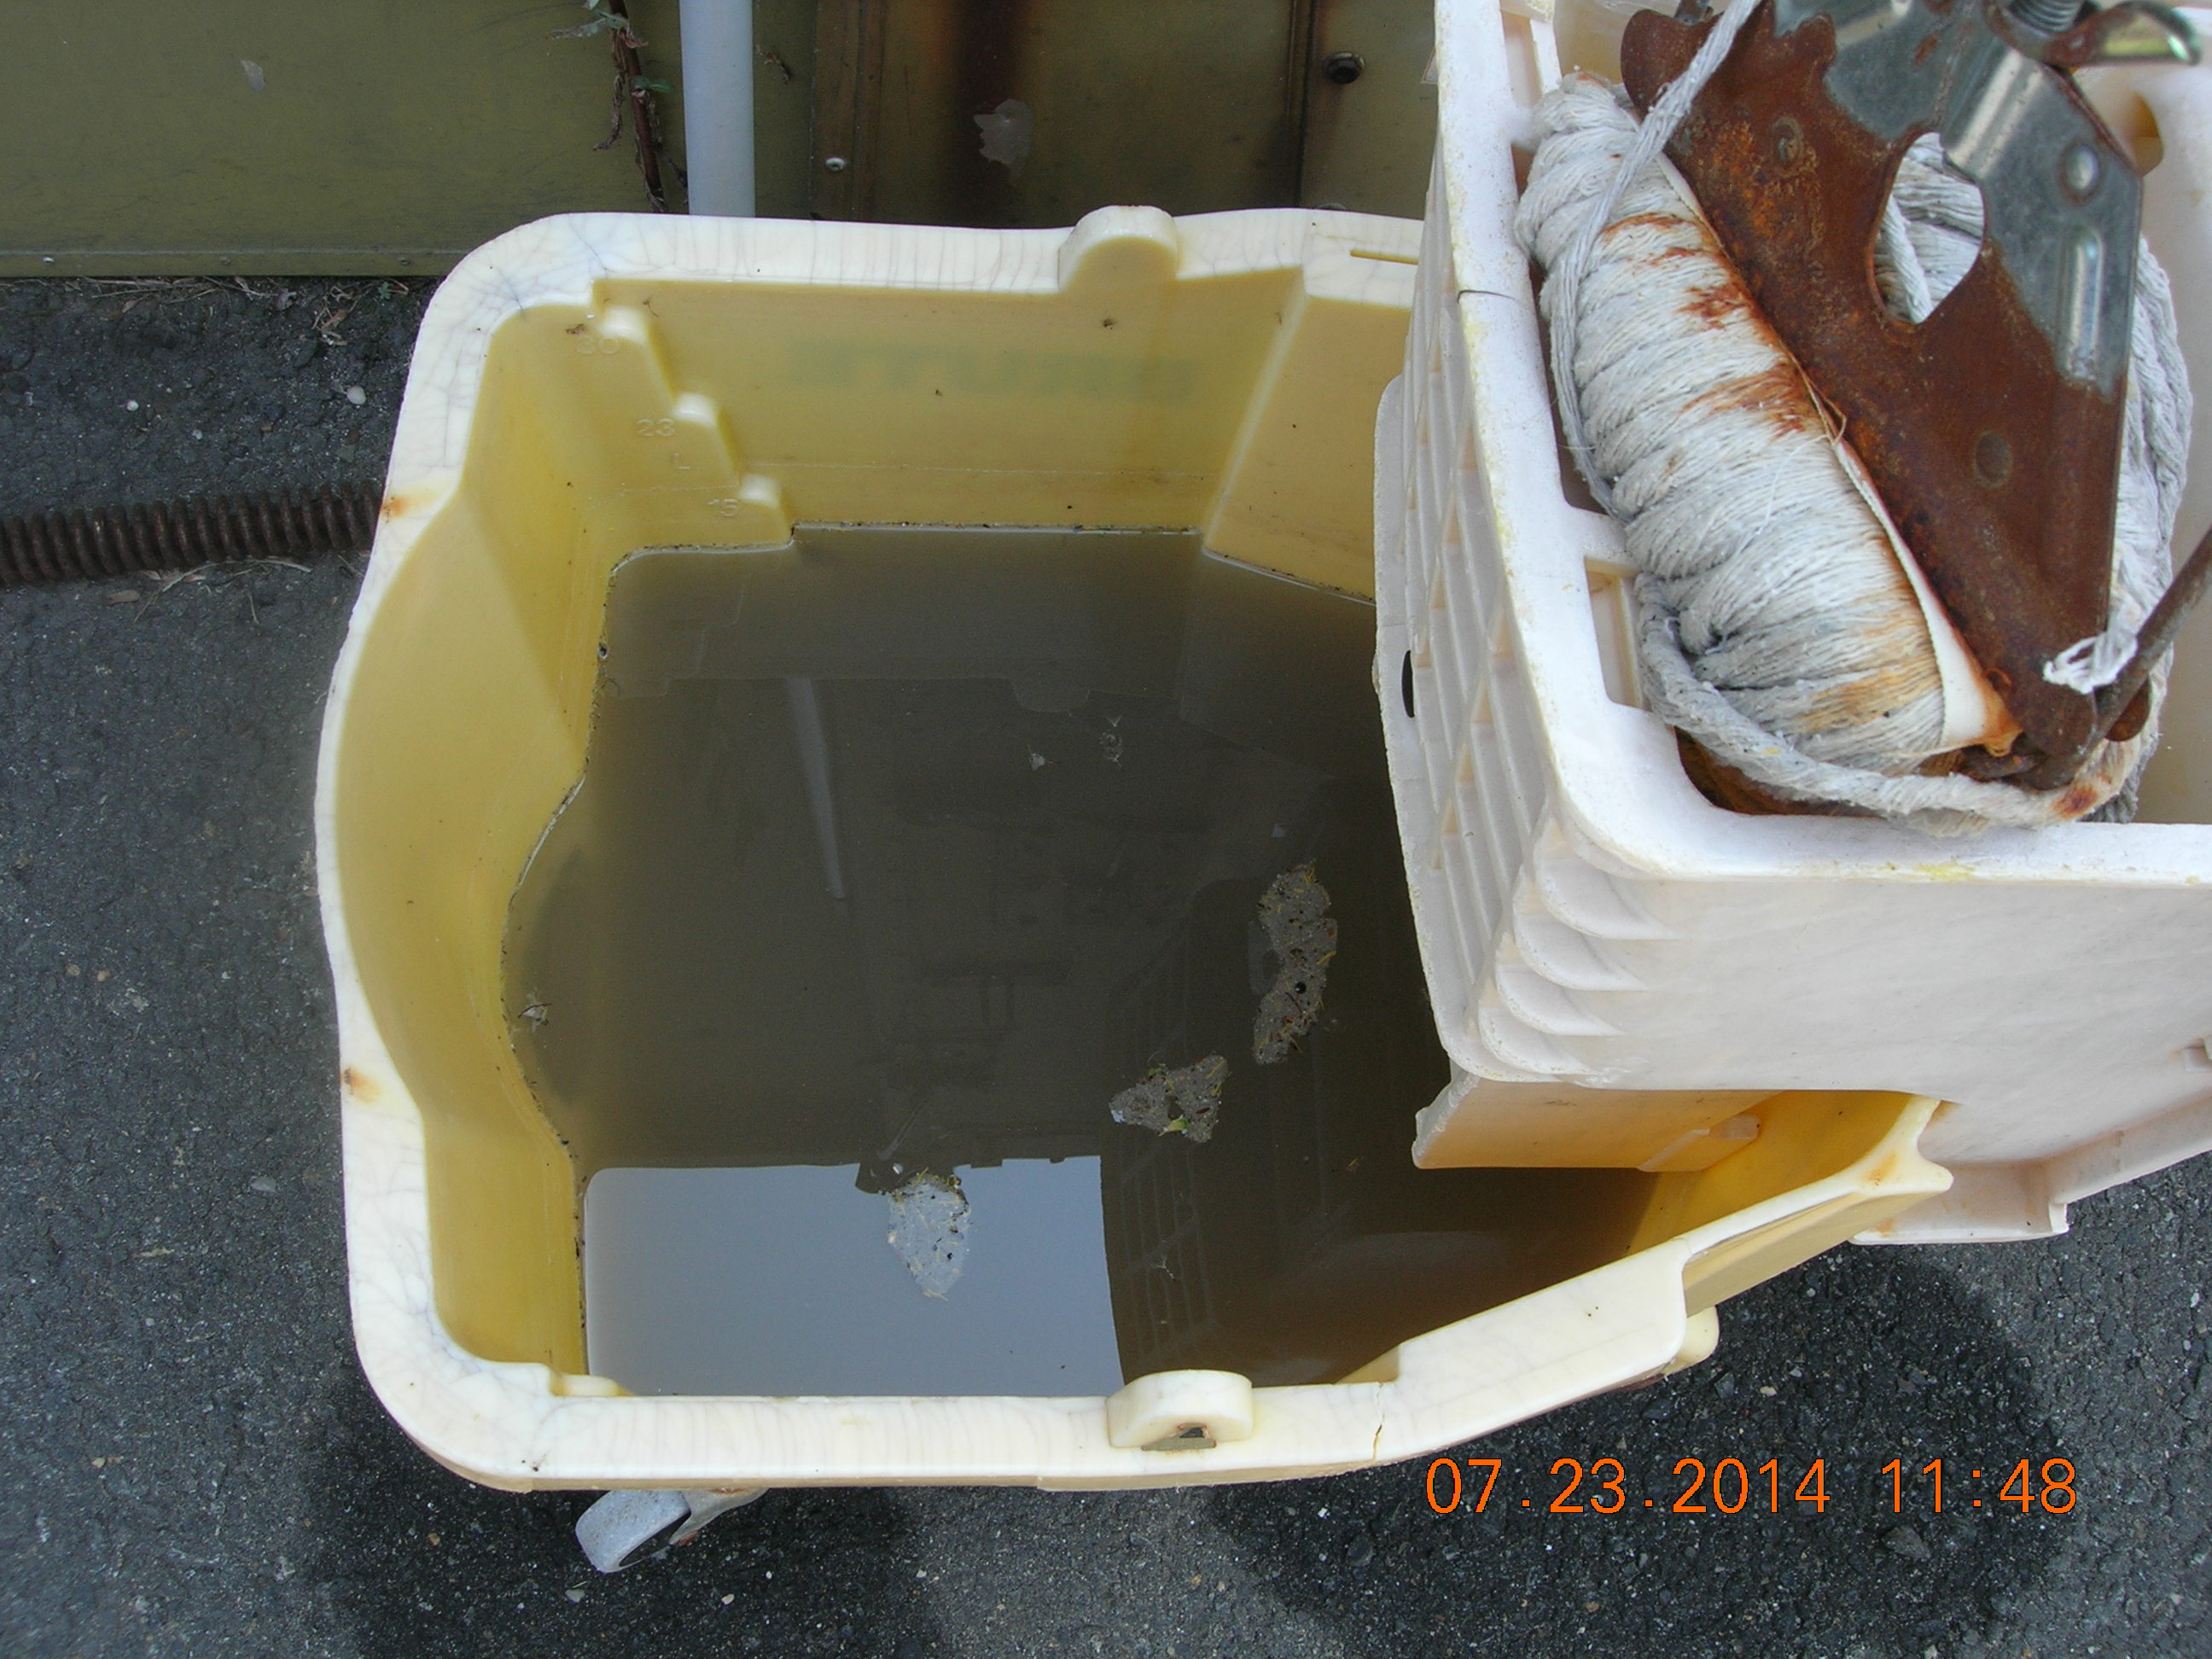
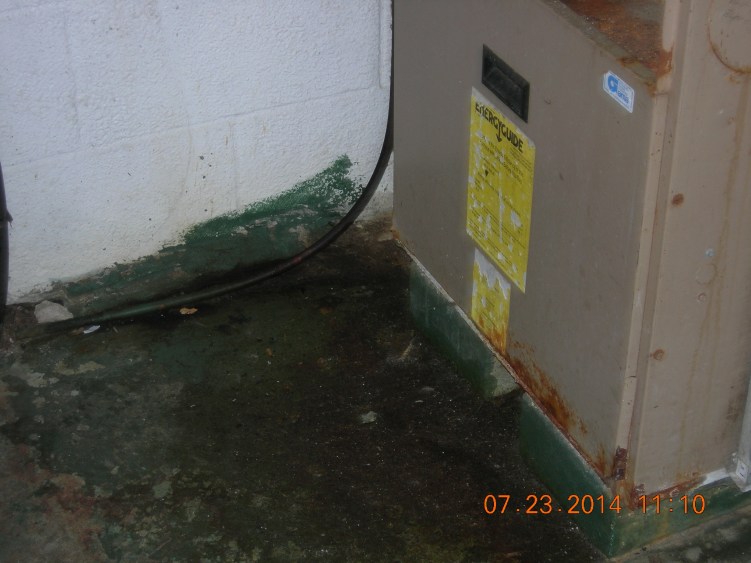
Linden failed to perform even basic maintenance at its shelter. Crumbling cinder blocks, rusted steel posts, dirty food bowls lying around, accumulations of fur and dirt under cat cages, improperly working air conditioning, an oil furnace without its front panel, and overgrowing vegetation engulfing the facility all indicate neglect of the shelter. Similarly, allowing a drainage system to fall into disrepair, which contributed to a feces, urine and chemical soup surrounding the animals like a toxic moat, also indicates the management couldn’t care less about the facility or its animals. In fact, the shelter had holes in the cat room so large that rodents and small mammals could “freely walk in.” To make the shelter more inviting for wild animals, the shelter left open bags of cat food adjacent to these openings. Additionally, if rodents and small mammals were not enough to welcome in, shelter staff allowed a mop to lie in dirty water for god knows how long allowing mosquitoes and other insects to breed at will.

2519 Cat enclosures rusted, stick inside cage

2496 Floor in front of furnace

2498 Mop bucket, dirty water stored outside, rusted mop head

Linden Should Get Out of the Animal Control and Sheltering Business

Mayor Gerbunka’s claim the condition of the shelter was due to Union County failing to build an animal shelter is ridiculous. Employees negligence or downright sadism caused most of these problems. Furthermore, the Union County shelter was not under construction and the idea that it was coming anytime soon is a joke. Additionally, Linden failed to maintain the basic fixtures at the shelter, such as fencing, enclosures, and even doors to the facility. The fact Linden plans to close the shelter at the end of the year and build a new facility clearly shows it failed to do the right thing for many years.

Linden residents must hold Mayor Gerbunka accountable this November. Mayor Gerbunka, in addition to presiding over this disgraceful shelter, has consistently denied the allegations and defended those directly responsible for the situation. Animal advocates need to send a strong message that this behavior has consequences.

Linden, Roselle, Fanwood, Clark, and Winfield residents need to demand a real no kill shelter. All these municipalities will contract with a new facility in 2015. The people running any new shelter must truly care for the animals. Clearly, Mayor Gerbunka Council Member Yamakaitis, Linden Health Officer, Nancy Koblis, and Linden Animal Control staff must have no role in animal control or the operation and oversight of a new shelter. At this time in history, animal control shelters are saving well over 95% of their animals and providing high quality care. We know how to do it and just have to demand it. After all the animals have gone through at Linden Animal Control for decades, the least we can do in those creatures memories is to provide state of the art care for homeless animals in the future.

Additional Information – Key Extracts From Office of Animal Welfare Inspection Report

“The concrete trenches inside the interior and exterior dog enclosures had settled and were in disrepair. Contaminated and stagnant water and excrement collected in these trenches and did not progress to the drain. These trenches and drains were not covered and the dogs housed in these enclosures were not protected from contamination, injury, and disease transmission from the animal waste and chemicals in this water.”

“Feces was not scooped and removed from animal enclosures, but was forced into the drainage trenches with a hose. This action not only increases the risk of contamination of adjacent animal enclosures and animals due to the particles of feces that become air borne when sprayed with a high pressure hose, but large chunks of fecal matter then has to be forced down the trenches toward the drain with the hose. These drainage trenches were not covered inside these animal enclosures and this fecal matter and other waste material had to pass along each animal enclosure, exposing each of these animals in adjacent enclosures to this waste material.”

“Animals in adjacent enclosures were not being protected from water and other waste material when the feces were being sprayed into the drainage trenches. The animal enclosures did not have a barrier between each enclosure to prevent the flow of water and waste materials from contaminating animals and adjacent enclosures. Each time a hose is used in animal enclosures, the animal in that enclosure as well as animals in adjacent enclosures will need to be removed from the enclosures to prevent contamination.”

“The dog enclosures were not sloped appropriately in some areas to allow liquids to run toward the drain. Urine from some of the dog enclosures had streamed into the main walkway at the time of this inspection.”

“There were no grates or other type of coverings over the drainage trenches inside each of the indoor and outdoor dog enclosures. Dogs were not protected from contamination and disease transmission from the animal waste that collected in these trenches.”

“The facility was not being cleaned and disinfected properly. The enclosures were not being cleaned with a detergent followed by a safe and effective disinfectant and feces were not being scooped and removed from enclosures before the enclosures were hosed down. When asked how the facility was cleaned and disinfected on a daily basis, the Animal Control Officer stated that he mixes a half-gallon (8 cups) of bleach into a half-gallon of water and this mixture is poured onto the walls and floors of the animal enclosures. Some of the bottles of bleach found in the facility at the time of this inspection contained a concentration of more than 8% sodium hypochlorite. Bleach to water at a ratio of 1:1 is highly corrosive and could cause eroding of the cinder blocks and other building materials and could also cause skin burns and inhalation injuries to people and animals. The highest concentration of bleach that would be used as a disinfectant for resistant fungal spores in an animal facility is a ratio of 1:10 (1 ½ cups to 1 gallon water) with a product containing 6% sodium hypochlorite. The animals would need to be removed from rooms where this high concentration of bleach is used. The ratio for standard disinfection of animal facilities on a daily basis would be 1:32 (1/2 cup bleach per gallon of water.)”

“The facility did not have a separate isolation room available on the premises to house animals that display signs of communicable disease from healthy animals.”

“Premises were not clean and in good repair to protect animals from injury and disease and to facilitate the prescribed husbandry practices and prevent nuisances. Animal enclosures were in severe disrepair and were unable to be properly disinfected due to the large cracks and chunks of missing concrete in the flooring, around expansion joints, in the walls of the dog enclosures, and in the areas around the guillotine doors. The surfaces of these enclosures were not impervious to moisture and there was a strong odor of urine and animal waste that had permeated these concrete and cinder block surfaces and the odor was unable to be abated, even though the surfaces had been doused with a 1:1 ratio of bleach to water. There was an accumulation of algae or other growth on the mortar joints and the cinder blocks in the outdoor animal enclosures.”

“All areas throughout the facility were not being cleaned on a daily basis. The building was in severe disrepair and the floors, walls, ceilings, exterior doors and other surfaces were not being maintained in good repair.”

“The supervising veterinarian for the facility was said to be Dr. Shukla of the Rahway Animal Hospital, but there was no documentation available at the facility to indicate that a disease control and health care program had been established and was being maintained under the direction of a supervising veterinarian at the facility. There was no evidence that a program to address the psychological well-being of animals, including stress induced behaviors, was in effect at the facility.”

“There were no medical records, no veterinary signatures, and no treatment logs to document that any medical treatments were being or had been administered at the facility and there was no documentation to indicate that a veterinarian had visited the facility and was in charge of a disease control and health care program.”

“Records that were available in the office of the Linden Health Department showed that some animals were described as displaying signs of illness and some of these animals had died at the facility. There were no medical records available to indicate that these animals were provided with at least prompt basic veterinary care to relieve pain and suffering.”

“An emaciated female dog, ticket number 1054, was picked up on 7/22/14 according to the information on the ticket, and was taken to an animal hospital for emergency veterinary care before being transported to the impoundment facility. This dog was said to have been prescribed Panacur (prescription brand of Fenbendazole) by a local veterinarian for the treatment of roundworms and Giardia. This medication is required to be given three days in a row to be effective against certain species of roundworm, hookworm, whipworm and tapeworm and up to five days in a row for Giardia, but only one packet was found in the pouch on the gate of her enclosure on the date of this inspection. There were no records documenting that this medication had been administered, when it may have been administered, and by whom it may have been administered. This dog was also prescribed a feeding regimen by the veterinarian. Instructions indicated that this dog was to be fed small amounts of canned food every four hours; but there were no treatment records available on the premises to document that this dog had been fed as instructed.
This dog also had enlarged and distended teats and may have recently nursed puppies before being impounded. This dog was displaying signs of stress at the time of this inspection; she was pacing from side to side and was snapping at the dogs housed on either side of her enclosure. This dog was not provided with any means of stress relief, such as separation or barriers to prevent the direct view of other dogs, soft bedding, and a clean, dry environment, free from the strong odor of urine and the scent of other bodily secretions that had permeated the porous concrete in the dog enclosures.”

“The facility did not have an isolation room to separate animals with signs of a communicable disease and there were no procedures in place at the time of this inspection to control the dissemination of disease as recommended by the supervising veterinarian.”

“Records indicated that numerous animals that were impounded by Linden Animal Control Officers were not being held for the required seven day holding period before being euthanized, transferred or adopted. Records also indicated that numerous cats had escaped soon after being transported to the facility.”

“No records were available at the facility to indicate that a written description of lost animals and proof of ownership, such as a license for or picture of the animal, was being obtained from persons searching for lost pets. There were no procedures and security measures established at the facility for the viewing of confined animals to prevent the spread of disease.”

“Since the date of this inspection, the NJDOH has received documentation indicating that at least two impounded dogs had been transferred out of the facility before being held the required seven days. One dog, number 1054 described previously, had been transferred to another non-contracting animal facility due to the inability of the Linden Animal Shelter staff to

“The certifications signed by various veterinarians for the three persons administering animal euthanasia at the facility did not state the technique or techniques for which the individuals were certified.”

“It was not determined at the time of this inspection where the euthanasia procedures were carried out. Written instructions for euthanasia is required to be posted in the euthanasia area. This area should not be in the direct view of or within close proximity of other animals housed at the facility to prevent undue stress that may be caused to animals housed in the vicinity.”

“Records were not maintained on the premises that contained the body weight and dosages of the immobilizing and tranquilizing agents administered to each animal being euthanized. There were no records created or maintained that indicated the route of injection of each substance administered to animals as required. There was a bottle of Ketamine on the premises that had been used, as evidenced by the needle punctures and a crystalized residue on the rubber stopper of the bottle. There were no logs and disposition records on the premises documenting the appropriate use of this drug.”

“Some records did not contain complete information as required for animals that had been impounded or otherwise taken into the facility and the final disposition was not being recorded
or was incomplete on most of the documents for impounded animals. There were no medical records available for animals that may have received veterinary medical treatment; and the method of euthanasia, including the dosages by weight and the route of injection, was not being recorded in the animal’s final disposition record for the animals that had been euthanized.”

“When the owner’s identification or other form of identification that could be traced back to the owner was found on an animal picked up by Linden Animal Control Officers, no records were available to indicate that notification was being served by the Animal Control Officers to the owners or persons charged with the care of the animal that the animal had been seized and would be liable to be offered for adoption or euthanized if not claimed within seven days after service of the notice.”

“The facility did not have a certificate of inspection issued by the local health authority showing compliance with these rules. There was no documentation at the facility indicating that the facility was licensed to operate as required under N.J.S.A. 4:19-15.8. The application for licensure shall be accompanied by the written approval of the local municipal and health authorities showing compliance with the local and State rules and regulations governing the location of and sanitation at such establishment. This facility was not in compliance with State rules and regulations at the time of this inspection, which is a prerequisite for licensing.”

“There were two dogs at the facility that were not impounded animals, but were said to be owned by municipal or other employees. One dog was being housed at the facility for long term boarding, but there were no records or other identifying information for the dog or the employee. Another dog was said to be surrendered by its owner and the owner was a Department of Transportation employee. There was no owner information for this dog on the animal’s ticket and there were no other records available for this dog. This facility was not licensed as a boarding kennel at the time of this inspection. The facility has eleven dog enclosures available to house impounded animals for five municipalities, including Linden. One of these enclosures was being used to store the scale for animal euthanasia, and two other’s housed employee’s dogs, and one enclosure housed a dog being held under a court order, leaving seven available enclosures to house impounded animals.”

“The housing facilities for animals were not maintained in good repair, to protect the animals from injury, to contain the animals, and to restrict the entrance of other animals. The soffit panels over the exterior dog enclosures had fallen down and the attic roof space was exposed. This space was large enough to allow wildlife and other animals to enter the building.”

“There were holes in the ceiling of the cat room; one appeared to be for a pipe which had been removed and one was a framed access opening with no panel with which to cover it. This access opening in the ceiling of the cat room was large enough to allow easy escape into the attic space and out of the building through the fallen soffit panels over the exterior dog enclosures. A portion of records that were reviewed documented that ten cats had escaped from the facility within a 16 week period.”

“There was a hole in the wall in the cat room with a white PVC pipe in it that led directly to the outside of the facility and was large enough for rats and other small animals to enter and exit freely. There was a hole in the floor in the cat room which could have originally been some type of drain, but its function was unable to be determined. This hole was not covered and contained an accumulation of cat litter, food, and other waste material.”

“The exterior concrete slab under and surrounding the steel posts which were supporting the roof of the facility was crumbling and the steel posts were severely rusted and deteriorated. The cinder blocks of the lower section of the interior and exterior wall of the building which were surrounding the guillotine doors inside the dog enclosures were separating and the blocks were showing signs of deterioration. The cinder blocks at the end of the wall of the building in the exterior dog enclosures were separating outward from the top of the wall, creating a diminishing gap from top to bottom along the blocks in a step pattern. The steel access door to the underground concrete utility or valve box where the pipe clean outs were located was severely rusted and the hinges were rusted into a position that prevented the lid from closing completely.”

“There was a mop bucket and string mop attached to a severely rusted mop handle that was sitting outside in front of this green metal structure. This bucket was filled with dirty water and appeared to have not been used for some time and was creating a harborage for mosquitos and other water breeding insects.”

“Although the main entrance gate was locked on the morning of this inspection, the exterior door to the main indoor housing area of the facility was ajar and the facility was left unlocked when the animal control officer left the facility. There were no other employees or volunteers at the facility at that time.”

“Inside the building there was an accumulation of food, fur, dirt, and other materials under cat cages, between the filing cabinet and refrigerator, around and behind the utility sink, around and behind the furnace and the base of the wall, and there was a buildup of dirt on the floors in front of the furnace and other areas throughout the facility. There were cobwebs and debris around the wiring that passed through the walls below the ceiling and there were cobwebs and debris around the open bags of food and other items stored in the cat room.”

“The oil furnace had a large rusted area above the oil burner assembly. The facility had working air conditioning at the time of this inspection, but the Health Officer said the unit has to be watched because it was not working properly; it freezes up and the unit shuts down. The unit needs to defrost before it can be started up again. The front panel for the oil furnace that was said to be missing was found during the inspection, but the screws to attach it to the front of the furnace were missing.”

“The concrete flooring in the cat room was in disrepair and was not smooth in many areas and was not easily cleaned and disinfected. The interior and exterior surfaces, including the doors of the cat enclosures were rusted and peeling and unable to be properly cleaned and disinfected.”

“Surfaces of the indoor and outdoor dog enclosures were severely deteriorating, had cracks and chunks of broken concrete in some areas, and the multiple layers of paint on these surfaces had peeled off and the surfaces were not impervious to moisture and able to be readily cleaned and disinfected. There were numerous areas of unsealed concrete that was not impervious to moisture and was unable to be disinfected. The plastic dog beds used inside the enclosures were scratched and chewed in some areas and had crevices that were unable to be properly cleaned and disinfected.”

Disrespecting Your Shelter’s Hometown Leads You Down the Wrong Road

Associated Humane Societies – Newark’s Assistant Executive Director, who is the organization’s number 2 ranking person and representative in many media interviews, posted an insulting joke about Newark’s residents on his personal Facebook page recently. The photo is identical to the following image except “New Jersey” replaces “Ohio “and” “Newark” takes the place of “Michigan.”

Ohio Shadowy place

Additionally, several of Associated Humane Societies – Newark’s employees also commented about how much they liked the photo. Associated Humane Societies – Newark operates a large animal shelter in Newark and receives up to $632,000 in animal control contract fees from the city of Newark.

This behavior demonstrates a clear disrespect for Associated Humane Societies’ community. Telling your shelter’s hometown they live in a “shadowy place” and “you should never go there” is deeply insulting. If you lived in Newark, would you want to support this shelter? Perhaps, this attitude towards the city’s residents along with a past scathing investigation and poor performances in Office of Animal Welfare inspections in 2009 and 2011 led to the popular Cory Booker administration’s displeasure with Associated Humane Societies.

The remark sends the message to people outside of Newark to not visit the shelter since the facility is in a “shadowy place” that “you must never go” to. The “you must never go to Newark” message makes even less sense when you consider  Associated Humane Societies, to the best of my knowledge, does not adopt out dogs at its off-site events (i.e. you have to go back to the shelter in Newark to adopt the animal you meet outside of the shelter). As a result, the Assistant Executive Director of Associated Humane Societies’ Facebook post hurts the cause of his shelter’s animals.

Unfortunately, Associated Humane Societies’ attitude toward its hometown has an even more detrimental effect on shelter policy. In an article last year, the same Assistant Executive Director stated he wanted more stringent spay/neuter laws and backyard breeder bans to reduce Associated Humane Societies unacceptably high kill rates. KC Dog Blog, which is written by Kansas City’s no kill open admission shelter’s Board President, clearly demonstrates how Kansas City’s pit bull mandatory spay/neuter policy increased impounds and kill rates. Additionally, KC Dog Blog also documents most large animal welfare organizations, such as the ASPCA, Best Friends, Humane Society of the United States (via the California Sheltering White Paper), No Kill Advocacy Center and the American Veterinary Medical Association oppose mandatory spay/neuter laws. Such laws increase impounds and shelter killing and also waste limited resources which could be used more productively. The main barrier to spay/neuter is cost for poor folks and mandatory spay/neuter laws with their punitive fines simply exacerbate the problem. Similarly, breeding bans, which sound great, are also ineffective and drain limited resources as evidenced by Long Beach, California’s 30 year breeding ban’s failed efforts at achieving a no kill community.

The “irresponsible public” argument and resulting attitude communicated by Associated Humane Societies represents a huge obstacle to creating a no kill community. While the shelter’s personnel may have negative experiences with the public, those interactions are not representative of the entire population. Newark most likely is more responsible than the average American community. Associated Humane Societies – Newark took in approximately 8 dogs and cats per 1000 residents in its service area during 2012. Unfortunately, we do not know what the city of Newark’s per capita intake rate is since Associated Humane Societies impounds dogs and cats from numerous other communities. However, the nearby urban communities of Elizabeth, Paterson plus surrounding towns and Jersey City – Hoboken took in approximately 7 dogs and cats per 1000 people. Nationally, Maddie’s Fund states the average community impounds 14.5 dogs and cats per 1000 people. Thus, Newark likely impounds around half the number of animals as the average American community on a per capita basis. Therefore, “shadowy” Newark is likely more responsible than many less “shadowy” places.

Associated Humane Societies – Newark’s animals would benefit greatly from a significant change in attitude. While Associated Humane Societies prefers to blame the not so irresponsible public for killing shelter animals, the blame lands squarely with the shelter. Associated Humane Societies – Newark needs to stop fighting successful no kill policies and enthusiastically implement these programs to quickly move animals from the shelter into loving homes. Personally, I’d suggest following KC Pet Project’s model which made Kansas City a no kill community 18 months after taking over the shelter. As recently as 2008, this shelter killed more than 60% of its impounded animals. However, KC Pet Project now saves roughly 90% of its animals despite taking in around twice as many dogs and cats in total and per capita as Associated Humane Societies – Newark.  KC Pet Project accomplished this without Associated Humane Societies’ vast financial resources and with an undersized and outdated primary shelter having only one third of the recommended capacity.

Associated Humane Societies should also implement targeted spay/neuter and pet owner support programs to help struggling pet owners in areas with higher impound rates. For example, the ASPCA’s Operation Pit in New York City and Monmouth County SPCA’s Pittie Project programs offer free spay/neuter, vaccinations and microchips to pit bulls. Spay & Neuter Kansas City provides another great example of not only substantive programs, but a helpful and nonjudgmental attitude towards the people requiring help. This organization literally goes door to door in some of the poorest neighborhoods to help struggling pet owners. As a result of these programs and relationship with the community, Spay & Neuter Kansas City assisted over 15,000 people with spay/neuter surgeries, veterinary services, and pet outreach programs in 2013.

Let’s drop the “shadowy” jokes about people and get onto helping folks and their animals. That is how you save lives!